Abstract
Cooking-generated aerosol characterization is crucial for providing an accurate evaluation of human exposure to particle concentrations. In addition, when evaluating the dimensional properties of aerosols emitted from cooking activities, one key aspect to be investigated is the composition of the particles emitted. To this end, an evaluation of the volatility of cooking-generated aerosol particles was performed in this study. Total concentration and size distribution measurements were carried out using a thermal conditioning device, along with a scanning mobility particle sizer (SMPS) and an aerodynamic particle sizer (APS), in order to evaluate the amount of volatile material emitted by different cooking activities (frying and grilling), as well as those involving different kinds of food (fatty and vegetable foods). The results showed a shift in the dominant size distribution mode toward smaller diameters with higher aerosol conditioning temperatures. The corresponding total number concentrations were roughly constant when fatty foods were cooked, but a significant reduction in total particle concentration was observed when vegetable foods were fried or grilled. These results seem to demonstrate the presence of a nonvolatile core when cooking fatty foods. The larger volatile fraction associated with vegetable food cooking is also demonstrated by comparing the nonvolatile surface area and volatile mass distributions for each cooking activity, in order to evaluate the particle's chemical and physical effects on human being.
INTRODUCTION
In recent years, a number of studies have focused on the physical and chemical characterization of aerosols in order to evaluate human exposure to particle concentrations in indoor environments (Abt et al. Citation2000a, Citation2000b; See and Balasubramanian Citation2006a, 2006b; Wallace et al. Citation2008; Buonanno et al. Citation2009b). This increasing technical and scientific interest in aerosol science has been stimulated by medical findings relating high particle concentration exposure to negative health effects (Kreyling et al. Citation2006; Pope and Dockery Citation2006). However, opinion within the medical community is not unanimous when it comes to stating which aerosol physical properties are most strongly linked to health effects, and attention has shifted between mass concentration (PM) (Loomis Citation2000; Pope Citation2000), number concentration (Hauser et al. Citation2001), and surface area concentration (Driscoll Citation1996; Giechaskiel et al. Citation2009). In addition, particle size is strictly related to negative health effects because particles of different sizes deposit in different regions of the respiratory tract, leading to varying adverse effects (International Commission on Radiological Protection Citation1994; Wang Citation2005).
In order to fully assess overall personal exposure to aerosols, indoor particle concentrations must also be considered along with outdoor aerosol exposure (urban background, rural background, in the proximity of highway and industrial plants). This is especially important given that in many countries, people spend most of their time (80%–90%) indoors, where cooking represents one of the most significant particle-generating activities (Ozkaynak et al. Citation1996). A number of studies have measured the particle number concentration and size distribution of particles generated during cooking (Li et al. Citation1993; Abt et al. Citation2000a, Citation2000b; Brauer et al. Citation2000; Dennekamp et al. Citation2001; He et al. Citation2004; Wallace et al. Citation2004, 2008; Hussein et al. Citation2006; See and Balasubramanian Citation2006a, Citation2006b; Yeung and To 2008; Buonanno et al. Citation2009b). For example, Buonanno et al. (Citation2009b) published important information on risk assessment in indoor microenvironments in which particle size was considered as a function of the cooking activity, the temperatures used, and the cooking appliance technology.
In addition to the size and concentration of the aerosol, the chemical properties must also be considered. These are important not only from the point of view of the toxicity of the material itself but also because its solubility and volatility may influence the behavior of the particles after deposition in the respiratory tract and also the potential health effects. Therefore, when considering exposure in indoor microenvironments, it is important to also evaluate the volatile and semivolatile fractions of the aerosol. The chemical analysis of the volatile fractions of aerosols produced in various cooking activities has been reported in the scientific literature for a range of foods. For example, the volatile flavor compounds of cooked meat are formed through lipid oxidation and through the Maillard reaction (Mottram Citation1998). Compounds from lipid oxidation include straight chain aldehydes, ketones, hydrocarbons, alcohols, and alkylfurans, while volatile compounds from the Maillard reaction include heterocyclic nitrogen and sulfur compounds, such as pyrazines, thiophenes, and thiazoles, as well as furanones and furfurals. Nonheterocyclic compounds, such as 2- and 3-methylbutanal, benzeneacetaldehyde, alkanediones, and hydroxyketones, are also produced in the Maillard reaction, as well as aliphatic and furan disulfides (Elmore et al. Citation2000). Elmore et al. Citation2004 presented a summary of the volatile compounds produced due to the meat grilling, in which they identified sixty-nine volatile compounds, including twenty-three hydrocarbons in addition to alcohols, ketones, aldehydes, etc. Byrne et al. (Citation2001) performed an analysis of the volatile compounds produced when cooking chicken patties and found twenty-six volatile components, most of which represented well-known products of lipid oxidation, including aliphatic alkanes, saturated and unsaturated aldehydes, ketones, and 1-octen-3-ol.
The evaluation of an aerosol volatile fraction is of great interest to researchers examining a wide range of aerosols, including those found in diesel engine exhaust particles (Sakurai et al. Citation2003; Rönkkö et al. Citation2007; Biswas et al. Citation2009; Kirchner et al. Citation2009), traffic emissions (Kuhn et al. Citation2005a, Citation2005b), rural locations (Engler et al. Citation2007), and in coastal areas (Johnson et al. Citation2005). This interest stems both from the relevance of the particle volatility to the potential health impacts of the aerosol and also from its relevance to understanding the composition of the particles, the mechanism of particle formation, and the aging of the aerosol during dilution, dispersion, and transport.
In this study, after the measurement of the emission factors (EFs) of several fat-rich (cheese, pork meat, and bacon) and vegetable (eggplants, onion, and chips) foods, a volatility analysis of the particles emitted from different cooking activities (grilling and frying) was carried out in order to estimate the fraction of volatile and semivolatile compounds within the particles. A thermodilution system made of a rotating disk thermodiluter and a thermal conditioner (RDTD) was used, together with a scanning mobility particle sizer (SMPS), to perform the volatility assessment, measuring particle size distributions with and without aerosol thermal conditioning, as well as an aerodynamic particle sizer (APS). An alternative method of risk assessment for people exposed to particle concentrations has also been presented. As reported in Giechaskiel et al. (Citation2009) for diesel emissions, in addition to considering the particle size distribution, an assessment of the health effects of aerosols should take into account other physicochemical properties, such as the fractions of soluble and volatile material, as these may influence the biological response to exposure. For diesel fuel combustion aerosols, the volatile fraction is assumed to dissolve in the fluid in the lung so that the biological effect is attributed to the chemical composition of the volatile component. The volatile mass concentration distribution can be considered as an appropriate metric for this chemical effect of the aerosol.
The nonvolatile mass fraction mainly contains black carbon (BC), which is slightly soluble in the lung fluid, generating reactive oxygen species that cause oxidative stress on epithelial cells (Donaldson et al. Citation2001). The biological response to the deposited nonvolatile fraction primarily depends on the accessible particle surface area (a particle physical property). We refer to it as the physical effect, choosing aerosol surface area distribution obtained through the thermal conditioning as an appropriate metric for the related health effects.
EXPERIMENTAL ANALYSIS
Experimental Apparatus
The measurement campaign was conducted using an SMPS (3936 SMPS, TSI, Inc.), an APS (3321 APS, TSI, Inc.), and a thermoconditioning device. The SMPS 3936 consists of a 3080 Electrostatic Classifier and a 3775 Condensation Particle Counter (TSI, Inc.), through which the measurement of particle size distribution and total number concentration in the range 0.006–0.9 μm can be performed. Surface area and volume distributions were also carried out from the particle size distribution by considering spherical particles (Buonanno et al. Citation2009a). Another condensation particle counter (CPC) 3775 (TSI, Inc.) was used to continuously monitor the total number concentration during the volatility analysis, as reported in the Methodology section. The thermoconditioning was carried out through a thermodilution system known as rotating disk thermodenuder (RDTD), made up of rotating disk thermodiluter (379020—Matter Engineering AG) and a thermal conditioner (379030—Matter Engineering AG), which were connected in series ahead of the SMPS 3936. Particle size distribution in the range 6.0–220 nm was measured at an aerosol flow rate of 1.5 L min−1. Given that the flow path leading to the SMPS 3936 was quite long, it was important to correct for diffusion losses, especially when examining particles smaller than 100 nm, because in this size range, diffusion becomes increasingly significant. Therefore, the penetration efficiency of the sampling line was used to correct the size distributions and total concentrations resulting from the measurement campaign. Therefore, the thermodilution line was subdivided into eight different sections of tubing, each with a distinct combination of internal diameter and flow rate, as reported in .
FIG. 1 Scheme of the thermodilution line used in the experimental analysis. (Figure provided in color online.)
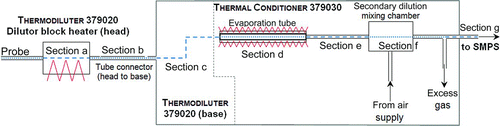
Particle penetration efficiency (and hence diffusion loss correction) was also assessed for each section by using the model proposed by Gormley and Kennedy (Citation1949). Higher diffusion losses for ultrafine particles (UFPs) were found in the long tube connecting the head and the base of the rotating disk thermodiluter, where a 2-s particle residence time resulted in an UFP penetration efficiency of about 50% for the smallest diameter channels of the size distribution. In order to reduce particle deposition on the tube wall, a laminar flow was guaranteed in each subsection of the sampling line (maximum Reynolds number was about 500), which is a fundamental issue because of increasing diffusion losses due to the turbulent flow. A summary of the particle residence time and Reynolds number evaluated for every subsection of the thermodilution line is reported in . Measurements were also performed with and without thermal conditioning of the aerosol, in order to show the dependence of particles’ volatility on the cooking activity and the type of food.
TABLE 1 Sections of the thermodilution line: particle residence time and Reynolds number
The APS (Model 3321, TSI, Inc.) measures particle number concentration in the size range of 0.5–20 μm. The measurement is based on the time of flight (TOF) calculation (average velocity across the timing gate) of the particle at the exit of an accelerating nozzle.
Experimental Methodology
Measurements were carried out in the European Accredited (EA) Laboratory of Industrial Measurements (LAMI) at the University of Cassino, Italy, in a 50 m3 room where thermohygrometric conditions were continuously monitored, in order to guarantee temperature and relative humidity values equal to 20°C ± 1°C and 50% ± 10%, respectively. A domestic kitchen was set up inside the laboratory, with gas stoves (mixture of butane and propane), and the ventilation conditions were kept constant during the experimental campaign (doors and windows closed, with the mechanical ventilation in operation). The air exchange ratio (AER) was measured on the basis of the CO2 decay curve (He et al. Citation2004), using a TSI Model 7515 IAQCALC resulting equal to about 2.2 h−1.
In order to estimate the emission of sources placed indoor, the average number emission factor (NEF) for several cooking activities was evaluated. The NEF was estimated through the equation proposed by He et al. (Citation2004) and hereafter reported. This formula derives from the averaging of the mass balance equation used to predict indoor air particle concentration levels and further assumptions about the experimental conditions as reported in He et al. (Citation2004):
Measurements aimed to determine the EFs were made at a distance of 2 m from the stove and the procedure for the cooking activities (both grilling and frying) was as follows: 5 min of background measurements, followed by measurements throughout the duration of cooking and then a further 30–40 min of measurements after the cooking had ceased. Each EF value reported in the results represents the mean value of at least three tests and was calculated according to EquationEquation (1).
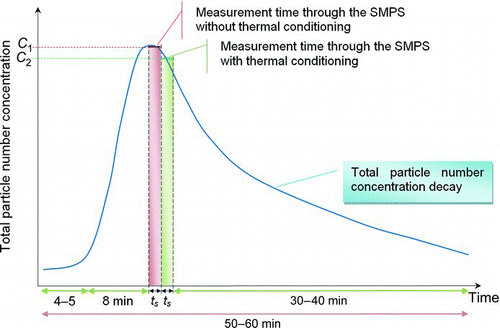
As regards the volatility analysis, measurements used a sampling time of 120 s and alternating samples were taken with and without thermal conditioning. In particular, due to particle deposition and air exchange, the particle concentration tended to diminish during the measurement sampling time (Buonanno et al. Citation2009b), as reported in . The particle size distributions presented in this study refer to the time of the peak of the total number concentration time series, obtained by simultaneous measurements using the CPC. The SMPS has a sampling time higher than CPC; thus, in order to correctly compare particle size distributions measured (through the SMPS) with and without thermal conditioning, the channel concentration values of the particle size distributions obtained through the thermal conditioning (measured when the particle number concentrations were already decaying as reported in ) were multiplied by the correction factor C 1/C 2. Here, C 1 represents the average number concentration determined during the sampling time without thermal conditioning (carried out through the CPC) and C 2 is the average number concentration measured during the sampling time with thermal conditioning (carried out through the CPC).
FIG. 2 Typical total number concentration trend during a cooking activity: ts represents the sampling time (2 min) with and without thermal conditioning. (Figure provided in color online.)
Cooking experiments were repeated as the conditioning temperature was changed: they are summarized in and tests were classified as a function of cooking activity, type of food, and conditioning temperatures. The amount of food cooked (m) varied between 50 and 100 g and was weighed by using a mass balance.
TABLE 2 Description of the experimental methodology for the volatility analysis: experimental classification as a function of cooking activity, type of food, and conditioning temperatures
In order to consider the dependence of the emission to the amount of food, the NEFs are divided by the mass of the food cooked, thus obtaining the number particle emission factor for unit mass (NEFm ):
RESULTS
shows the NEFm values for fat-rich (pork meat, cheese, and bacon) and vegetable (onion, chips, and eggplants) foods, both for grilling and frying cooking activities. The following conclusions were drawn from the NEFm evaluation: (i) for the cooking activity and type of food being the same, the variation of the EFs is very low (the highest variation is 11%). For this reason, in the following volatility analysis, the authors select only one of the fat-rich and vegetable foods for each cooking activity. (ii) The EFs of fat-rich foods are greater than the ones referred to vegetable foods, both for the grilling and the frying activity. (iii) The EFs of frying are greater than the ones corresponding to the grilling cooking activity for the type of food being the same.
TABLE 3 Number emission factor for unit mass (NEFm ) and maximum number concentrations for 100 g of food (N max) as a function of the type of food and cooking activity
In , the maximum number concentrations evaluated for 100 g of food (N max) are also reported. For these values, the same above-mentioned considerations can be carried out. They mainly depend on the room volume and the particle deposition and air exchange rates. Particle size distributions for all of the cooking experiments without thermodilution are reported in . The figure shows higher peak concentration values when fatty foods are cooked with respect to vegetables, using both grilling and frying, which is in good agreement with the results of the cooking activity experimental analysis reported in Buonanno et al. (Citation2009b).
FIG. 3 Particle number distributions for cooking fatty and vegetable foods (100 g) through frying and grilling activity. The dashed line represents the particle number distribution emitted by the gas stove. (Figure provided in color online.)
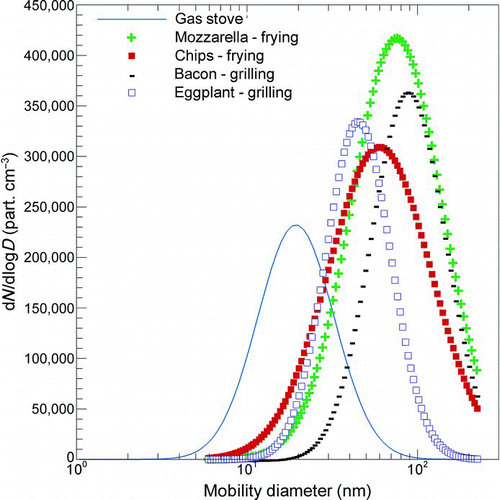
This phenomenon results in a corresponding lower total number concentration for vegetable foods, as also reported in . By comparing the particle number distributions during frying and grilling, higher emissions can be observed in the first case. The relationship between frying and higher number concentrations could be explained by the presence of the oil when frying, which can emit semivolatile compounds that rapidly condense, forming new liquid nuclei.
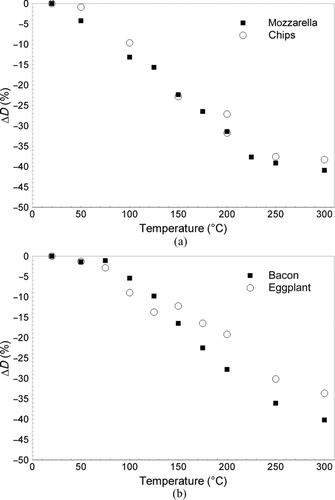
The percent shrinkage of the count median diameter (CMD) for the mode of heating (named “mode decay”) measured by varying the thermal conditioner temperature is shown in . As expected, the higher the operating conditioning temperature, the larger is the amount of semivolatile compounds that evaporated. During frying, the mode decay was observed up to 250°C for both fat and vegetable foods (), whereas the decay remained until 300°C and perhaps may have continued to a higher temperature for grilling ().
FIG. 4 The mode decay in the case of (a) frying and (b) grilling.
Further information about the volatile fraction of the cooking-generated aerosols was extracted from the analysis of particle size distributions. presents particle size distributions in the 6–220 nm range, for both frying and grilling, with (300°C) and without thermal conditioning. Channel distribution uncertainty values were also reported on the basis of the uncertainty budget model proposed by Buonanno et al. (Citation2009a).
FIG. 5 Particle size distributions with (300°C) and without thermal conditioning for (a) frying and (b) grilling cooking fatty and vegetable foods (100 g). Channel concentration uncertainty values are evaluated through the model reported in Buonanno et al. (Citation2009a). (Figure provided in color online.)
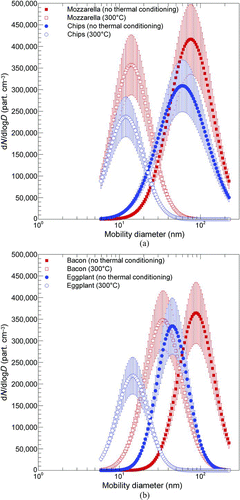
All four distributions, representative of the different cooking and food combinations (frying of vegetable and fatty foods, and grilling of vegetable and fatty foods), show a shift of the mode toward lower diameters when thermal conditioning is applied. Further, a significant difference in the total number concentration among fatty and vegetable foods was also observed when thermal conditioning was in operation. In fact, in , the peak number concentration is shown to decrease when moving from no thermal conditioning to thermal conditioning (300°C), but only when vegetable foods are considered. In the case of fatty foods, this trend was only observed in the case of frying, mostly due to the presence of the oil (). Furthermore, all of the thermodiluted distributions seemed to level off at around 10–15 nm, with the exception of bacon that presents a thermodiluted mode distribution at around 35 nm. Thus, all of these aerosols had a 10–15 nm core, probably produced by the flame itself, and the volatile components from the food condensed onto that common core. Otherwise, the bacon aerosol has not finished releasing the volatile components, thus fully exposing the nonvolatile core. Particle emissions of the flame itself were characterized by Buonanno et al. (Citation2009b) who found that a significant amount of particle number concentration was emitted by the flame. In , the particle number distribution of the aerosol emitted by the gas stove is reported. It presents a peak corresponding to an aerodynamic diameter equal to 17 nm. Thus, the flame itself provides low volatile carbon (soot) nuclei, on which more volatile layers condense. This behavior is confirmed by the absence of the peak relative to the flame emission itself when foods are cooked, as reported in the particle size distributions without thermal conditioning in .
TABLE 4 The percentage reduction of total number, surface area, and volume particle concentration in the 6–220 nm range for fatty and vegetables food when thermal conditioning at 300°C is used
In , the percentage reduction of the total number, surface area, and volume particle concentration in the 6– 220 nm range for fatty and vegetable foods are shown. These data highlight the significant reduction in the total number particle concentration when vegetable foods are cooked. Very high percentage reduction of the total volume particle concentrations also confirms the larger amount of volatile matter produced when cooking both vegetable and fat-rich foods, representing the volume fraction that was volatilized. The percentage reduction of the surface area is also reported in , because it is strictly related to the health effects of the nonvolatile cores. Furthermore, the mechanism of vapor condensation onto the cores during the early stages of particle formation strictly depends on the surface area.
FIG. 6 Surface area distributions of nonvolatile matter generated by cooking fatty and vegetable foods (100 g) through frying and grilling processes. (Figure provided in color online.)
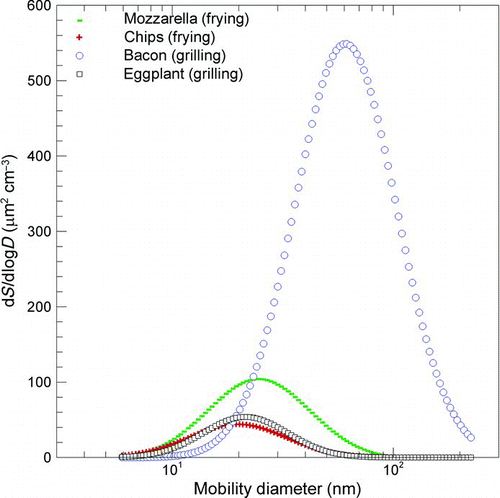
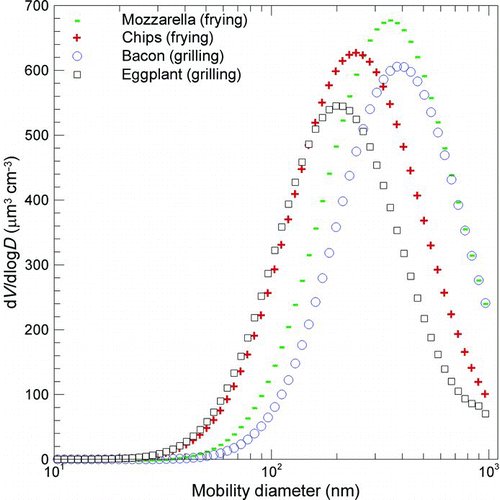
FIG. 7 Volume distributions generated by cooking fatty and vegetable foods (100 g) through frying and grilling processes in the submicrometer range. Because of the direct correlation between mass and volume distributions, where the density acts as a scaling factor, modality displayed by volume and mass distributions is the same. (Figure provided in color online.)
In relation to the particles emitted by fatty foods, the findings reported in and could be explained by the presence of a further solid core, for both cooking processes analyzed. In relation to vegetables, reductions in the total number concentration, due to conditioning the aerosol up to 300°C, are indicative of a large number of particles completely made up of volatile compounds without a carbonaceous core. The slight reduction in the total particle number concentration observed when fatty food was conditioned during frying is probably due to the amount of volatile matter emitted by the oil itself. In addition to the carbonaceous core emitted by the flame, the presence of additional carbonaceous material may be a result of the partial synthesis and degradation of fatty acids to aldehydes and ketones when cooking fatty foods (Danielli Citation1949; Byrne et al. Citation2001; Elmore et al. Citation2004).
In order to assess a useful metric for human exposure to diesel-generated particles, Giechaskiel et al. (Citation2009) proposed to separately investigate the “chemical” and “physical” health effects of the particles. The physical effect, which resulted from the particle surface area exposed to the lung, was evaluated by measuring the surface area of nonvolatile matter. In contrast, the chemical effect, which resulted from the amount of volatile mass surrounding the solid core, was evaluated by measuring the volatile mass size distribution, determined by the volume size distribution in the hypothesis of particle density equal to 1 g cm−3 and spherical shape. As there is, however, a direct correlation between mass and volume distributions, where density acts as a scaling factor, modality displayed by volume and mass distributions is the same.
presents the surface area distributions of nonvolatile matter generated by cooking fatty and vegetable foods (by frying and grilling), without thermal conditioning. Mode distributions for vegetable foods were measured at around 20 nm for both frying and grilling, whereas in the case of fatty foods, the mode was strongly influenced by the cooking process. In fact, in the case of frying, the mode for fatty foods was close to the mode for vegetable foods, because the hot oil itself could be a very intense source of condensable oil vapor, which would then end up on the particles. confirms the highest surface area peak concentrations and mode diameter for the grilling of a fatty food, such as bacon.
The comparison among the four cooking activities showed higher contributions when frying, which can be explained by the presence of the oil. Furthermore, by comparing the volatile mass distributions (correlated in a direct way to the volume distributions; ) to the nonvolatile surface area distribution (), a significant increase in vegetable food distributions was observed with respect to fatty food. This is a further evidence of the high amount of volatile matter produced by cooking vegetable foods.
CONCLUSION
The measurements of particle number distribution performed by varying the temperature of the thermal conditioning device for each cooking process showed a reduction in the mode with each increase in temperature. In particular, during frying, the mode decay was observed up to 250°C for both fatty and vegetable foods, whereas for grilling, the decay continued to be observed at temperatures over 300°C. The corresponding total number concentration trends showed differences among fatty and vegetable foods when the thermal conditioning was in operation. In particular, a significant reduction in the total number concentration was observed for vegetable foods when the thermal conditioning was in operation. In the case of particles emitted by fatty food, this behavior can be explained by the presence of a further solid core (besides the emission of the flame), which may be due to the partial synthesis and degradation of fatty acids to aldehydes and ketones.
In terms of the “chemical” and “physical” effects of aerosols on human beings, an evaluation of the nonvolatile surface area distribution and volatile mass distribution was performed for each cooking experiment conducted. An analysis of these distributions further confirmed the larger fraction of volatile compounds produced when cooking vegetable foods.
Related Research Data
REFERENCES
- Abt , E. , Suh , H. H. , Allen , G. and Koutrakis , P. 2000a . Characterization of Indoor Particle Sources: A Study Conducted in the Metropolitan Boston Area . Environ. Health Persp. , 108 : 35 – 44 .
- Abt , E. , Suh , H. H. , Catalano , P. and Koutrakis , P. 2000b . Relative Contribution of Outdoor and Indoor Particle Sources to Indoor Concentrations . Environ. Sci. Technol. , 34 : 3579 – 3587 .
- Biswas , S. , Verma , V. , Schauer , J. J. , Cassee , F. R. , Cho , A. K. and Sioutas , C. 2009 . Oxidative Potential of Semi-Volatile and Non Volatile Particulate Matter (PM) from Heavy-Duty Vehicles Retrofitted with Emission Control Technologies . Environ. Sci. Technol. , 43 : 3905 – 3912 .
- Brauer , M. , Hirtle , R. , Lang , B. and Ott , W. 2000 . Assessment of Indoor Fine Aerosol Contributions from Environmental Tobacco Smoke and Cooking with a Portable Nephelometer . J. Expo. Anal. Environ. Epidemiol. , 10 : 136 – 144 .
- Buonanno , G. , Dell’Isola , M. , Stabile , L. and Viola , A. 2009a . Uncertainty Budget of the SMPS-APS System in the Measurement of PM1, PM2.5, and PM10 . Aerosol Sci. Technol. , 43 ( 11 ) : 1130 – 1141 .
- Buonanno , G. , Morawska , L. and Stabile , L. 2009b . Particle Emission Factors During Cooking Activities . Atmos. Environ. , 43 : 3235 – 3242 .
- Byrne , D. V. , Bredie , W. L. P. , Mottram , D. S. and Martens , M . 2001 . Sensory and Chemical Investigations on the Effect of Oven Cooking on Warmed-Over Flavour Development in Chicken Meat . Meat Sci. , 61 : 127 – 139 .
- Danielli , J. F . 1949 . Aldehydes in Relation to Absorption of Fat from the Intestine and Metabolism of Fat in the Liver . Q. J. Microsc. Sci. , S3-90 : 309 – 315 .
- Dennekamp , M. , Howarth , S. , Dick , C. A. , Cherrie , J. W. , Donaldson , K. and Seaton , A. 2001 . Ultrafine Particles and Nitrogen Oxides Generated by Gas and Electric Cooking . Occup. Environ. Med. , 58 : 511 – 516 .
- Donaldson , K. , Stone , V. , Clouter , A. , Renwick , L. and MacNee , W. 2001 . Ultrafineparticles. Occup. Environ. Med. , 58 : 211 – 216 .
- Driscoll , K. E. 1996 . Role of Inflammation in the Development of Rat Lung Tumors in Response to Chronic Particulate Exposure . Inhal. Toxicol. , 8 ( S1 ) : 139 – 153 .
- Elmore , J. S. , Mottram , D. S. , Enser , M. and Wood , J. D. 2000 . The Effects of Diet and Breed on the Volatile Compounds of Cooked Lamb . Meat Sci. , 55 ( 2 ) : 149 – 159 .
- Elmore , J. S. , Warren , H. E. , Mottram , D. S. , Scollan , N. D. , Enser , M. , Richardson , R. I. and Wood , J. D. 2004 . A Comparison of the Aroma Volatiles and Fatty Acid Compositions of Grilled Beef Muscle from Aberdeen Angus and Holstein-Friesian Steers Fed Diets Based on Silage or Concentrates . Meat Sci. , 68 : 27 – 33 .
- Engler , C. , Rose , D. , Wehner , B. , Wiedensohler , A. , Bruggemann , E. , Gnauk , T. , Spindler , G. , Tuch , T. and Birmili , W. 2007 . Size Distributions of Non-Volatile Particle Residuals (Dp < 800 nm) at a Rural Site in Germany and Relation to Air Mass Origin . Atmos. Chem. Phys. , 7 : 5785 – 5802 .
- Giechaskiel , B. , Alföldy , B. and Drossinos , Y. 2009 . A Metric for Health Effects Studies of Diesel Exhaust Particles . J. Aerosol Sci. , 40 : 639 – 651 .
- Gormley , P. G. and Kennedy , M. 1949 . Diffusion from a Stream Flowing Through a Cylindrical Tube . Proc. R. Ir. Acad. , 52A : 163 – 169 .
- Hauser , R. , Godleski , J. J. , Hatch , V. and Christiani , D. C. 2001 . Ultrafine Particles in Human Lung Macrophages . Arch. Environ. Health , 56 : 150 – 156 .
- He , C. , Morawska , L. , Hitchins , J. and Gilbert , D. 2004 . Contribution from Indoor Sources to Particle Number and Mass Concentrations in Residential Houses . Atmos. Environ. , 38 : 3405 – 3415 .
- Hussein , T. , Glytsos , T. , Ondracek , J. , Dohanyosova , P. , Zdimal , V. , Hameri , K. , Lazaridis , M. , Smolik , J. and Kulmala , M. 2006 . Particle Size Characterization and Emission Rates During Indoor Activities in a House . Atmos. Environ. , 40 : 4285 – 4307 .
- International Commission on Radiological Protection . 1994 . Human Respiratory Tract Model for Radiological Protection: A Report of a Task Group of the International Commission on Radiological Protection , 1 – 482 . Oxford, UK : Elsevier Science Ltd .
- Johnson , G. R. , Ristovski , Z. D. , D’Anna , B. and Morawska , L. 2005 . Hygroscopic Behavior of Partially Volatilized Coastal Marine Aerosols Using the Volatilization and Humidification Tandem Differential Mobility Analyzer Technique . J. Geophys. Res. , 110 : D20203
- Kirchner , U. , Scheer , V. , Vogt , R. and Kagi , R. 2009 . TEM Study on Volatility and Potential Presence of Solid Cores in Nucleation Mode Particles from Diesel Powered Passenger Cars . J. Aerosol Sci. , 40 : 55 – 64 .
- Kreyling , W. G. , Semmler-Behnke , M. and Moller , W. 2006 . Health Implications of Nanoparticles . J. Nanopart. Res. , 8 : 543 – 562 .
- Kuhn , T. , Biswas , S. and Sioutas , C. 2005a . Diurnal and Seasonal Characteristics of Particle Volatility and Chemical Composition in the Vicinity of a Light-Duty Vehicle Freeway . Atmos. Environ. , 39 : 7154 – 7166 .
- Kuhn , T. , Krudysz , M. , Zhu , Y. , Fine , P. M. , Hinds , W. C. , Froines , J. and Sioutas , C. 2005b . Volatility of Indoor and Outdoor Ultrafine Particulate Matter near a Freeway . J. Aerosol Sci. , 36 : 291 – 302 .
- Li , C. S. , Lin , W. H. and Jenq , F. T. 1993 . Size Distributions of Submicrometer Aerosols from Cooking . Environ. Int. , 19 : 147 – 154 .
- Loomis , D. 2000 . Sizing Up Air Pollution Research . Epidemiology , 11 : 2 – 4 .
- Mottram , D. S. 1998 . “ Some Aspects of the Chemistry of Meat Flavour ” . In The Flavour of Meat and Meat Products , Edited by: Shahidi , F. 210 – 230 . London : Chapman and Hall .
- Ozkaynak , H. , Xue , J. , Spengler , J. , Wallace , L. , Pellizzari , E. and Jenkins , P. 1996 . Personal Exposure to Airborne Particles and Metals: Results from the Particle Team Study in Riverside, California . J. Expo. Anal. Environ. Epidemiol. , 6 : 57 – 78 .
- Pope , C. A. 2000 . What do Epidemiologic Findings Tell Us About Health Effects of Environmental Aerosols? . J. Aerosol Med. , 13 : 335 – 354 .
- Pope , C. A. and Dockery , D. W. 2006 . Health Effects of Fine Particulate Air Pollution: Lines That Connect . J. Air Waste Manage. Assoc. , 56 : 709 – 742 .
- Rönkkö , T. , Virtanen , A. , Kannosto , J. , Keskinen , J. , Lappi , M. and Pirjola , L. 2007 . Nucleation Mode Particles with a Nonvolatile Core in the Exhaust of a Heavy Duty Diesel Vehicle . Environ. Sci. Technol. , 41 ( 18 ) : 6384 – 6389 .
- Sakurai , H. , Tobias , H. J. , Park , K. , Zarling , D. , Docherty , K. S. , Kittelson , D. B. , McMurry , P. H. and Ziemann , P. J. 2003 . On-Line Measurements of Diesel Nanoparticle Composition and Volatility . Atmos. Environ. , 37 : 1199 – 1210 .
- See , S. W. and Balasubramanian , R. 2006a . Physical Characteristics of Ultrafine Particles Emitted from Different Gas Cooking Methods . Aerosol Air Qual. Res. , 6 : 82 – 92 .
- See , S. W. and Balasubramanian , R. 2006b . Risk Assessment of Exposure to Indoor Aerosols Associated with Chinese Cooking . Environ. Res. , 102 ( 2 ) : 197 – 204 .
- Wallace , L. A. , Emmerich , S. J. and Howard-Reed , C. 2004 . Source Strengths of Ultrafine and Fine Particles Due to Cooking with a Gas Stove . Environ. Sci. Technol. , 38 : 2304 – 2311 .
- Wallace , L. A. , Wang , F. , Howard-Reed , C. and Persily , A. 2008 . Contribution of Gas and Electric Stoves to Residential Ultrafine Particle Concentrations Between 2 nm and 64 nm: Size Distributions and Emission and Coagulation Rates . Environ. Sci. Technol. , 42 : 8641 – 8647 .
- Wang , C.-S. 2005 . Inhaled Particles , London : Elsevier Academic Press . Interface Science and Technology Series (Vol. 5)
- Yeung , L. L. and To , W. M. 2008 . Size Distributions of the Aerosols Emitted from Commercial Cooking Processes . Indoor Built Environ. , 17 : 220 – 229 .