Abstract
The enhancement of mortality associated with cardiovascular and specifically ischemic heart disease (IHD) has been observed in the southern California Central Valley since at least 1990, and it continues to be a major source of mortality. While there is a strong statistical association of IHD with wintertime PM2.5 mass, the causal agents are uncertain. Medical studies identify some potential causal agents, such as very fine and ultrafine metals, but they have not been fully characterized in most Central Valley regions. To provide improved information on specific and potentially causal agents, a five site aerosol sampling transect was conducted from Redding to Bakersfield during a 17-day period of strong stagnation, January 5–22, 2009. Mass and elemental components were measured every 3 h in eight particle size modes, ranging from 10 to 0.09 μm, while the ultrafine particles (<0.09 μm) were collected on Teflon filters. Ancillary studies were performed including direct upwind–downwind profiles across a heavily traveled secondary street near a stoplight. Very fine and ultrafine iron, nickel, copper, and zinc were identified as vehicular, with the most probable sources being brake drums and pads and the lubrication oil additive zinc thiophosphate. High correlations, many with r 2 > 0.9, were found between these vehicular metals and IHD mortality, enhanced by the meteorology, terrain, and traffic patterns of the southern Central Valley. The braking systems of cars and trucks must now be considered along with direct exhaust emissions in estimating the health impacts from traffic.
[Supplementary materials are available for this article. Go to the publisher's online edition of Aerosol Science and Technology to view the free supplementary files.]
INTRODUCTION
The task of determining the causal factors that lie behind the statistically sound association of mortality with aerosols continues to labor under severe difficulties. Reliance on Federal Reference Method (FRM) methodologies, even if enhanced by periodic compositional analysis, does not provide enough information to allow health research scientists to identify causal factors (Lippmann Citation2009). Intensive research studies, which can provide such data, are so expensive as to limit their scope in space and time and thus pose problems with statistical significance. An alternative is to identify regions with persistent and specific health impacts of suspected aerosol origins and then augment monitoring data and special studies to provide a suite of data from which causal factors may be identified. However, other factors such as meteorology, land use, and socioeconomic factors can often weaken the significance (Pope et al. Citation1995). The California Central Valley, however, is a region of such homogeneity that such efforts there might be fruitful.
The southern part of the California Central Valley, the San Joaquin Valley, is the largest contiguous area of the United Sates in serious violation of both ozone (summer) and PM2.5 (winter) ambient air quality standards. While the summer ozone levels are relatively uniform over the Central Valley, the winter PM10 and PM2.5 concentrations vary strongly, from low in the northern Sacramento Valley to high in the southern San Joaquin Valley. During individual winter stagnation episodes, the south to north (Bakersfield to Redding) mass ratio is up to a factor of 8 for PM10, and a factor of 5 for PM2.5.
In addition to improving monitoring data, a series of extensive research studies by and through the California Air Resources Board (ARB), such as California Regional Particulate Air Quality Study (CRPAQS 2001), Central Coast Ozone Study (CCOS), and Fresno Asthmatic Children's Environment Study (FACES), were initiated in 1999 through 2001 that greatly added to our knowledge of San Joaquin Valley aerosols. However, most field data were taken before the current understanding of aerosols and cardiovascular impacts was achieved (Devlin Citation2003, Lippmann Citation2009) and thus lack some critical measurements, especially ultrafine metals (Chow et al. Citation2006, Citation2007, Citation2008; Chen et al. Citation2007; Kleeman et al. Citation2009). One of the major results of these studies is an understanding that most of the PM2.5 mass in the winter in the San Joaquin Valley is ammonium nitrate and wood smoke, neither of which are a known cardiovascular threat.
The mortality data in the entire Central Valley are relatively uniform for three of the four major causes of mortality, pulmonary disease, stroke, and cancer, but the 4th and most important, heart attacks from all causes, is higher by about 20% in the central and extreme southern California Central Valley [California Department of Health Services (CA DHS) Citation2010] and especially in Bakersfield. For one specific and major component of heart disease, ischemic heart disease (IHD), the incidence rises to about 35% (CA DHS Citation2010). In this research, we have measured some of the components of aerosols found by recent health studies most likely to be causal factors in this statistically strong association to cardiovascular disease, namely very fine and ultrafine metals, and size and compositionally-resolved organics (Cahill Citation2010), over the entire Central Valley, with the goal to enhance data from the earlier studies and provide additional material for future epidemiological analyses.
EXPERIMENTAL METHODS
Study Region Geography and Climatology
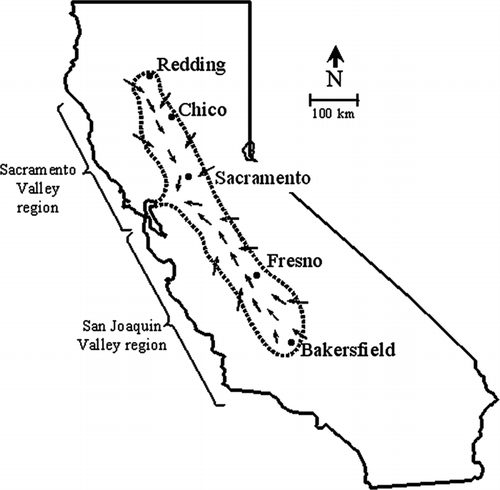
The Central Valley of California () has remarkable uniformity in terrain and meteorology. It is one of the richest agricultural areas in the world, with two major metropolitan areas, the Sacramento–Stockton and Fresno, with smaller cities of a few 100,000 to small towns spread throughout the Valley. The Valley is a major transportation corridor for road and rail traffic but generally lacks strong industrial sources. There are active areas of oil extraction near and north of Bakersfield. The Central Valley offers an ideal situation to examine the effects of pollutants on health since many potential confounding factors, such as meteorology, land use patterns, socio-economic factors, and cigarette smoking, are very similar throughout the Valley (Cahill et al. Citation1998; note that the values in that report are slightly different in the present report since we have now available CORE Report #2 (1996), while the original report used CORE Report #1 (1994)).
FIG. 1 Map of the Central Valley of California. The northern part is referred to as the Sacramento Valley while the southern part is called the San Joaquin Valley. The areas within the dotted circumference vary in altitude from almost sea level in the Delta to a few hundred feet in elevation. The small arrows denote the typical winter wind patterns (Hayes et al. Citation1984). The cities marked were used in this study.
In summer, high temperatures in the Valley (mean daily high, July, 36°C ± 1°C) lower the surface pressure and draw massive inputs of marine air into the Valley from the San Francisco Bay, bringing with it oceanic aerosols and typical urban pollutants enhanced by the major petrochemical industrial sites at the Carquinez Strait, between Sacramento and San Francisco. These winds often funnel south down the entire San Joaquin Valley, south of the strait, but less often funnel north up the entire Sacramento Valley, north of the strait. Rainfall in the Valley is rare during the period from May through October (Hayes et al. Citation1984).
In winter, the Central Valley air basin tends to become stagnant due to its flat valley floor and circumferential mountains, except at the Straits (). There is slow drainage of cold air from the Sierra Nevada Mountains each night to the Valley floor (mean daily low, January, 3°C ± 1°C). The air drains slowly, at the rate of about 50 km/day, from both the northern and southern ends of the valley towards the lowest point, the Sacramento–San Joaquin Delta, southwest of Sacramento and directly east of the Carquinez Strait. This pattern results in persistent stagnation episodes that are periodically interrupted by synoptic storms.
Typical Pollution Patterns
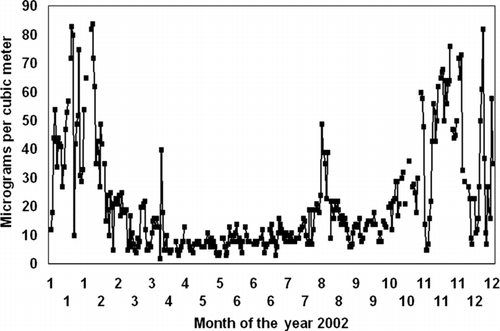
The annual pattern of PM2.5 mass reflects the effects of the winter stagnation, with elevated levels from about November through February (). All valley sites have similar annual patterns, high in winter and low in summer. The PM2.5 peak seen in August was from a forest fire in Oregon. While the southern reaches of the Central Valley have serious violations of federal and state mass standards (ADAM Citation2010), other parts of the valley that share agriculturally based land uses and meteorology do not exhibit serious violations of these standards. For PM10 mass, the ratio from Bakersfield in the south to Redding in the north can be as high as a factor of 9 in winter stagnation events, while for PM2.5, the ratio can be as high as a factor of 5 (ADAM Citation2010). The pattern of winter air movement makes the high aerosol mass levels at Bakersfield difficult to explain, since the nighttime airflow into Bakersfield is from the mountains to the south, southeast, and east of the city. There is essentially no influence from the Los Angeles basin due to the blocking mountains. The air at Bakersfield then flows slowly north towards Fresno, which has generally lower PM2.5 mass levels despite greater population and industry.
FIG. 2 Annual pattern of PM2.5 mass as seen at Fresno.
Epidemiological Data
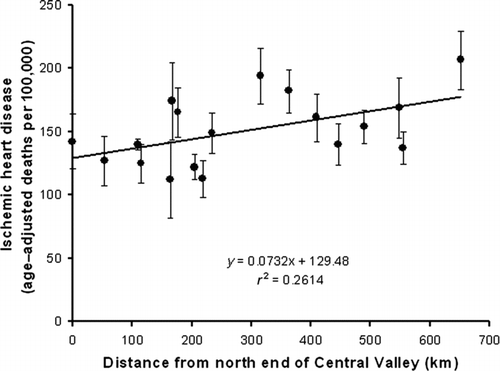
Greatly improved data on mortality and morbidity became available circa 2001 from the California Department of Health Services (CA DHS Citation2010), which allow detailed analyses of death by hundreds of cause on an annual basis. These data show a persistent enhancement, 2003–2007, of IHD mortality of roughly 50% in the central region and at Bakersfield, at the extreme southern edge of the San Joaquin Valley, as compared with the northern valley ().
FIG. 3 IHD in the Central Valley of California, 2003–2007. Distances span from Redding in the north (0 km) through Chico (170 km), Sacramento (220 km), Fresno (400 km) to Bakersfield (680 km).
Aerosol Sampling Methods
Aerosol samples were collected along a transect in the Central Valley to investigate the causal factors behind the increased mortality due to IHD in the Central Valley of California. Since routine air quality measurements were available in this region, we collected and analyzed aerosols not routinely measured by existing monitoring programs that were known or suspected to be causal factors in cardiovascular disease. Further, we selected a period of stagnation that maximizes winter particulate mass concentrations, avoiding the synoptic fronts and rain that periodically clean out the valley in winter. Using meteorological predictions, we simultaneously sampled continuously by size, time, and composition for 17 days starting on Jan 5, 2009, at five sites from the extreme north, Redding, to the extreme south, Bakersfield.
Rotating drum impactors (DELTA Group 8 DRUMs; Cahill et al. Citation1985; Raabe et al. Citation1988) were used at all sites to provide continuous samples capable of 3-h data in eight impaction size modes from 10 to 0.09 μm diameter plus an integrating Teflon after filter. The impaction samples were collected onto Apiezon-L greased Mylar stages (Wesolowski et al. Citation1977). Analyses were made for mass and elements from aluminum to molybdenum plus lead by synchrotron-induced x-ray fluorescence (Bench et al. Citation2002). The quality assurance validations, including a year-long inter-method comparison to ARB's FRM particular samplers, are summarized in the supplemental information. For the ARB side-by-side over the entire year, agreement for PM2.5 mass was better than ±10%, DRUM versus FRM, with the winter agreement much better than that, a few percent, probably because of higher winter mass values. Note that 49 individual mass values from a DRUM with 3-h time resolution and 6 sub-2.5-μm size cuts plus a <0.09 μm after-filter were required to match a single 24-h PM2.5 mass value.
Aerosols destined for organic analyses were likewise collected with DRUM samplers at the same time and locations as the elemental samplers. However, the organic samples were analyzed averaging over the entire 17-day study, and the aerosols were collected onto fired aluminum substrates (Cahill Citation2010).
The study included three components, all conducted in winter conditions and using the same equipment, including integrating ultrafine Teflon filters: (1) an initial year-long study of the DRUM sampler side-by-side with the ARB's FRM at the Sacramento test site at 13th and T Street to establish equivalency of the sampling and analysis (Cahill and Barnes Citation2009), (2) a simultaneous transect across a heavily traveled secondary street to identify very fine and ultrafine aerosols from roadways, and (3) the main transect study in winter, 2009. Summaries of these studies are included in supplemental information.
For the transect study, samples were collected at five existing ARB and district monitoring sites covering the entire Central Valley ():
-
Redding (roof of Health Department),
-
Chico (ARB Manzanita Avenue site),
-
Sacramento (ARB 13th and T Street site),
-
Fresno (ARB First Street site), and
-
Bakersfield (ARB California Street site).
Paired UC Davis DELTA Group 8 DRUM samplers were used at all sites except Sacramento, which had to use a PM 2.5 3 DRUM for lack of equipment. One 8 DRUM was used at each site for mass and elements (3-h time resolution), sampling onto lightly greased Mylar, and the other for organic matter (17-day average), sampling onto fired aluminum foils. All included identical Teflon ultrafine filters that integrated the entire 17-day period. The parameters measured at all sites include but are not limited to
| 1. | time-averaged ultrafine particulate elemental composition, Al to Mo, plus lead, and mass, 0.09 > Dp > 0.0 μm aerodynamic diameter, | ||||
| 2. | time-dependent (3 h) mass and elements (see above) for the eight particle sizes 10.0–5.0, 2.5, 1.15, 0.75, 0.56, 0.34, 0.26–0.09 μm aerodynamic diameter, | ||||
| 3. | time-averaged organic matter by size, 10.0–5.0, 2.5, 1.15, 0.75, 0.56, 0.34, 0.26–0.09 and <0.09 μm diameter, including polycyclic aromatic hydrocarbons (PAHs), sugars (including levoglucosan), fatty acids, and n-alkanes have been published (Cahill Citation2010). | ||||
RESULTS
Meteorology
After the sites were selected, deployment was delayed until weather predictions indicated at least a 10-day period of low winds and stagnation, conditions that produce the highest PM2.5 mass. The prediction was accurate and the meteorology was favorable and allowed us to extend the study to a 17-day period characterized by high mass values and persistent hazes ().
Aerosol Mass Values
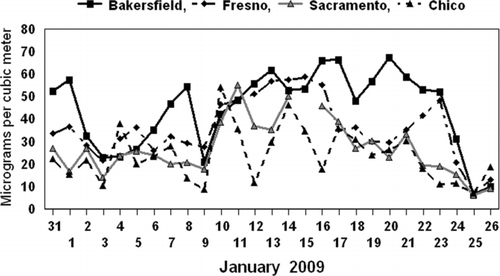
PM10 mass values were available at all sites on January 19, while all sites except Redding had daily PM2.5 mass values collected by the ARB and local agencies (ADAM Citation2010). The PM2.5 values were averaged over the entire 17-day study period and were typical of prior winter stagnation events ( and ). Looking in more detail, we can see that the north to south increase in average PM2.5 mass is driven not as much by the increase in mass on a given day but the number of days that saw the high mass values.
TABLE 1 Summary of meteorological parameters during sample collection period of January 5–22, 2009. The values reported are the average over the entire aerosol sampling period except for rainfall, which includes the rain on the days of setup and take down, January 5 and 22
FIG. 4 PM2.5 mass values were available every day, but only January 19th had PM10 mass at all valley sites. The high PM10 to PM2.5 ratio on January 19 is unusual and unexplained.
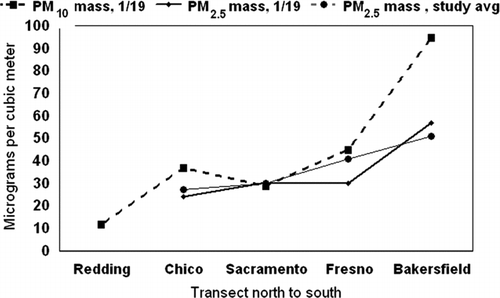
FIG. 5 PM2.5 mass values before, during, and after the study period of January 5–22, 2009.
Aerosol monitoring by state and local agencies with compositional data for PM2.5 aerosols was only available at the Fresno site via the IMPROVE sampler (Malm et al. Citation1994). The evolution of the aerosol event is shown in , showing that the study period would represent a winter day in violation of the PM2.5 mass standard. The important role ammonium nitrate plays during these aerosol episodes is clearly indicated.
Size-Resolved Mass and Inorganic Aerosols
For the period from January 5 through 22, over 6400 measurements were made of mass and inorganic elements in nine size modes, measured every 3 h except for the integrating ultrafine filters. In addition, a simultaneous study (Cahill Citation2010) measured organic aerosols in four classes (alkanes, PAHs, sugars, and organic acids) in nine size modes at all sites. In this article, we focus on those particles that have the best support from the health literature as having the potential for causing or exacerbating IHD. Thus, we focus on only those insoluble particles in the very fine (0.26–0.09 μm) and ultrafine (<0.09 μm) modes that are able to penetrate deeply into the lung and pass into the cardiovascular system. However, before we focus on these particles, we need to examine the overall aerosol behavior important to eventually isolate the sources of these particles.
TABLE 2 Mass values for PM10 on January 19 and PM2.5 averaged from January 5 though January 22, 2009. The value of ∼9 for PM2.5 is estimated assuming the same PM10/PM2.5 ratio as the other cities
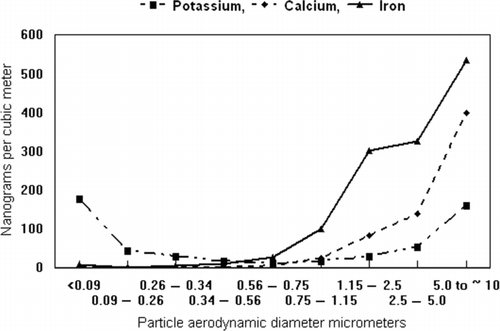
Using the well-studied Fresno site, we can see that the size distribution roughly matches expectations with a few differences (). In , three points stand out. First, the DRUM sampler with its coated substrates operated well, with negligible soil mass penetrating into the accumulation mode as shown by the calcium results. Second, there is a distinct deviation in the size profile of iron, which shows an enhancement in the 1.15–2.5 μm size mode not seen in other soil elements. Third, potassium becomes enhanced in the finest modes, clearly from non-soil sources. It is also much finer in size than typical wood smoke, which almost always peaks in the 0.34–0.75 μm mode.
Examining the non-soil iron anomaly (), the size and 3-h time data show enhancement in the 2.5–1.15 μm mode each night not seen in other soil elements and not seen at any other valley site. The very fine iron often tracks the fine iron, but sharp deviations occur, indicating complex source behavior. Bakersfield lacks time information due to a system failure, and thus its behavior in time is unknown.
Further insight on zinc in Fresno can be obtained by examining zinc over most of a year (Cahill et al. Citation2003). The persistent presence of very fine zinc occurs throughout the entire year and becomes dominant in wintertime, closely associated with other vehicular aerosols. The zinc to very fine mass ratio was close to that seen in laboratory diesel tests (Zielinska et al. Citation2003).
Data on Very Fine and Ultrafine Aerosols
Very fine aerosols were collected on DRUM stage 8, 0.26 to 0.09 μm, and integrated over the 17-day study period to match the integrating ultrafine filters. Ultrafine aerosols were collected on the same 47-mm Teflon filters as the organic samples and averaged over the same 17-day period. The filters were analyzed by scans of S-XRF every 0.5 mm across the filter diameter. All filters were uniform except for Chico, which had contamination on one edge. This was easily avoided by modifying the averaging program. Two different averages were generated: one by summing the spectra, then analyzing and the other by averaging the typical eighteen individual elemental results.
FIG. 6 IMPROVE and ARB PM2.5 data at the Fresno site during the study. Note the dominance of ammonium nitrate in the mass maxima.
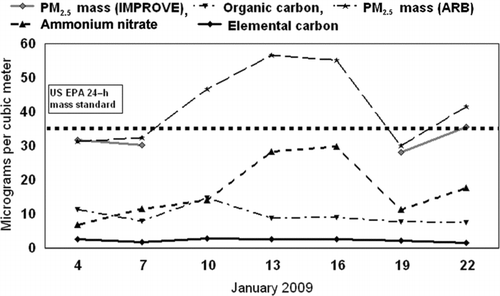
FIG. 7 Size distribution for Fresno aerosols.
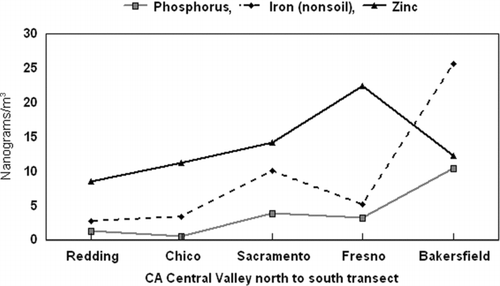
In , we show a summary time averaged DRUM very fine data and, in , the integrated ultrafine filter data for the study period.
The values in bold represent vehicular sources identified in the next section of this article. The copper ultrafine values are suspect from contamination by copper containing filter holders. Knon is non-soil potassium, corrected by the Calcium content, and a standard IMPROVE tracer of wood smoke (Malm et al. Citation1994). MDL is minimum detectable limit. Uncertainties are nominally ±5%, and detailed quality assurance and uncertainties are in the supplemental information.
The correlations of sulfur (ammonium sulfate) and selenium are driven by the oil extraction and refining near Bakersfield (). But there are strong associations between many metals and IHD in both the very fine and ultrafine modes. Although mass levels in the very fine and ultrafine modes are low, the concentration of metals was significant. Thus metals are a major contributor to particle numbers, many presumably in insoluble compounds. Examining spatial trends for very fine metals with known vehicular origins, we see at Bakersfield a clear north to south enhancement of many very fine metals that far exceeds the ×1.6 increase in PM2.5 mass for the same period ().
FIG. 8 Fine and very fine nonsoil iron at Fresno. Recall that the study began directly after a rainfall event and had almost no winds to stir up dust. Thus we propose that most of the iron is roadway and vehicle derived.
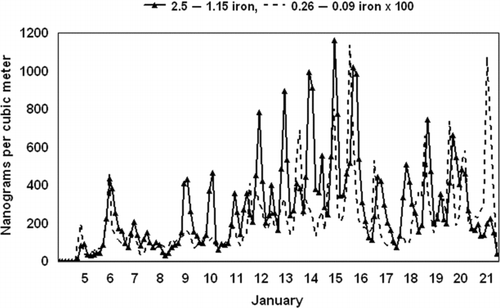
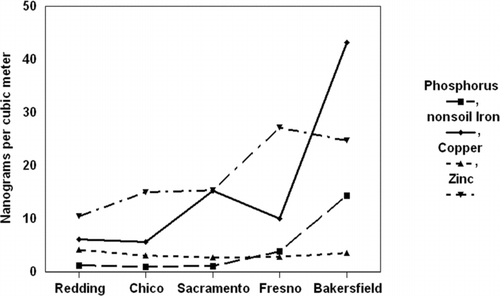
FIG. 9 Very fine transition metals with known vehicular sources, zinc and phosphorus from zinc thiophosphate in lubricating oil, iron, copper, and zinc potentially from braking systems.
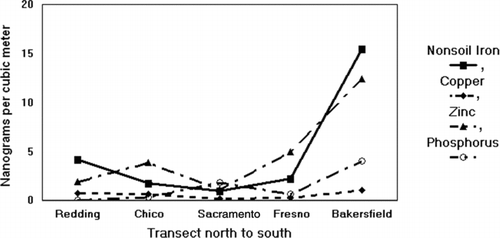
The upward trend of sulfur must be interpreted in accord with the meteorology, which moves air from Bakersfield towards the Delta. Typical elements associated with vehicles include non-soil iron, phosphorus, zinc, nickel, and copper. From the ratio present in the zinc thiophosphate in lubricating oil, there are clearly additional zinc sources present at all sites except perhaps Bakersfield.
In summary, there are significant contributions of metals in the very fine and ultrafine mode, many of which rise to their highest levels at Bakersfield (Figures and ) and correlate strongly with the IHD mortality data.
TABLE 3 Aerosol mass data from the study and their correlation to IHD mortality. Uncertainties are nominally ±5%, and detailed quality assurance and uncertainties are in the supporting materials. Concentration (ng/m3) of very fine (0.09 to 0.26 μm) aerosols
TABLE 4 Concentration (ng/m3) of ultrafine (<0.09 μm) aerosols
FIG. 10 Ultrafine potassium and sulfur.
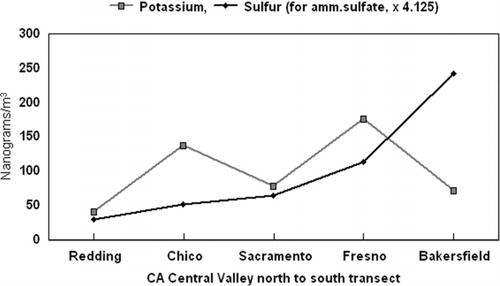
FIG. 11 Typical vehicular ultrafine metals.
DISCUSSION
Sources of the Metals
The generation of metals in the ultrafine mode requires high temperatures and/or pressures. Thus, many sources of metals from vehicles, such as zinc from tire wear, are not candidates for sources of ultrafine aerosols. Two potential sources are engines, and especially diesel engines because of the high temperatures and pressures involved, and the braking systems in vehicles.
While there is considerable information on the total particulate emissions from vehicles, the information on ultrafine metals from vehicular exhaust is limited (Kleeman et al. Citation2000; Zielinska et al. Citation2003, 2004). The Zielinska et al.'s (Citation2003) study involved detailed analysis of diesel exhaust. As part of the study, we analyzed for 32 elements collected in 11 tests with a 14-stage nano-MOUDI (lowest stage 0.01 μm). Sulfur, phosphorus and the metals zinc, calcium, and, in one of the 11 tests, lead, all peaked generally in the 0.10–0.056 μm modes (Zielinska et al. 2003). In addition to elemental and organic carbon, the tracer elements were assigned to sources: sulfur was from the fuel (CA low sulfur), the zinc and phosphorus from the zinc thiophosphate stabilizer in the lubricating oil, and calcium from an antacid additive. No other transition metals were seen in statistically significant amounts.
A second potential source of very fine and ultrafine metals is the braking systems of cars and trucks, since high temperatures and/or pressures are involved in this process. The brake drums have evolved from the massive, heat-conductive structures and generally well cooled in the past and now are often made of “grey iron,” roughly 90% iron with the admixture of a few percent carbon, plus copper, silicon, and other metals in smaller amounts, making them like brake pads an erodible surface. Brake pads are far more complex in composition and are traditionally designed to erode.
Limited information is available on a complete inventory of vehicular expendables. An early one was developed as a part of the extensive California freeway lead and particulate studies in the 1970s. In Cahill and Feeney (Citation1973), the UC Davis vehicle fleet was studied for all forms of expendables, including fuel, oil, brake wear, exhaust train erosion, tires, etc., by directly measuring mass loss at replacement intervals. While many of the results are uncertain due to technological changes in the fuels and engines, measurements of brake drums and brake pads gave ∼5 and 108 gm, respectively, at a replacement cycle of 58,400 km, or <1 and 15 mg/km. However, these data were based on asbestos-containing brake pads and may not be reliable, which also impacts the US Environmental Protection Agency (EPA) PART5 model estimate of 20.6 mg/km, based on 1985 data. In terms of brake drums, changes in brake drums from iron to “grey iron” containing graphite could materially increase that source of particles from prior values. Even with the uncertainties, it is clear that brakes contribute a significant component of typical vehicle total emission rates. However, averages are misleading because braking is only used for limited times. Thus the emission rates at stoplights and especially extensive mountain down grades will be much higher than these values. It is worth noting that traditional dynamometer studies and roadside side studies near freeways are likely to miss brake wear as an emission source, thus these emissions may be largely unrecognized by the majority of vehicle emission and assessment studies.
FIG. 12 Additional ultrafine elements.
Information on brake pad composition was reviewed by Kennedy et al. (Citation2002) and Chan and Stachowiak (Citation2004). The latter report, “A multitude of different brake pads have sprung onto the market in the post-asbestos brake pad revolution, each with their own unique composition,” often proprietary. Brake pads comprise four subcomponents: (1) frictional additives, abrasives, and lubricants; (2) fillers; (3) a binder; and (4) reinforcing fibers for strength. The brake pads are described as metallic, semimetallic, with organic components, and organic. Asbestos to be used mainly as a reinforcing fiber in brake pads, and after its removal, a variety of materials have been used, including iron fibers. Some of them include potentially hazardous materials potassium titanate and sepiolite, a magnesium-silicon compound, both of which have potential health hazards. Organic aramaid fibers (e.g., Kelvar) and ceramics such as alumina and carbides are becoming more popular as prices decline. Fillers include a wide variety of organic (cashew hulls, old tires) and inorganic materials (barium sulfate is popular). The frictional components include graphite and metal sulfides including copper, antimony, tin, zirconium, and lead. Copper in particular has been identified as a problem in aquatic systems, and legislation to remove it from brake pads has been passed in the states of Washington and California.
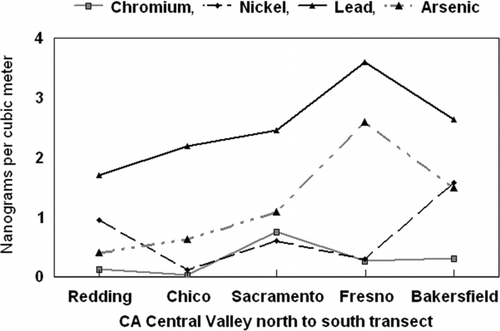
While there is enormous variability in the data, as shown by the percentile distributions, the four main elements are iron, copper, zinc, and nickel (). In summary, there is a wide variety of very fine and ultrafine metals that may arise from brake drums and pads, but iron and copper are clearly two major components.
Information on ambient and near source very fine and ultrafine metals was derived from two additional studies in Sacramento. The first was a complete analysis of ultrafine (<0.09 μm) aerosols over a 2-week period, November–December, 2007, as part of an 8-month DRUM to FRM intercomparison with the California ARB in central Sacramento at the 13th and T Street ARB site (Cahill and Barnes Citation2009, supplementary materials), and the second was a 2007 study directly measuring aerosols across a heavily traveled (65,000 v/day, 1.5% diesels) secondary street in Sacramento, Watt Avenue (Cahill et al. Citation2007, supplementary materials).
One period in the Sacramento ARB intercomparison in November and December was chosen for mass closure through addition of surrogate organic measurements (Cahill et al. Citation1989; Malm et al. Citation1994). As anticipated, most of the ultrafine mass is organic (). Note also that the only nondetermined major species, nitrate, could not have been a major factor in Sacramento or the agreement would not have been as robust. Farther south in the San Joaquin Valley, nitrates are always a major factor. The presence of the fine transition metals in these quantities represents a very large number of particles. Note that the zinc value seen in Sacramento in 2007, 11.5 ng/m3, is similar to the transect zinc value in 2009, 14 ng/m3.
TABLE 5 Summary of concentrations of elements in New Zealand brake pads, from largest to smallest concentrations of transition metals plus heavier elements. The distributions are shown to emphasize with wide variability between manufacturers
TABLE 6 Measured and reconstructed ultrafine mass and elemental components in two studies in Sacramento, 2007. Watt 0.5 km is 500 m upwind; Watt 15 m is downwind. Sac Center is the ARB 13th and T Street site. There are no elemental carbon data or nitrate data, so the reconstructed mass is incomplete
The second study was performed at Watt Avenue, the site of several studies on the impact of Watt Avenue on Arden Middle School (Cahill et al. Citation2007, supplementary materials). The Watt Avenue study utilized the same sampler as the ARB study, with two identical eight stage DRUM samplers with greased Mylar substrates and a 47-mm stretched Teflon after filter for the <0.09 μm ultrafine mode. The school sampler was 15 m downwind from the nearest traffic lane on the roof of the one story building and 50 m south of a stoplight on Arden Way that backed traffic up to and south of the Arden Middle School site. Thus considerable braking occurred directly upwind of the Arden Middle School sampler. The far upwind sampler was 500 m away in a residential neighborhood. Samples were collected continuously over 8 weeks in February and March, 2007. The results of these studies are shown in .
Through the direct upwind downwind measurements across Watt Avenue, the source of the metals seen in downtown Sacramento can also be shown to be largely derived from traffic sources despite the fact that the nearest freeway to the 13th and T Street site is over 1 km away.
Almost identical values of the same four elements are seen in Sacramento and especially in Bakersfield ( and ).
TABLE 7 Very fine and ultrafine metals with known vehicular sources
FIG. 13 Very fine plus ultrafine aerosols with known vehicular sources.
Since the ultrafine four elements, non-soil iron, nickel, copper, and zinc, and a few others, are traffic related, we can examine the mass levels in the Central Valley to see how the levels correspond to traffic. Since the wind flows downslope across Bakersfield from the south, where I-5 descends from the Grapevine and Hwy 58 descends from Tehachapi Pass, we used the sum of the cars plus 10 times the trucks, to roughly match to emission rates, and compared the ratio of traffic to PM2.5 at the ends of the Valley and across the Chico and Fresno lateral transects for I-5 plus Hwy. 99. For the valley ends, the traffic ratio was 4.6 and the aerosol ratio 4.4, while for the central lateral transect, traffic was 2.1 and the aerosol was 1.4. Therefore the PM2.5 mass values in the study were similar to the local traffic volumes, and the ultrafine metals at Bakersfield are from the two major highways south of Bakersfield climbing and descending the mountain passes.
Support for this hypothesis comes from historical data taken in Bakersfield in winter, 1974–1976 (Cahill and Flocchini Citation1974; Flocchini et al. Citation1976). The historical data show that particulate pollution from cars was high in Bakersfield in the 1970s data. Lead levels at Bakersfield, population circa 75,000 in 1975, in the average winter period were higher on average than in parts of the Los Angeles urban area. This is a clear indication that the local meteorology and geographical setting of Bakersfield results in it being highly impacted by vehicular sources, most likely vehicles on I-5 and Hwy 58 as they climb out of or descend into the valley.
Examining the current IHD mortality data from , we observed that if we remove a totally arbitrary average background IHD mortality rate of 120 from the total rate (about 2/3 of the valley average rate), and matching the Bakersfield result, the excess IHD mortality roughly scales with local truck traffic on the major freeways (CalTrans Citation2010) and the very fine–ultrafine iron ().
FIG. 14 Association between local average annual daily truck (AADT) traffic on major freeways, scaled ischemic heart disease, and very fine plus ultrafine iron.
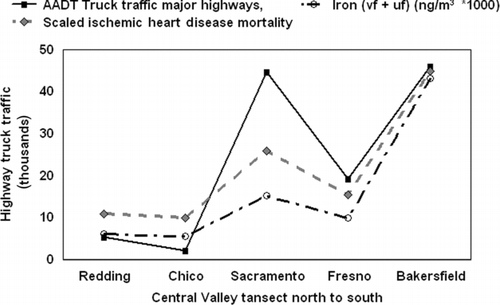
The pattern reflects the pattern that the two major north–south freeways, I-5 and Hwy 99, come close to each other only at Sacramento–Stockton and Bakersfield. Note that car traffic has a very different pattern because of the large automobile traffic on local Sacramento highways. When ultrafine aerosols alone are correlated with IHD mortality for the entire Central Valley, the highest correlations are for phosphorus (r 2 = 0.96) and iron (r 2 = 0.88), both with known vehicular sources.
The association of IHD with toxic organic contaminants, specifically benzo[a]pyrene (BaP) and coronene (Cahill Citation2010), was examined but the pattern did not produce a fit to the IHD increase (). The relatively high values of BaP at Chico in winter, observed for years in prior CARB toxics data reported in the ADAM database (ARB ADAM Citation2010), was traced to the burning of primarily pine wood.
FIG. 15 Comparison of ultrafine BaP, potassium, and coronene.
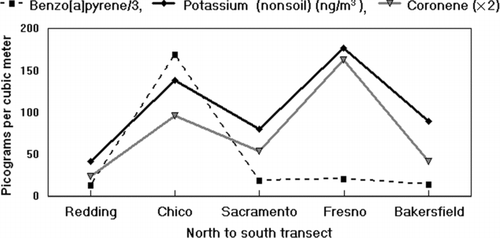
Coronene is normally associated with the exhaust of automobiles, while BaP has known vehicular sources (diesels and cars) as well as wood smoke (Fujita et al. Citation2007; Riddle et al. Citation2007; Kleeman et al. Citation2009; Cahill Citation2010). The non-soil, nonwood smoke potassium was also observed by Gertler et al. (Citation2003) in the Tuscarora Tunnel studies from light duty vehicles, but not from diesels. Thus, there appears to be a spark emission source of potassium and coronene in the very fine/ultrafine. A south valley enhancement was also seen in petroleum derived alkanes (Cahill Citation2010), which were present in the largest amounts in Fresno, lesser amounts in Bakersfield, and negligible elsewhere. In summary, it does not appear that organic aerosols from wood smoke, diesels, and automobiles are a component in the IHD excess.
CONCLUSIONS
Persistent enhancement of mortality associated with cardiovascular and specifically IHD has been observed in the southern San Joaquin Valley since 1990, yet while there is a strong statistical association with mass, most of the mass is known to be relatively innocuous to the cardiovascular system. Most of the mass is ammonium nitrate, which is soluble in lung fluid. This makes ammonium nitrate unlikely as a source of cardiovascular disease. In order to examine potential causal agents, a profile was made of mass, inorganic, and organic components of mass in nine size modes, including ultrafines <0.09 μm, at five sites from Redding to Bakersfield during a 3-week period of strong stagnation, January 5–22, 2009. The strongest correaltions to IHD mortality were found in very fine (0.26–0.09 μm) to ultrafine metals, with most tied to vehicular sources. This result is supported by several independent lines of reasoning. First, there is an association with truck traffic and IHD throughout the Valley. Second, the four key transition elements, non-soil iron, nickel, copper, and zinc, are closely tied to vehicular sources through upwind–downwind measurements at Watt Avenue, a secondary artery in suburban Sacramento. Third, the same four elements are found at the downtown ARB 13th and T Street site. Fourth, there are known diesel sources of zinc and phosphorus, from zinc thiophosphate in lubricating oil, plus calcium as an antacid. No iron, nickel, or copper were seen in the diesel dynamometer tests, so these elements are not coming from engine wear. Conversely, brake pads include many elements, including iron, nickel, copper, and zinc. The Watt Avenue data were taken just south of a stoplight, so braking was occurring. Heavy braking also occurs on the I-5 “Grapevine” and Highway 58 downgrades, each more than a 1000 m descent, and both carry heavy truck traffic into Bakersfield, where the same elements are seen again correlating with increased rates of IHD.
Thus, in summary, we present here evidence that, while not conclusive, strongly supports the hypothesis that very fine and ultrafine transition metals are a causal factor in IHD in the Central Valley of California. Removal of zinc thiophosphate from lubricating oil could greatly reduce the zinc concentration, while changes in brake drums and pads could reduce the non-soil iron, copper, zinc, and nickel concentrations in ambient air. After a 15-year fight that surfaced with concerns about the San Francisco Bay, on October 5, 2010, Governor Arnold Schwarzenegger signed SB346, which requires brake pad manufacturers to reduce the use of copper to not more than 5% by 2021 and no more than 0.5% by 2025. The reasons were based on the toxicity of copper in water run-off from roads and follows similar action by Washington State.
Finally, it is clear that the lack of correlation between PM2.5 (or PM1.0) composition and very fine and ultrafine aerosol composition makes measurements of the composition of very fine and ultrafine particles critical for obtaining causal relations to health impacts, both for organic and inorganic species.
uast_a_582194_sup_18759210.zip
Download Zip (263.1 KB)Acknowledgments
The authors first wish to gratefully acknowledge the support of the Resources Legacy Fund of Sacramento, California, for encouragement and financial support for this study.
The staff of all of the Air Resources Board (ARB) sampling sites were key to successful execution of the project.
The authors also wish to gratefully acknowledge the financial support of the Sacramento Metropolitan Air Quality Management District under its CEO, Larry Greene.
The authors wish to acknowledge the input and oversight of the Health Effects Task Force (HETF) of Breathe California of Sacramento-Emigrant under Jananne Sharpless, Chair; Betty Turner, consultant to the HETF, and especially members Ralph Propper and Earl Withycombe. Helpful suggestions and review were provided by William Wilson, US Environmental Protection Agency (EPA).
Related Research Data
REFERENCES
- ADAM . 2010 . California Environmental Protection Agency—Air Resources Board . Retrieved from http://www.arb.ca.gov/ADAM
- Bench , G. , Grant , P. , Ueda , D. , Cliff , S. , Perry , K. and Cahill , T. A. 2002 . The Use of STIM and PESA to Measure Profiles of Aerosol Mass and Hydrogen Content, Respectively, Across Mylar Rotating Drums Impactor Samples . Aerosol Sci. Technol. , 36 : 642 – 651 .
- California Department of Health Services . 2010 . Web Based Inquiry for Mortality Data . Retrieved from http://www.applications.dhs.ca.gov/vsq/default.asp accessed 3 May, 2011.
- CalTrans . 2010 . CA Transportation Authority, Average Daily Truck Traffic on the California Highway System . Retrieved from http://www.dot.ca.gov/hq/traffops/saferesr/trafdata/truck2008final.pdf
- Cahill , T. , Cliff , S. S. , Jimenez-Cruz , M. and Perry , K. 2003 . “ Aerosols by Size, Time, and Composition in Support of the Fresno Asthmatic Children's Environment Study, 2001Final Report to the California Air Resources Board ” . Sacramento, CA
- Cahill , T. , Dutcher , D. , Clark , C. , Martin , J. , McCarthy , T. and Lipnick , D. “ Comparison of Cardiac and Stroke Mortality to Carbon Monoxide, Ozone, and Particulate Air Pollutant Concentrations in the Sacramento Valley RegionReport to the Health Effects Task Force, American Lung Association Sacramento Emigrant Trails ” . Sacramento, CA
- Cahill , T. A. and Barnes , D. E. 2009 . “ Comparison of Fine Mass, UC Davis DRUM versus FRM, at the Air Resources Board 13th and T Street SiteFinal Report to the California ARB ” . Sacramento, CA
- Cahill , T. A. , Cahill , T. M. , Spada , N. J. and Barnes , D. E. 2007 . “ Organic and Elemental Aerosols near Watt Avenue, Late Winter—Spring, 2007Final Report to the Sacramento Metropolitan Air Quality Management District ” . Sacramento, CA
- Cahill , T. A. , Eldred , R. A. , Motallebi , N. and Malm , W. C. 1989 . Indirect Measurement of Hydrocarbon Aerosols Across the United States by Nonsulfate Hydrogen-Remaining Gravimetric Mass Correlations . Aerosol Sci. Technol. , 10 : 421 – 429 .
- Cahill , T. A. and Feeney , P. J. 1973 . “ Contribution of Freeway Traffic to Airborne Particulate MatterFinal Report of the California Air Resources Board, Contract ARB-502 ” . Sacramento, CA
- Cahill , T. A. and Flocchini , R. G. 1974 . “ Regional Monitoring of Smog AerosolsAnnual Reports to the California Air Resources Board ” . Sacramento, CA Contract 2–006, 1974, 1975, 1976, 1977
- Cahill , T. A. , Goodart , C. , Nelson , J. W. , Eldred , R. A. , Nasstrom , J. S. and Feeney , P. J. 1985 . “ Design and Evaluation of the Drum Impactor ” . In Proceedings of International Symposium on Particulate and Multi-phase Processes , Edited by: Ariman , T. and Nejat Veziroglu , T. 319 – 325 . Washington, DC : Hemisphere Publishing Corporation . Vol. 2
- Cahill , T. M. 2010 . Size-Resolved Organic Speciation of Wintertime Aerosols in the California Central Valley . . Environ. Sci. Technol. , 44 : 2315 – 2321 .
- Chan , D. and Stachowiak , G. W. 2004 . Review of Automotive Brake Friction Materials . Proc. Instn. Mech. Engrs. , 218 ( 9 ) : 953 – 966 .
- Chen , L. W. A. , Watson , J. G. , Chow , J. C. and Magliano , K. L. 2007 . Quantifying PM2.5 Source Contributions for the San Joaquin Valley with Multivariate Receptor Models . Environ. Sci. Technol. , 41 ( 8 ) : 2818 – 2826 .
- Chow , J. C. , Chen , L. W. A. , Watson , J. G. , Lowenthal , D. H. , Magliano , K. A. , Turkiewicz , K. and Lehrman , D. E. 2006 . PM2.5 Chemical Composition and Spatiotemporal Variability During the California Regional PM10/PM2.5 Air Quality Study (CRPAQS) . J. Geophys. Res.—Atmos. , 111 : D10
- Chow , J. C. , Watson , J. G. , Lowenthal , D. H. , Chen , L. W. A. , Zielinska , B. , Mazzoleni , L. R. and Magliano , K. L. 2007 . Evaluation of Organic Markers for Chemical Mass Balance Source Apportionment at the Fresno Supersite . Atmos. Chem. Phys. , 7 ( 7 ) : 1741 – 1754 .
- Chow , J. C. , Watson , J. G. , Lowenthal , D. H. and Magliano , K. L. 2008 . Size-Resolved Aerosol Chemical Concentrations at Rural and Urban Sites in Central California, USA . Atmos. Res. , 90 ( 2–4 ) : 243 – 252 .
- Devlin , R. What We Know and What We Think We Know About Health Effects of Fine Particles; Is It Enough? . American Association of Aerosol Research (AAAR), Annual Meeting . Charlotte, NC.
- Flocchini , R. G. , Cahill , T. A. , Shadoan , D. J. , Lange , S. J. , Eldred , R. A. , Feeney , P. J. , Wolfe , G. W. , Simeroth , D. C. and Suder , J. K. 1976 . Monitoring California's Aerosols by Size and Elemental Composition . Environ. Sci. Technol. , 10 : 76 – 82 .
- Fujita , E. M. , Zielinska , B. , Campbell , D. E. , Arnott , W. P. , Sagebiel , J. C. , Mazzoleni , L. , Chow , J. C. , Gabele , P. A. , Crews , W. , Snow , R. , Clark , N. N. , Wayne , W. S. and Lawson , D. R. 2007 . Variations in Speciated Emissions from Spark-Ignition and Compression-Ignition Motor Vehicles in California's South Coast Air Basin . J. Air Waste Manage. , 57 ( 6 ) : 705 – 720 .
- Gertler , A. , Abu-Allaban , M. , Coulombe , W. , Gillies , J. A. , Pierson , W. R. , Rogers , C. F. , Sagebiel , J. C. , Tarnay , L. and Cahill , T. A. 2003 . Measurements of Mobile Source Particulate Emissions in a Highway Tunnel . Int. J. Vehicle Des. , 27 : 86 – 93 .
- Hayes , T. P. , Kinney , J. J. R. and Wheeler , N. J. M. 1984 . California Surface Wind Climetology State of California Air Resources BoardAerometric Data Division, Sacramento, California .
- Kennedy , P. , Gadd , J. and Moncrieff , I. 2002 . Emission Factors for Contaminants Released by Motor Vehicles in New ZealandMinistry of Transport, Auckland, New Zealand .
- Kleeman , M. J. , Riddle , S. G. , Robert , M. A. , Jakober , C. A. , Fine , P. M. , Hays , M. D. , Schauer , J. J. and Hannigan , M. P. 2009 . Source Apportionment of Fine (PM1.8) and Ultrafine (PM0.1) Airborne Particulate Matter During a Severe Winter Pollution Episode . Environ. Sci. Technol. , 43 ( 2 ) : 272 – 279 .
- Kleeman , M. J. , Schauer , J. J. and Cass , G. R. 2000 . Size and Composition Distribution of Fine Particulate Matter Emitted from Motor Vehicles . Environ. Sci. Technol. , 34 ( 7 ) : 1132 – 1142 .
- Lippmann , M. 2009 . Semi-Continuous Speciation Analyses for Ambient Air Particulate Matter: An Urgent Need for Health Effects Studies . J. Expo. Sci. Epidemiol. , 19 : 235 – 247 .
- Malm , W. C. , Sisler , J. F. , Huffman , D. , Eldred , R. A. and Cahill , T. A. 1994 . Spatial and Seasonal Trends in Particle Concentration and Optical Extinction in the United States . J. Geophys. Res. , 99 ( D1 ) : 1347 – 1370 .
- Pope , C. A. III , Thun , M. , Namboodiri , M. M. , Dockery , D. W. , Evans , J. S. , Speizer , F. E. and Heath , C. W. Jr. 1995 . Particulate Air Pollution as a Predictor of Mortality in a Prospective Study of U. S. Adults . Am. J. Respir. Crit. Care Med. , 151 ( 3 ) : 669 – 674 . (Part 1)
- Raabe , O. G. , Braaten , D. A. , Axelbaum , R. L. , Teague , S. V. and Cahill , T. A. 1988 . Calibration Studies of the Drum Impactor . J. Aerosol Sci. , 19 ( 2 ) : 183 – 195 .
- Riddle , S. G. , Jakober , C. A. , Robert , M. A. , Cahill , T. M. , Charles , M. J. and Kleeman , M. J. 2007 . Large PAHs Detected in Fine Particulate Matter Emitted from Light-Duty Gasoline Vehicles . Atmos. Environ. , 41 ( 38 ) : 8658 – 8668 .
- Wesolowski , J. J. , John , W. , Devor , W. , Cahill , T. A. , Feeney , P. J. , Wolfe , G. and Flocchini , R. 1977 . Collection Surfaces of Cascade Impactors, in X-Ray Fluorescence Analysis of Environmental Samples , Edited by: Dzubay , T. 121 – 130 . Ann Arbor Science Publishers, Ann Arbor, Michigan .
- Zielinska , B. , Goliff , W. , McDaniel , M. , Cahill , T. , Kittelson , D. and Watts , W. 2003 . Chemical Analyses of Collected Diesel Particulate Matter Samples in the E-43 ProjectNational Renewable Energy Laboratory, Golden, COLORADO. .
- Zielinska , B. , Sagebiel , J. , McDonald , J. D. , Whitney , K. and Lawson , D. R. 2004 . Emission Rates and Comparative Chemical Composition from Selected in-use Diesel and Gasoline Fueled Vehicles . J. Air Waste Manage. Assoc. , 54 : 1138 – 1150 .