Abstract
A quantitative understanding of the absorption and scattering properties of mixed soot and aerosol particles is necessary for evaluating the Earth's energy balance. Uncertainty in the net radiative forcing of atmospheric aerosols is relatively large and may be limited by oversimplified models that fail to predict these properties for bare and externally mixed soot particles. In this laboratory study of flame-generated soot, we combine photoacoustic spectroscopy, particle counting techniques, and differential mobility analysis to obtain high-precision measurements of the size-dependent absorption cross section of uncoated and coated soot particles. We investigate how the coating of soot by nonabsorbing films of dibutyl phthalate (chosen as a surrogate for sulfuric acid) affects the particles’ morphology and optical properties. Absorption measurements were made with photoacoustic spectroscopy using a laser at λ = 405 nm. We report measurements and model calculations of the absolute cross section, mass absorption coefficient, and amplification of the absorption cross section. The results are interpreted and modeled in terms of a core–shell geometry and Lorenz–Mie theory of scattering and absorption. We discuss evidence of soot particle and collapse as a result of the coating process and we demonstrate the ability to resolve changes in the coating thickness as small as 2 nm.
INTRODUCTION
Soot is the principal light-absorbing atmospheric aerosol (CitationJacobson 2001). Sometimes referred to as black carbon, soot is composed of graphitic carbon, as well as other organic compounds. Since soot is not uniquely defined in terms of chemical composition, size or morphology, it is difficult to accurately assess its role in atmospheric chemistry and global warming. While the exact impact of soot on radiative transfer in the atmosphere is still under investigation, it is well established that all forms of soot absorb incoming solar radiation. This light–matter interaction contributes to warming of the atmosphere (Intergovernmental Panel on Climate Change [IPCC] 2009) and its magnitude is typically quantified in terms of a positive radiative forcing expressed as a radiant power per unit area. The radiative forcing is directly related to the spectral dependence of the absorption and scattering cross sections of the soot particles (optical properties). However, the exact contribution of soot to the overall energy balance in the atmosphere is an unresolved question that motivates this study. The IPCC reports a relatively large uncertainty in the radiative forcing of soot and other light-absorbing particles (IPCC 2009). The positive radiative forcing of light-absorbing atmospheric aerosols is masked by the negative radiative forcing of most other particles present in the atmosphere. The warming effect (positive radiative forcing) is effectively unique to soot, which makes it important as a greenhouse species. With a radiative forcing ranging from 0.5 W m-2 to 0.9 W m-2, soot is one of the largest contributors to atmospheric warming (CitationSchmid et al. 2004; CitationRamanathan and Carmichael 2008).
It is understood that soot ages when released into the atmosphere (CitationDickerson et al. 2002; CitationNet et al. 2009). This process usually involves the oxidation of the particles and eventual coating by chemicals found in the atmosphere. One of the most common coatings found on soot is sulfuric acid (CitationHallett et al. 1989; CitationSchumann et al. 1996; Saathoff, Naumann, et al. 2003), which while weakly absorbing in the visible, may influence the effective absorption efficiency of soot (CitationChylek et al. 1995; CitationJacobson 2000, Citation2001; CitationLack and Cappa 2010). The aging of the soot leads to several possible mixing states: externally mixed states, where soot is coarsely mixed with the coating material in separate phases; core–shell states, where there is a well defined core and coating in a single particle; and internally mixed states, where the soot and coating material are well mixed in a near homogenous manner in a single phase particle. It is the core–shell state that appears to be the most prevalent for aged soot (CitationJacobson 2000) and the system considered in this study. The coating of soot with sulfuric acid and subsequent hygroscopic growth due to interactions in the atmosphere lead to enhancement of the absorption cross section of the soot particles; recent work has shown that the coating processes can nearly double the amount of light absorption by soot (CitationZhang et al. 2008).
More accurate measurements of soot absorption cross section (C abs) and radiative forcing are required by global climate models (CitationHaywood and Ramaswamy 1998; CitationCooke et al. 1999; CitationHaywood and Boucher 2000). However, such data are difficult to obtain because of variability in morphology, composition, mixing state, and conditioning of soot. Since soot cannot be defined by a unique chemical formula (e.g., silica) and its composition is source dependent (CitationCartwright et al. 1956; CitationSchneider 1972), it presents an initially difficult characterization problem, which becomes more complex based on atmospheric aging. These complexities contribute to the highly uncertain values for the radiative forcing of soot. Accurate measurement of the optical properties of soot in the atmosphere is difficult because of the large number of uncontrolled variables, such as temperature, pressure, and humidity, as well as the soot's source, composition, history, and age (Saathoff, Mohler, et al. 2003; CitationWeingartner et al. 2003; CitationSchnaiter et al. 2005). Another factor that hinders many optical measurements of soot is the traditional use of filter-based measurements such as particle soot absorption photometers and aethalometers (CitationWeingartner et al. 2003; CitationCappa et al. 2008; CitationChow et al. 2009; CitationLack et al. 2009). While filter-based measurements are robust and involve simple applications of Beer's law, there are many drawbacks to those methods. These include: (1) an artificially high absorption reading if light is scattered off the particles on the filter and (2) multiple scattering off the substrate itself that may result in multiple absorption events, again resulting in an artificially high absorption result (CitationBond et al. 1999). Ideally one would like to make the optical characterization in a dilute aerosol state where there is a negligible amount of multiple scattering and a negligible decrease in the beam intensity over the path length through the instrument. Several groups have measured the absorption properties of soot (CitationSchnaiter et al. 2005; Slowik, Cross, Han, Davidovits, et al. 2007; CitationGangl et al. 2008; CitationZhang et al. 2008; CitationKhalizov et al. 2009; CitationCross et al. 2010). A typical approach is an indirect determination through a difference between extinction and scattering. This indirect approach may provide reasonable values for the absorption properties, but a direct method can yield accurate results with a lower uncertainty than an indirect method.
There are two established methods to directly measure the optical absorption by soot aerosols that avoid the complications of filter-based methods: photothermal interferometry (CitationSedlacek and Lee 2007) and photoacoustic spectroscopy (PAS) (CitationArnott et al. 2000; CitationLack et al. 2006). Here we use PAS (CitationGillis et al. 2010; CitationHavey et al. 2010) to quantify the effect of a nonabsorbing coating on the optical absorption cross section of size-selected, laboratory-generated, bare, and coated soot particle aerosols. We use dibutyl phthalate (DBP) as a nonabsorbing coating material, which is an optical surrogate for atmospheric H2SO4, and we measure the change in the absorption cross section as a function of particle size and coating thickness. In the next section, we discuss the soot particle generation, size selection, coating, particle counting, and PAS techniques. Finally, we compare the measurements with well-known theories for light absorption.
EXPERIMENTAL METHODS
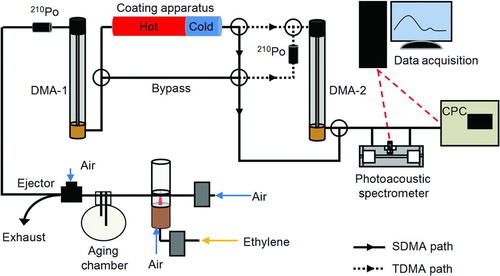
All the measurements, except for the transmission electron microscopy (TEM), were performed at the National Institute of Standards and Technology (NIST) in Gaithersburg, MD. The TEM measurements were performed at the College Park campus of the University of Maryland. The experimental apparatus comprised a diffusion-flame soot generator (CitationSantoro et al. 1983), custom differential mobility analyzers (DMAs) for particle size selection and classification (CitationKnutson and Whitby 1975), a DBP-coating chamber, and the NIST photoacoustic (PA) spectrometer (CitationGillis et al. 2010) for measuring the absorption coefficient and a commercial condensation nuclei particle counter (CPC) as shown in . The soot size selection and classification system consisted of two custom DMAs using TSI model 3081Footnote 1 long columns and two 210Po bipolar charge neutralizers. We implemented two experimental methods for selecting well-defined ensembles of bare and coated soot particles for PAS and CPC analysis: in one method, we used a single DMA (SDMA) for size-selection, whereas in the other method, we added a second DMA for a tandem DMA (TDMA) arrangement to further refine the size distribution. For both methods, the particles from the soot generator were passed through a neutralizer and then size selected with DMA-1, as indicated in . For the SDMA method, the size-selected particles emerging from DMA-1 were sent either directly to the PA spectrometer and the CPC for analysis of the bare particles or through the DBP-coating chamber before going to the PA spectrometer and the CPC for analysis of the coated particles. The size distributions of the uncoated and coated soot particles were measured with DMA-2 in scanning mode. For the analysis of bare particles with the TDMA method, the size-selected soot particles emerging from DMA-1 were directed through a second bipolar charge neutralizer, then through DMA-2 for additional size selection, as described below, then on to the PA spectrometer and the CPC. For the analysis of coated particles with the TDMA method, the size-selected bare particles emerging from DMA-1 passed through the coating chamber as in the SDMA method, but the coated soot particles were then size selected again with DMA-2 before analysis. The second neutralizer was not used for the coated particles. The TDMA method yielded soot particles with narrow size distributions for both the uncoated and coated soot particles. We note, however, that the particle count for the TDMA experiment was reduced approximately tenfold compared with that of the SDMA method. In the next sections, we discuss the soot generation, the size selection and classification, the coating system, the particle counting, and the photoacaustic resonator in more detail. Unless otherwise stated, we report the combined standard uncertainty (k = 1) for type A and type B uncertainties.
FIG. 1 Schematic of the apparatus that shows the path of the aerosol stream from the soot generation system to the CPC. The first differential mobility analyzer (DMA-1) selects the mobility of the soot particles within a narrow distribution. After DMA-1, the soot stream either passed through the coating apparatus to coat the particles with DBP or bypassed the coating apparatus to leave the particles uncoated. For the SDMA measurements, the stream was then sent directly to the PA spectrometer. For the TDMA measurements, the stream passed through the second neutralizer (uncoated particles only) and DMA-2 for further size selection, then on to the PA spectrometer and the CPC. (Color figure available online.)
Soot Generation
The soot was generated in a Santoro style diffusion burner (CitationSantoro et al. 1983) and sampled via a method described by CitationKim et al. (2005). Particle-free, dry air was delivered at 5 L min−1 orthogonally to an ethylene combustion flame. An ejector pump downstream of the sampling probe created a low-pressure region in the direction of the soot flow with a pressure drop of approximately 1 kPa. The low pressure at the flame tip drew the flame into a 1 mm diameter hole in the sampling probe at the flame–probe interface. The generated soot was carried to a 5 L volume accumulation chamber, where the fresh soot was allowed to agglomerate in order to increase the particle size. The aerosol stream flowed from the accumulation chamber through the ejector pump, where the stream was diluted 6:1 with particle-free air. The diluted stream was then sampled to create a 1.5 L min−1 aerosol stream that flowed through the rest of the experimental system.
Size Selection and Classification
The calibration of the DMAs used in the SDMA and TDMA measurements was checked using NIST SRM 1964 (60 nm polystyrene latex spheres), which has an uncertainty of 0.5% (CitationMulholland et al. 2006). The polystyrene latex spheres, originally in suspension, were aerosolized with an electrospray before entering the DMA. The observed peak particle size for the 60 nm spheres was within 1.0% of the certified diameter. This small deviation was not used to correct our SDMA and TDMA data but is treated as an uncertainty in d m. An additional 2.0% uncertainty in d m is due to day-to-day variations in the sheath flow and atmospheric pressure. The combined relative uncertainty in d m from these components is 2.3%.
Differential mobility analysis separates particles on the basis of their electrical mobility, Z. For spherical particles, Z depends on the charge number q, the carrier gas's viscosity η, and the mobility diameter d
m through the relation ![]() , where C
C(d
m) is the Cunningham slip factor and e is the elementary charge (
, where C
C(d
m) is the Cunningham slip factor and e is the elementary charge (![]() ). This relationship can be empirically applied to nonspherical particles, in which case d
m represents the mobility diameter of a spherical particle with the same electrical mobility. For the restricted range of particle sizes studied in this work,
). This relationship can be empirically applied to nonspherical particles, in which case d
m represents the mobility diameter of a spherical particle with the same electrical mobility. For the restricted range of particle sizes studied in this work, ![]() , approximately, where γ = 1.65. Thus, singly and doubly charged particles will have the same electrical mobility Z if dm,/dm,1 ≈ 1.5, where d
m,1 and d
m,2 are the respective mobility diameters. In general, a particle stream, selected for a given electrical mobility, may be a composite of singly and multiply charged particles with different mobility diameters.
, approximately, where γ = 1.65. Thus, singly and doubly charged particles will have the same electrical mobility Z if dm,/dm,1 ≈ 1.5, where d
m,1 and d
m,2 are the respective mobility diameters. In general, a particle stream, selected for a given electrical mobility, may be a composite of singly and multiply charged particles with different mobility diameters.
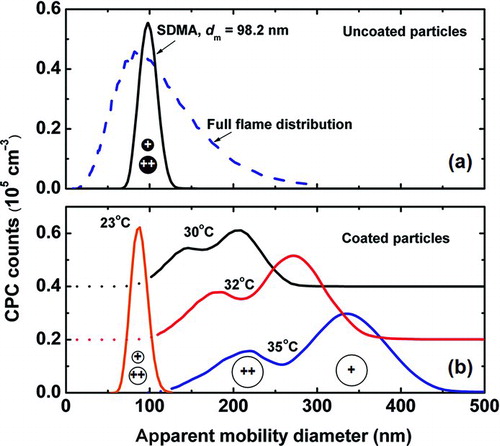
The flame-generated soot studied here is composed of a broad size distribution of singly and multiply charged particles as shown by the dashed curve in . We measured this distribution by scanning the selected voltage (mobility) of DMA-1. The narrower distribution of bare particles (solid line in ) was obtained by fixing DMA-1 to select particles with a mobility diameter of 100 nm; the distribution was measured by scanning DMA-2, and its width reflects the combined resolution of the two DMAs. The distributions are plotted as a function of the apparent mobility diameter, d
am. The true mobility diameter for particles with charge number q > 1 is ![]() . For singly charged particles (q = 1), the apparent mobility and the true mobility are identical. We emphasize that singly and multiply charged particles with the same electrical mobility contribute to this distribution and are not distinguishable because they have the same apparent mobility diameter. The relative sizes of the singly and doubly charged particles are indicated by the black circles under the peak.
. For singly charged particles (q = 1), the apparent mobility and the true mobility are identical. We emphasize that singly and multiply charged particles with the same electrical mobility contribute to this distribution and are not distinguishable because they have the same apparent mobility diameter. The relative sizes of the singly and doubly charged particles are indicated by the black circles under the peak.
FIG. 2 (a) The blue dashed line is the full distribution of particles sizes emerging from the flame as measured with a scanning DMA. The black solid line is the size distribution for 100 nm uncoated soot selected with DMA-1 used in the SDMA measurements. The black circles under the peak indicate that both singly (100 nm) and doubly (150 nm) charged particles have the same apparent mobility diameter. (b) The size distributions are shown for the 100 nm particles selected in (a) after coating with DBP at the indicated coating temperatures: higher temperature results in thicker coating. The distributions labeled 30°C and 32°C are shifted vertically for clarity. Particle distributions like these comprise the SDMA measurements. The bimodal distributions arise from the presence of singly and doubly charged particles that have the same coating diameter but have different apparent mobility diameters. The shift of the unimodal distribution labeled 23°C to a smaller diameter from the uncoated distribution is evidence that the soot particles undergo a transition in morphology early in the coating process. (Color figure available online.)
To observe the component distributions, the particles were passed through a second neutralizer to change the charge on the size-selected particles according to a Boltzmann probability and then were analyzed by scanning DMA-2. shows the resultant component distributions of uncoated soot with 100 nm apparent mobility diameter. The particle size probability density FN plotted in has been corrected to account for the logarithmic dependence of the DMA response and normalized by the maximum particle counts. There are four identified particle peaks. The relative sizes and charge numbers of the particles that contribute to each peak are also shown. Above each peak, the original charge and the subsequent charge after reneutralization are indicated for the predominant particle. The peaks labeled q → 1 identify particles that had charge q after emerging from DMA-1 but became singly charged by the second neutralizer. The peak locations indicate their respective true mobility diameters. The peak labeled 1 → 2 is due to singly charged particles that acquired a second charge and is located at its apparent mobility diameter. Each peak was fit with a log normal distribution (dotted curves) to determine the peak position and width. The deviations of the composite fit from the data are shown in and have a combined standard deviation of 0.01.
FIG. 3 (a) The normalized size distribution FN for uncoated soot particles that were size selected with DMA-1 for a 100 nm apparent mobility diameter. To observe the component distributions of the singly and multiply charged particles, the particles were first passed through a second neutralizer to change the charge on the particles before analysis with DMA-2. The notation q → 1 indicates particles that initially carried charge q became singly charged and are centered about their true mobility diameter. (b) Residuals from a fit with five log-normal distributions. The root-mean-squared deviation from the fit was 0.01. (Color figure available online.)
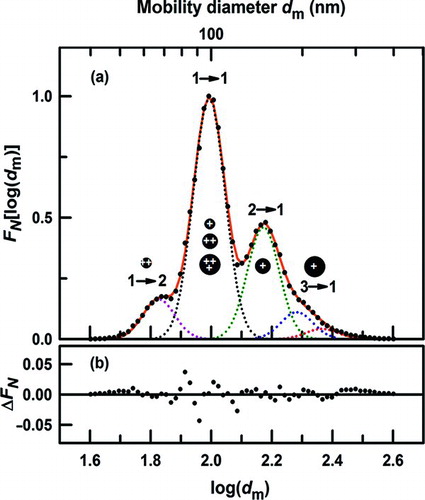
The plot in shows the presence of doubly (d m ≈ 150 nm), triply (d m ≈ 200 nm), and multiply charged particles in addition to the singly charged (d m ≈ 100 nm) particles emerging from DMA-1 (CitationKim et al. 2005). By neglecting the small number of particles with more than two charges, we deduced the charge fractions given in from measurements using the CPC to count particles and an electrometer to count charges exiting the DMA. To justify our approximation, we estimated the charge fractions, including triply charged particles, based on the peak assignments, their locations, and their respective areas from and by assuming Boltzmann statistics for the charge probability. From this analysis, we estimate the fraction of triply charged particles to be less than 10% for all the particles that we studied. We observed qualitative agreement between the measured and modeled charge fractions for the SDMA data. For the TDMA data, however, there are significant differences (up to 50%) that could not be reconciled between the charged fractions that were measured with the CPC/electrometer (given in ) and those estimated from the DMA size distributions using Boltzmann statistics.
TABLE 1 Mobility diameters of singly (d m,1) and doubly (d m,2) charged uncoated particles for the SDMA and TDMA experiments. The fraction of singly and doubly charged particles is f 1 and 1 − f 1, respectively
Coating System
As shown in , the coating apparatus was located after DMA-1 for both the SDMA and TDMA methods but could be bypassed to study uncoated particles. The coating chamber comprised two 2.54 cm diameter stainless steel tubes. The aerosol stream first entered a 1 m long tube whose inner wall was lined with polyester felt, 3.2 mm thick, saturated with DBP. The outside of the tube was wrapped with a heater and a layer of insulation. The tube was heated in order to generate a DBP vapor through which the aerosol stream passed. Three thermocouples, one attached to each end of the tube and one in contact with the flowing gas, were used to monitor and control the gas phase temperature to within ±0.1 K between ambient and 38°C in order to select the partial pressure of DBP. After the heated tube, the stream passed through a 0.3 m long chilled tube that promoted heterogeneous condensation onto the soot particles. The carrier gas flow rate through the coating chamber was nominally 1.5 L min−1 with a residence time of 11 s. The length of the heated section was designed to ensure adequate coating based on the diffusion plug-flow models from CitationCarslaw and Jaeger (1959) and CitationHinds (1999). We estimate that under these conditions the partial pressure of DBP in the gas exiting the heated section was at least 90% of its saturated vapor pressure at the chamber temperature. For the SDMA experiments, the particles exiting the coating chamber were either directed to the PA spectrometer/CPC for analysis or diverted to DMA-2 for characterization. For the TDMA experiments, the particles exiting the coating chamber were directed to DMA-2 for further size selection and then to the PA spectrometer/CPC for analysis.
The simplicity of the SDMA method made it possible to switch easily between uncoated and coated particle streams through the PA spectrometer. Thus with the SDMA method, we measured the optical absorption for each coating thickness in three steps: first uncoated particles, then coated particles, then uncoated particles again. This alternating method was advantageous because the ratio of the absorption cross sections for the coated and uncoated particles was largely insensitive to the systematic variations in the particle generation, size selection, and particle counting schemes.
The growth of the coating is expected to follow a heterogeneous growth law (CitationFriedlander 1977), which predicts that large particles will grow to the same diameter, independent of the core size. Our measurements support this prediction for all but the thinnest coatings. If all the particles grow to the same size and are singly charged, then they would have the same mobility diameter and their distributions would coincide. However, the distributions for the coated particles labeled 30°C, 32°C, and 35°C in show two distinct peaks for each case: a large peak due to the singly charged (smaller core) particles and a small peak due to the doubly charged (larger core) particles. Moreover, the locations of these peaks are consistent with the two sets of particles having the same outer diameter. Consequently, the coated particles that were measured with the PA spectrometer in the SDMA experiments had a bimodal distribution of core sizes. By contrast, the coated particles in the TDMA experiments were selected from the distribution of smaller core sizes by using DMA-2 and therefore had a nearly monodisperse distribution of core size and outer diameter, as shown in .
Particle Counting
We measured the optical absorption properties of a soot aerosol sample through PAS, as discussed in the next section. In order to determine the optical properties per soot particle, we need to know the number density of soot particles in the sample. We measured the soot particle density with the CPC (TSI, model 3025A). The particles that enter the CPC are nucleation sites for condensation as they pass through saturated vapor of butyl alcohol. The enlarged particles then pass through a laser beam where they are individually counted as flashes of light. We corrected the measured number density N
m to account for shielding effects in the condensation particle counter that occur when two or more particles arrive simultaneously. This coincidence correction is modeled as ![]() , where N
c is the coincidence-corrected particle number density, Q is the volumetric flow rate, and t
m is the measurement time for the CPC. The coincidence correction was between 3% and 9% for particle number densities up to 105 cm−3 presented here. The CPC's manufacturer reports an uncertainty of 10% for particle number densities up to 105 cm−3.
, where N
c is the coincidence-corrected particle number density, Q is the volumetric flow rate, and t
m is the measurement time for the CPC. The coincidence correction was between 3% and 9% for particle number densities up to 105 cm−3 presented here. The CPC's manufacturer reports an uncertainty of 10% for particle number densities up to 105 cm−3.
To determine the charge fractions, we compared the counts from the CPC and the aerosol electrometer (CitationFletcher et al. 2009) using singly charged, 15 nm sucrose particles. Because of sucrose particle's small size, the fraction of particles that were doubly charged was 600 times smaller than the fraction of singly charged particles. The average ratio of electrometer counts to CPC counts was 1.07 ± 0.03. The combined relative standard uncertainty for the CPC, including type A and type B uncertainties, is 10% of the CPC counts.
Photoacoustic Spectroscopy
The principle of PAS is the conversion of optical energy to acoustic energy. This process occurs through the absorption of light by matter and the subsequent thermal relaxation that generates an acoustic wave in the surrounding gas medium. PAS is a zero-background technique that directly measures the absorption coefficient, α, of a sample.
Details of our PA spectrometer, which consists of an acoustic cell, a microphone, a 300 mW continuous-wave diode laser (λ = 405 nm), a lock-in amplifier, a calibrated laser power meter, and a data acquisition system, can be found in CitationGillis et al. (2010) and CitationHavey et al. (2010). The aerosol particle stream passes through the PA spectrometer near atmospheric pressure at a nominal flow rate of 0.2 L min−1 with a residence time of about 1 s. The microphone signal is measured by the lock-in amplifier where both the in-phase, x, and out-of-phase, y, components are recorded. A soot-free background signal (x 0, y 0) is taken on the carrier gas stream at the beginning and end of each experiment. The absorption coefficient α and absorption cross section C abs are related to the measured quantities by
ANALYSIS AND RESULTS
Evidence for Particle Restructuring
TEM Characterization
Coated and uncoated soot were collected on TEM grids with a nano-aerosol sampler (TSI Model 3089) to observe the effect of coating on the soot particles. shows TEM images of 150 nm mobility diameter soot (core) particles: uncoated particles (upper quadrants) and particles coated with DBP (lower quadrants). The mobility diameter of the coated particles was selected with DMA-2 to be 320 nm. The TEM images were taken with a JEOL Jem 2100 microscope equipped with a cold stage. The temperature was maintained at −167°C for both the uncoated and coated particles. The uncoated particle aggregates in clearly show a filamentary structure, whereas the coated particles are more compact with a more nearly spherical morphology. Closer inspection of the TEM images shows that the aggregates comprise nearly spherical 20 nm diameter particles (monomers). Although the presence of the DBP coating is not evident in the micrographs due to evaporation under TEM conditions, the TDMA size selection ensures that the imaged particles were indeed coated. Moreover the collapsed structure, which occurs only with the coated particles, visually illustrates the effect that a DBP coating has on the structure of the soot core.
FIG. 4 TEM micrographs of 150 nm (mobility diameter) soot before and after coating with 100 nm of DBP. Upper quadrants: uncoated soot shows a filamentary structure. Lower quadrants: soot that has been coated with DBP shows a more compact structure than it had before coating. Note that only the cores of the coated particles are visible.
DMA Characterization
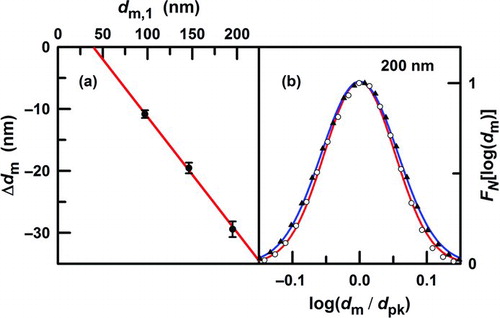
We observe that the apparent mobility diameter of soot particles with a thin coating of DBP is smaller than the apparent mobility diameter of the particles before coating. In , for example, the uncoated-particle size distribution (labeled SDMA) peaked at 98 nm, in this case. After the particles were exposed to DBP at 23°C, the coated-particle size distribution () peaked at 86 nm; that is, the apparent mobility diameter was reduced by 12 nm after exposure to a small amount of DBP. A similar but proportionately larger reduction of the apparent mobility diameter after coating at 23°C was observed for the 150 nm and 200 nm particles. summarizes the observed reduction of the apparent mobility diameter ![]() for the three particle sizes. This reduction of mobility diameter suggests that the particles have collapsed to a more compact structure after exposure to small amounts of DBP. Interestingly, an extrapolation of the linear fit to
for the three particle sizes. This reduction of mobility diameter suggests that the particles have collapsed to a more compact structure after exposure to small amounts of DBP. Interestingly, an extrapolation of the linear fit to ![]() () indicates that there is no shift for particles with d
m ≈ 40 nm or less. This characteristic size corresponds to about 2–3 monomers.
() indicates that there is no shift for particles with d
m ≈ 40 nm or less. This characteristic size corresponds to about 2–3 monomers.
FIG. 5 (a) The change in the apparent mobility diameter of soot particles that were coated with DBP at 23°C (see ) is plotted as a function of the mobility diameter for the 100 nm, 150 nm, and 200 nm singly charged uncoated particles. The intercept for which there is no shift occurs at about 40 nm, which corresponds to 2 or 3 primary particles. (b) The widths of the distributions for the uncoated particles (open circles) and for particles coated with DBP at 23°C (solid triangles) changed by at most 2% of the uncoated diameter. This puts an upper limit on the degree of splitting between the singly and doubly charged particle size distributions. This evidence suggests that all the particle sizes we studied collapsed by the same fractional amount after coating with DBP at 23°C. Error bars represent standard uncertainties (k = 1). (Color figure available online.)
As discussed below, we also observe an increase in the absorption cross section C abs (compared to the uncoated) for these thinly coated particles. For the 200 nm soot particles coated at 23°C, we estimate that the observed increase in C abs is consistent with a 5 nm thick coating of DBP, if the increase in C abs was due entirely to DBP. Such a coating on an agglomerate of 20 nm diameter monomers would be subject to substantial capillary forces that may be responsible for collapse of the filamentary structure during either condensation or evaporation of DBP. However, we cannot rule out the possibility that restructuring alone is responsible for the change in C abs.
Finally, our analysis shows that the shape of the distribution is unchanged by the thin DBP coating for each of the bare-particle sizes (see for the 200 nm case); the distribution is merely shifted to smaller apparent mobility diameter. Therefore, if collapse is occurring, then both the smaller diameter (singly charged) and the larger diameter (doubly charged) particles that make up the composite distribution must collapse by the same fractional amount.
Uncoated Soot
Model for Particle Volume
An estimate of the mass or volume of these aggregates in terms of the measured mobility diameter is required for an analysis of their optical absorption. In a study of diesel soot that incorporated both mass and DMAs, CitationPark et al. (2003) showed a power–law relationship between the particle mass and the mobility diameter, i.e., ![]() with
with ![]() for their soot. Although we do not measure the mass of our soot particles, we show that the particle's absorption cross section is proportional to the amount of substance and therefore has a power–law dependence on d
m. However, we do not assume a priori that the exponent η for flame-generated soot is the same, as it is for diesel soot.
for their soot. Although we do not measure the mass of our soot particles, we show that the particle's absorption cross section is proportional to the amount of substance and therefore has a power–law dependence on d
m. However, we do not assume a priori that the exponent η for flame-generated soot is the same, as it is for diesel soot.
We characterize the amount of soot in an aggregate as the volume occupied by a sphere having the same mass as the aggregate but the mass density of the monomer. The relevant power–law relation, analogous to that of CitationPark et al. (2003), between the aggregate's sphere-equivalent volume, V se, and the mobility diameter is
RDG Theory of Absorption by Agglomerates
The individual monomers are small compared with the wavelength of light used in our measurements (405 nm), so their interaction with the light is described by the Rayleigh limit. The total absorption by the particle can be estimated by summing over the set of monomer absorption cross sections. In this approximation, known as the Rayleigh–Debye–Gans (RDG) model, interactions between soot monomers are not considered, and their light absorption is treated as being independent of agglomerate morphology. By comparison with more general calculations of absorption and scattering from soot clusters, CitationFarias et al. (1996) and CitationKahnert (2010) showed that the accuracy of the RDG approximation depends on the monomer size parameter, ![]() ; the complex refractive index, m = m
r + i m
i; and the number of monomers in the agglomerate, n
M. For the particles studied in this work in which x
M = 0.16 and 40 < n
M < 125, Farias et al. estimate that RDG predicts the absorption cross section of the agglomerate to within 10%. Here, d
M is the monomer diameter and
; the complex refractive index, m = m
r + i m
i; and the number of monomers in the agglomerate, n
M. For the particles studied in this work in which x
M = 0.16 and 40 < n
M < 125, Farias et al. estimate that RDG predicts the absorption cross section of the agglomerate to within 10%. Here, d
M is the monomer diameter and ![]() is the optical wavelength. Under the assumption that x
M < 1 (Rayleigh limit), the absorption cross section of a spherical monomer is
is the optical wavelength. Under the assumption that x
M < 1 (Rayleigh limit), the absorption cross section of a spherical monomer is
If we divide Equation (6) by the monomer mass density, ρs, we obtain the mass absorption cross section (MAC) reported frequently in the literature. In this work, we use the value of 1.8 g cm−3, which has a stated uncertainty of 5% (CitationChoi et al. 1995). Note that the particle absorption cross section is also given in terms of the experimentally measured absorption coefficient, given by Equation (2).
From Equations (4)–(6) we obtain
We determined the coefficients V 0 and η and a set of d se soot core values by fitting the absorption model embodied in the right-hand side of Equation (7) to the measured values of α/N, d m,1, d m,2, and f 1 obtained for uncoated soot particles. These data correspond to a total of six measurements: three for the SDMA and TDMA experiments, respectively. V 0 and η were the only floated parameters used in the fitting procedure.
In order to evaluate the foregoing expressions, we assumed a value of m that satisfies Equation (6) using the MAC obtained from scattering and extinction measurements by CitationZhu et al. (2000) on ethylene soot. The validity of Equation (6) in the context of Zhu's MAC is justified according to the accuracy criteria in of CitationFarias et al. (1996). For their measurements, x
M = 0.18 and n
M = 100. Assuming |m-1| is less than about 1, the estimated uncertainty in the absorption cross section per volume given by Equation (6) is 10%. We scaled their absorption cross section of Zhu et al. to our laser wavelength (λ = 405 nm) to yield a mass-specific value of 10.9 m2 g-1. This corresponds to ![]() = 0.0196 nm-1 assuming a soot density of 1.8 g cm-3. Given that m is complex, there is a family of m values of paired real and imaginary components that when substituted into Equation (6) yield this value of
= 0.0196 nm-1 assuming a soot density of 1.8 g cm-3. Given that m is complex, there is a family of m values of paired real and imaginary components that when substituted into Equation (6) yield this value of ![]() . Of these m values, we based the fit shown in on m = 1.409 + 0.811i, which yielded V
0 = 2.704 nm3 and η = 2.285. On the basis of this fit, the average sphere-equivalent diameters for the combined singly and doubly charged particles are given in . Our rationale behind the choice of this particular refractive index is explained below. Importantly, the fitted exponent η is completely insensitive to the choice of m as is the flatness of the fitted
. Of these m values, we based the fit shown in on m = 1.409 + 0.811i, which yielded V
0 = 2.704 nm3 and η = 2.285. On the basis of this fit, the average sphere-equivalent diameters for the combined singly and doubly charged particles are given in . Our rationale behind the choice of this particular refractive index is explained below. Importantly, the fitted exponent η is completely insensitive to the choice of m as is the flatness of the fitted ![]() . These data support the RDG assumption that leads to
. These data support the RDG assumption that leads to ![]() being independent of effective particle volume. However, changing m alters the fit-derived V
se for the various data points as well as the magnitude of the fitted
being independent of effective particle volume. However, changing m alters the fit-derived V
se for the various data points as well as the magnitude of the fitted ![]() value. When we account for triply charged particles in the analysis of just the SDMA data, the fitted values of V
0 and η change to 3.585 nm3 and 2.240, respectively, and the sphere-equivalent diameters change by at most 2% from the values in and . also illustrates the expected
value. When we account for triply charged particles in the analysis of just the SDMA data, the fitted values of V
0 and η change to 3.585 nm3 and 2.240, respectively, and the sphere-equivalent diameters change by at most 2% from the values in and . also illustrates the expected ![]() resulting from a calculation of the absorption cross section using Lorenz–Mie (LM) theory based upon d
se of the agglomerate. Our data show that this approximation tends to overestimate the value of
resulting from a calculation of the absorption cross section using Lorenz–Mie (LM) theory based upon d
se of the agglomerate. Our data show that this approximation tends to overestimate the value of ![]() for particles with d
se greater than about 40 nm.
for particles with d
se greater than about 40 nm.
FIG. 6 Absorption cross section per-unit-volume of uncoated soot is plotted as a function of the sphere-equivalent particle diameter. The closed and open squares are values deduced from this work based on the SDMA and TDMA methods, respectively, as described in the text. V se is the volume of a sphere whose diameter d se is given by Equation (4) with V 0 = 2.704 nm3 and η = 2.285. The solid (blue) line and the dotted (red) curve are predictions by RDG and LM theory with m = 1.409 + 0.811i. The parameters V 0 and η were adjusted to give the best agreement between our measurements and Zhu et al. (2000). Our assumed MAC value of 10.9 m2 g−1 (based on Zhu et al.) can be compared with previously reported values: 1.5 m2 g−1 to 25.4 m2 g−1 for incomplete combustion products (CitationBond and Bergstrom 2006) and 10.1 ± 0.5 m2 g−1 (CitationChoi et al. 1995), 13.3 m2 g−1 (Slowik, Cross, Han, Kolucki, et al. 2007), and 11.4 m2 g−1 (CitationZhang et al. 2008) for diffusion flame products. The error bars represent standard uncertainties (k = 1). (Color figure available online.)
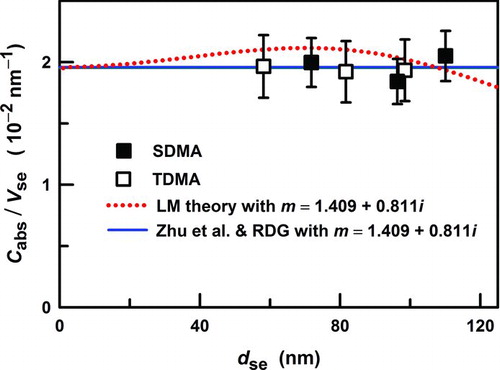
TABLE 2 Combined average sphere-equivalent diameter for the singly and doubly charged particles for both the SDMA and TDMA experiments
TABLE 3 A summary of results for uncoated soot from the SDMA method. C abs,exp and C abs,RDG are, respectively, the measured and modeled average absorption cross sections of the composite soot. The sphere-equivalent diameters and absorption cross sections of the singly and doubly charged components from the model are also listed
Coated Soot
We conducted experiments on coated soot particles to quantify how the absorption cross section changed with soot core diameter and coating thickness. For the size measurements reported here, we assume that the coated particles are nominally spherical and comprise a soot core within a surrounding layer of liquid DBP. Therefore, unlike the case for the bare soot particles, we treat the mobility and sphere-equivalent diameters of the coated particles as being identical. We expect this condition to be met for sufficiently thick coatings of DBP and for the previously discussed situation where the soot aggregate has collapsed after coating.
In and , we present the measured absorption cross section as a function of the normalized coating thickness,![]() , for three sets of nominal bare-particle mobility diameters (100, 150, and 200 nm). Here the core diameter is assumed to be equal to d
se of the bare soot so that the effective coating thickness t
c of the distribution is equal to
, for three sets of nominal bare-particle mobility diameters (100, 150, and 200 nm). Here the core diameter is assumed to be equal to d
se of the bare soot so that the effective coating thickness t
c of the distribution is equal to ![]() . We present results by using the SDMA (closed symbols) and TDMA (open symbols) methods. These data were obtained by starting with uncoated particles and thereafter systematically increasing the temperature of the coating chamber to increase the size of the DBP coating. Although the SDMA measurements of C
abs were acquired, as described above, by alternating between uncoated and coated particles, the data in do not benefit from the ratio method and have not been corrected for systematic drifts that occurred over the course of measurements for each core size. The absorption cross section for the uncoated particles C
abs,unc in is the average value of the uncoated measurements obtained for each core size. For the TDMA measurements, it was not possible to obtain reliable measurements of the absorption cross section for the coated 100 nm particles because of the relatively weak PAS and CPC signals levels, and thus only the 150 nm and 200 nm cases are presented here. The SDMA and TDMA measurements yield consistent results. At fixed d
se, the change in measured C
abs is nominally proportional to Δ. Inspection of indicates that the slope increases with d
se such that
. We present results by using the SDMA (closed symbols) and TDMA (open symbols) methods. These data were obtained by starting with uncoated particles and thereafter systematically increasing the temperature of the coating chamber to increase the size of the DBP coating. Although the SDMA measurements of C
abs were acquired, as described above, by alternating between uncoated and coated particles, the data in do not benefit from the ratio method and have not been corrected for systematic drifts that occurred over the course of measurements for each core size. The absorption cross section for the uncoated particles C
abs,unc in is the average value of the uncoated measurements obtained for each core size. For the TDMA measurements, it was not possible to obtain reliable measurements of the absorption cross section for the coated 100 nm particles because of the relatively weak PAS and CPC signals levels, and thus only the 150 nm and 200 nm cases are presented here. The SDMA and TDMA measurements yield consistent results. At fixed d
se, the change in measured C
abs is nominally proportional to Δ. Inspection of indicates that the slope increases with d
se such that ![]() ranges from ≈2.5 × 10³ nm2 for d
se = 72 nm to ≈1.0 × 10⁴ nm2 for d
se = 110 nm. The relative uncertainty in the fitted slope is ≈8% in the case of all three sets of the SDMA data and 20% or more for the TDMA results. We can estimate the minimum change in coating thickness, t
c,min, from the expression
ranges from ≈2.5 × 10³ nm2 for d
se = 72 nm to ≈1.0 × 10⁴ nm2 for d
se = 110 nm. The relative uncertainty in the fitted slope is ≈8% in the case of all three sets of the SDMA data and 20% or more for the TDMA results. We can estimate the minimum change in coating thickness, t
c,min, from the expression ![]() , where
, where ![]() is the standard deviation of the residuals of the linear regression. For d
se = 110 nm, the data and fit yield
is the standard deviation of the residuals of the linear regression. For d
se = 110 nm, the data and fit yield ![]() ≈ 980 nm2 to give t
c,min ≈ 10 nm.
≈ 980 nm2 to give t
c,min ≈ 10 nm.
TABLE 4 The measured absorption cross section (C abs,exp) and amplification (amp) as a function of coating thickness (t c) from the SDMA method for three core mobility diameters (d m). The sphere-equivalent diameter of the core (d se) is given in
FIG. 7 Absorption cross section C abs as a function of the normalized coating thickness t c/d se for the SDMA (solid circles) and TDMA (open triangles) measurements. The dashed lines are linear fits to each data set. The error bars represent standard uncertainties (k = 1). (Color figure available online.)
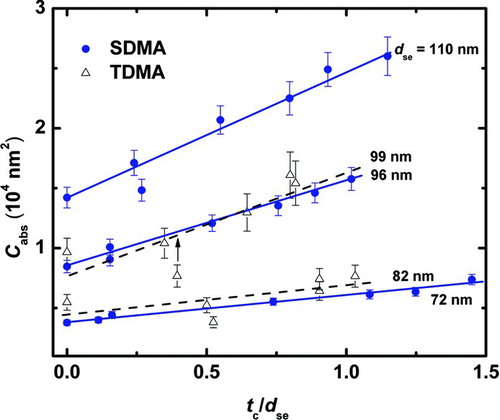
TABLE 5 Contributions to the estimated relative uncertainties (k = 1) of the sphere-equivalent diameter for bare soot d se, the coating thickness t c, and the ratio t c/d se
Our estimates of the important contributions to the uncertainties of the core sphere-equivalent diameter d se, the coating thickness t c, and the ratio t c/d se are listed in . We evaluate the uncertainty in d se by using our model for C abs and the particle volume, as discussed in the previous section. The uncertainty in d se due to our neglect of the triply charged particles was 2%. Additional uncertainty in d se is due to the uncertainty in the refractive index m. We use the two values for m that come from the different fits to our amplification data, as discussed below, as an estimate of the uncertainty in m. When we change the refractive index from 1.409 + 0.811i to 1.386 + 0.719i in the fit to the bare soot data (Equation (7)), the resultant values for d se change by 3%. We estimate the uncertainty in the coating thickness t c from two sources: the DMA uncertainty, estimated to be 2.3% as explained in a previous section and the width of the particle size distribution selected by DMA-1, which is about 10% for all the SDMA data. Using these uncertainty contributions, we estimate the combined standard uncertainty for the ratio t c/d se to be about 11%. The dominant uncertainty arises because we neglected the widths of the size distributions. The uncertainty could be reduced by integration over the true distribution.
Our most precise measurement of the optical amplification A (equal to the ratio of the absorption cross section of the coated and uncoated particles) was obtained via the SDMA measurements. As described above, the uncoated and coated particles were measured in quick succession for each coating thickness. For the 200 nm bare particle size, shows the change in the absorption cross section of particles coated at 23°C relative to the uncoated particles. On the basis of the mean values and standard deviations of ![]()
![]() , we estimate a signal-to-noise ratio of ≈4:1 for DC
abs/C
abs,unc ≈ 4%, which corresponds to a minimum detectable amplification A
min between 1.01 and 1.02. From these measurements alone, we cannot distinguish a change in C
abs due to a thin coating from a change caused by a morphology transformation. As discussed previously, this approach reduced errors in the determination of A that may arise from drifts in the absorption cross section or particle number density. The results are shown in where we present the measured amplification,
, we estimate a signal-to-noise ratio of ≈4:1 for DC
abs/C
abs,unc ≈ 4%, which corresponds to a minimum detectable amplification A
min between 1.01 and 1.02. From these measurements alone, we cannot distinguish a change in C
abs due to a thin coating from a change caused by a morphology transformation. As discussed previously, this approach reduced errors in the determination of A that may arise from drifts in the absorption cross section or particle number density. The results are shown in where we present the measured amplification, ![]() (symbols) and fitted models (lines) versus the effective coating thickness. To model these data, we assume that the coated particles can be described by a spherically symmetric, two-layer geometry with the DBP forming a uniform film of diameter d
m around the soot core. Further, consistent with our previously discussed evidence of restructuring and collapse of the soot agglomerate, we assumed that after coating, the agglomerated soot particles restructured into a nominally spherical shape. In this model, the effective core diameter was equal to the sphere-equivalent diameter of the singly and doubly charged uncoated soot particles given by Equation (4). Absorption by the coated particles was calculated using the LM theory of scattering and absorption by a spherically symmetric, two-layer particle (core–shell configuration), and absorption by the uncoated (and agglomerated) soot particles was modeled using RDG theory, Equation (6). To model the amplification, we included the contributions of the singly and doubly charged particles as a weighted sum of absorption cross sections. With these assumptions, the modeled amplification is
(symbols) and fitted models (lines) versus the effective coating thickness. To model these data, we assume that the coated particles can be described by a spherically symmetric, two-layer geometry with the DBP forming a uniform film of diameter d
m around the soot core. Further, consistent with our previously discussed evidence of restructuring and collapse of the soot agglomerate, we assumed that after coating, the agglomerated soot particles restructured into a nominally spherical shape. In this model, the effective core diameter was equal to the sphere-equivalent diameter of the singly and doubly charged uncoated soot particles given by Equation (4). Absorption by the coated particles was calculated using the LM theory of scattering and absorption by a spherically symmetric, two-layer particle (core–shell configuration), and absorption by the uncoated (and agglomerated) soot particles was modeled using RDG theory, Equation (6). To model the amplification, we included the contributions of the singly and doubly charged particles as a weighted sum of absorption cross sections. With these assumptions, the modeled amplification is
FIG. 8 (a) Example sequence for the SDMA measurements. The fractional change in the absorption cross section observed by alternating between uncoated and coated particles is plotted as a function of time for 200 nm core soot. The uncoated particles have a sphere-equivalent diameter d se ≈ 110 nm. The coated particles have an effective coating thickness t c = (d m – d se)/2 ≈ 5 nm. For each coating thickness and core diameter, the amplification A ≡ C abs,coat/C abs,unc was determined in the sequence uncoated/coated/uncoated. (b) The measured amplification (symbols) of the optical absorption due to a DBP coating is plotted as a function of tc for the 100 nm, 150 nm, and 200 nm core sizes. We used LM theory for a spherical core–shell configuration to model the amplification. The model was fit to the 150 nm and 200 nm core size data by treating the soot's complex refractive index m as a variable parameter. The solid lines correspond to the fitted model with the real and imaginary parts of m constrained to give (C abs/V se)RDG = 0.0196 nm−1 using Equation (6). The dashed lines were obtained by independently varying the two components of m. The two fits yielded m = 1.409 + 0.8110i and m = 1.386 + 0.719i, respectively. The error bars represent standard uncertainties (k = 1). (Color figure available online.)
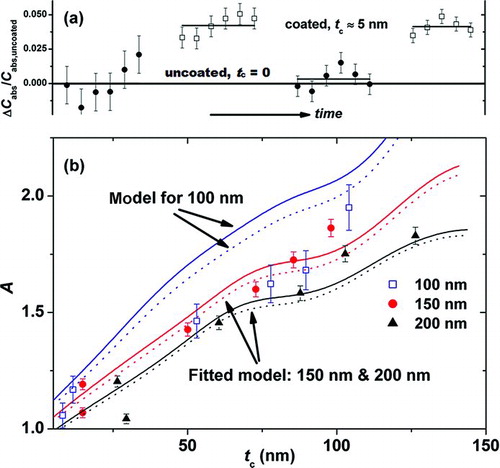
We can estimate t c,min for the uncoated/coated/uncoated measurement sequence by A min/(dA/dt c) where dA/dt c = 0.88% nm-1 is obtained from the model in . For A min ≈ 1.015 given above, t c,min ≈ 2 nm or less, consistent with our previous observations (CitationHavey et al. 2010). We note that this is about 5 times smaller than the above estimate for t c,min of 10 nm based on the data in , which did not incorporate the uncoated/coated/uncoated measurement sequence.
The scatter of the data in (±5% for t c < 30 nm and ±1% – ±3% otherwise) is significantly larger than the precision demonstrated in . We attribute the scatter to the irreproducibility in the soot generation and coating techniques and not limitations of the PA spectrometer or the CPC. That is, by choosing the same experimental conditions (i.e., mobility diameter, coating temperature, combustion and soot sampling parameters, etc.), we are unable to reproduce the same state corresponding to a specific morphology and composition. In our previous publication (CitationHavey et al. 2010), we quantified the relative standard deviations of the measurements of C abs for uncoated soot particles over four relevant time scales (1 min, 6 min, 5 h, and 24 h to be 0.2%, <1%, 1.5%, and 10%, respectively). The relative standard deviation was computed on the basis of continuous 5 h measurements for the first three cases and measurements on four separate days for the last. These observations indicate that the optical properties of the uncoated soot particles have a large day-to-day variability. A reason for day-to-day variability is the irreproducibility of the flame/sampling conditions leading to changes in the composition, primary sphere size, and agglomerate distribution. Each of these changes would affect the absorption cross section for a fixed mobility diameter. For coated particles, there may be additional irreproducibility and instability in the coating system. Furthermore, the particles with the thinnest coatings, which may have undergone varying degrees of restructuring, exhibit the largest scatter. While there are reproducibility issues with the current data, the PA spectrometer could be a key tool in developing an improved flame generator by its ability to accurately measure the absorption coefficient of the generated aerosol.
DISCUSSION AND CONCLUSIONS
In this study, we investigated how the optical absorption of soot particles is affected by the presence of a nonabsorbing coating material. The experiment involved measurements of a soot aerosol stream and comprised the following elements: (1) the generation and sampling of soot agglomerates (ranging between ≈100 nm to ≈200 nm in mobility diameter) from an ethylene diffusion flame, (2) coating the soot with controlled layer thicknesses of DBP, (3) particle size selection with DMAs, (4) absorption coefficient measurements with a PA spectrometer, and (5) measurement of aerosol number density with a CPC. The coated and uncoated particles were also collected on grids and inspected using TEM microscopy.
The TEM analysis revealed that the uncoated soot was aggregated and composed of primary spherical particles, which were approximately 20 nm in diameter. We found that the absorption cross section per-unit-volume was independent of particle size, consistent with the aggregated morphology and RDG theory. Assuming a power–law relationship between the sphere-equivalent diameter of the soot aggregates and the mobility diameter enabled us to infer an exponent of 2.285 from our measurements of soot absorption coefficient. TEM images and DMA mobility diameter measurements provided evidence that coating of soot by DBP leads to restructuring or collapsing of the aggregated soot particles. The coated-soot data also reveal that coating leads to an overall increase in the absorption cross section of the composite particle, consistent with LM theory for core–shell spherical geometries. The theoretical increase in absorption depends upon the size of the soot core, with amplification increasing as core size is reduced (for a fixed coating thickness). We observed absorption amplifications up to ≈1.8 for the largest soot particles (mobility diameter ≈100 nm) and the thickest coatings (thickness ≈100 nm). For the two largest core sizes investigated, the relative change in C abs caused by the coatings was consistent with LM theory. However, for the smallest core size investigated (≈100 nm mobility diameter), the observed amplification in absorption was smaller than the predictions. This discrepancy may be due to differences in the morphology of the coated particles and/or structure of the soot core.
While there have been several other investigations of the present problem (Slowik, Cross, Han, Davidovits, et al. 2007; CitationGangl et al. 2008; CitationZhang et al. 2008; CitationKhalizov et al. 2009; CitationLack et al. 2009; CitationShiraiwa et al. 2010), there are important differences with respect to the present investigation. Previous researchers have used either: (1) indirect measurements of the absorption, (2) surrogates for soot and atmospherically relevant coatings, or (3) a much wider range of particle coating thicknesses. With respect to these previous studies, although we have demonstrated similar levels of observed absorption amplifications for the largest soot particles, our ability to observe relatively small changes in the coating thickness (≈2 nm) and our absorption enhancement uncertainty (≈1.5%) are unmatched. We attribute our improved precision to the sensitivity and stability of the PAS and CPC measurements. In similar experiments uncertainties in the absorption enhancement as high as 25% have been reported (CitationShiraiwa et al. 2010).
We have demonstrated the ability to measure subtle changes in soot optical properties. These effects could be caused by a variety of mechanisms, including chemical reactions at the particle surface, mixing effects, soot restructuring and morphology changes, and other effects. Thus, high-precision measurements of the particle absorption cross section may provide new insight into a number of important chemical and physical processes that are relevant to the formation, transport, and ageing of soot particles. This enhanced sensitivity enables us to distinguish the degree to which amplification occurs as a function of particle size and morphology. Further, these measurements are not limited to the laboratory. Field measurements with the high precision demonstrated herein are achievable, in principle, provided one can realize an aerosol sampling scheme that enables a relatively rapid comparison with respect to a reference stream.
An unresolved question in the present experiment is to what extent one can know the correspondence between measured mobility diameter and sphere-equivalent diameter of the coated particles. An alternate and complementary experimental technique would be to select the particles by mass rather than mobility diameter. In principle, this would remove the ambiguity in effective coating thickness and provide a direct measure of the relationship between a mass-based coating thickness and absorption enhancement. Measurements of this sort would be insightful for core–shell as well as agglomerated morphologies and are expected to provide more quantitative absorption cross section data for these difficult-to-characterize aerosols.
Acknowledgments
The authors would like to acknowledge the support of the Department of Energy's National Institute for Global Environmental Change Award #DE-FC02-03ER63613 and the support of NIST's Greenhouse Gas Measurements Program. We also thank the University of Maryland's Nanoscale Imaging Spectroscopy and Properties Lab for the use of their facilities and Dr. Wen-An Chiou for producing the TEM micrographs.
Notes
1Commercial equipment, instruments, and materials or software, are identified in this article to adequetly specify the experimental procedure. Such identification does not imply recommendation or endorsement of these items by the National Institute of Standards and Technology (NIST), nor does it imply that they are the best available for the purpose.
REFERENCES
- Arnott , W. P. , Moosmuller , H. and Walker , J. W. 2000 . Nitrogen Dioxide and Kerosene-Flame Soot Calibration of Photoacoustic Instruments for Measurement of Light Absorption by Aerosols . Rev. Sci. Instrum. , 71 : 4545 – 4552 .
- Bond , T. C. , Anderson , T. L. and Campbell , D. 1999 . Calibration and Intercomparison of Filter-Based Measurements of Visible Light Absorption by Aerosols . Aerosol Sci. Technol. , 30 : 582 – 600 .
- Bond , T. C. and Bergstrom , R. W. 2006 . Light Absorption by Carbonaceous Particles: An Investigative Review . Aerosol Sci. Technol. , 40 : 27 – 67 .
- Cappa , C. D. , Lack , D. A. , Burkholder , J. B. and Ravishankara , A. R. 2008 . Bias in Filter-Based Aerosol Light Absorption Measurements Due to Organic Aerosol Loading: Evidence from Laboratory Measurements . Aerosol Sci. Technol. , 42 : 1022 – 1032 .
- Carslaw , H. S. and Jaeger , J. C. 1959 . Conduction of Heat in Solids , Oxford : Clarendon Press .
- Cartwright , J. , Nagelschmidt , G. and Skidmore , J. W. 1956 . The Study of Air Pollution with Electron Microscope . Quart. J. Roy. Meteor. Soc. , 82 : 82 – 86 .
- Choi , M. Y. , Mulholland , G. W. , Hamins , A. and Kashiwagi , T. 1995 . Comparison of the Soot Volume Fraction Using Gravimetric and Light Extinction Techniques . Combust. Flame , 102 : 161 – 169 .
- Chow , J. C. , Watson , J. G. , Doraiswamy , P. , Chen , L. W. A. , Sodeman , D. A. , Lowenthal , D. H. , Park , K. , Arnott , W. P. and Motallebi , N. 2009 . Aerosol Light Absorption, Black Carbon, and Elemental Carbon at the Fresno Supersite, California . Atmos. Res. , 93 : 874 – 887 .
- Chylek , P. , Videen , G. , Ngo , D. , Pinnick , R. G. and Klett , J. D. 1995 . Effect of Black Carbon on the Optical-Properties and Climate Forcing of Sulfate Aerosols . J. Geophys. Res. Atmos. , 100 : 16325 – 16332 .
- Cooke , W. F. , Liousse , C. , Cachier , H. and Feichter , J. 1999 . Construction of a 1 Degrees × 1 Degrees Fossil Fuel Emission Data Set for Carbonaceous Aerosol and Implementation and Radiative Impact in the ECHAM4 Model . J. Geophys. Res. Atmos. , 104 : 22137 – 22162 .
- Cross , E. S. , Onasch , T. B. , Ahern , A. , Wrobel , W. , Slowik , J. G. , Olfert , J. , Lack , D. A. , Massoli , P. , Cappa , C. D. , Schwarz , J. P. , Spackman , J. R. , Fahey , D. W. , Sedlacek , A. , Trimborn , A. , Jayne , J. T. , Freedman , A. , Williams , L. R. , Ng , N. L. , Mazzoleni , C. , Dubey , M. , Brem , B. , Kok , G. , Subramanian , R. , Freitag , S. , Clarke , A. , Thornhill , D. , Marr , L. C. , Kolb , C. E. , Worsnop , D. R. and Davidovits , P. 2010 . Soot Particle Studies—Instrument Inter-Comparison—Project Overview . Aerosol Sci. Technol. , 44 : 592 – 611 .
- Dickerson , R. R. , Andreae , M. O. , Campos , T. , Mayol-Bracero , O. L. , Neusuess , C. and Streets , D. G. 2002 . Analysis of Black Carbon and Carbon Monoxide Observed Over the Indian Ocean: Implications for Emissions and Photochemistry . J. Geophys. Res. Atmos. , 107 : 16-1 – 16-11 .
- Farias , T. L. , Koylu , U. O. and Carvalho , M. G. 1996 . Range of Validity of the Rayleigh-Debye-Gans Theory for Optics of Fractal Aggregates . Appl. Optics , 35 : 6560 – 6567 .
- Fletcher , R. A. , Mulholland , G. W. , Winchester , M. R. , King , R. L. and Klinedinst , D. B. 2009 . Calibration of a Condensation Particle Counter Using a NIST Traceable Method . Aerosol Sci. Technol. , 43 : 425 – 441 .
- Friedlander , S. K. 1977 . Smoke, Dust and Haze: Fundamentals of Aerosol Behavior , New York : John Wiley .
- Gangl , M. , Kocifaj , M. , Videen , G. and Horvath , H. 2008 . Light Absorption by Coated Nano-Sized Carbonaceous Particles . Atmos. Environ. , 42 : 2571 – 2581 .
- Gillis , K. A. , Havey , D. K. and Hodges , J. T. 2010 . Standard Photoacoustic Spectrometer: Model and Validation Using O-2 A-Band Spectra . Rev. Sci. Instrum. , 81 : 6
- Hallett , J. , Hudson , J. G. and Rogers , C. F. 1989 . Characterization of Combustion Aerosols for Haze and Cloud Formation . Aerosol Sci. Technol. , 10 : 70 – 83 .
- Havey , D. K. , Bueno , P. A. , Gillis , K. A. , Hodges , J. T. , Mulholland , G. W. , van Zee , R. D. and Zachariah , M. R. 2010 . Photoacoustic Spectrometer with a Calculable Cell Constant for Measurements of Gases and Aerosols . Anal. Chem. , 82 : 7935 – 7942 .
- Haywood , J. and Boucher , O. 2000 . Estimates of the Direct and Indirect Radiative Forcing Due to Tropospheric Aerosols: A Review . Rev. Geophys. , 38 : 513 – 543 .
- Haywood , J. M. and Ramaswamy , V. 1998 . Global Sensitivity Studies of the Direct Radiative Forcing Due to Anthropogenic Sulfate and Black Carbon Aerosols . J. Geophys. Res. Atmos. , 103 : 6043 – 6058 .
- Hinds , W. C. 1999 . Aerosol Technology: Properties, Behavior, and Measurement of Airoborne Particles , New York : John Wiley .
- Intergovernmental Panel on Climate Change (IPCC) . 2009 . Climate Change 2007: The Physical Science Basis. Contribution of Working Group I to the Fourth Assessment Report of the Intergovernmental Panel on Climate Change , Cambridge : Cambridge University Press .
- Jacobson , M. Z. 2000 . A Physically-Based Treatment of Elemental Carbon Optics: Implications for Global Direct Forcing of Aerosols . Geophys. Res. Lett. , 27 : 217 – 220 .
- Jacobson , M. Z. 2001 . Strong Radiative Heating Due to the Mixing State of Black Carbon in Atmospheric Aerosols . Nature , 409 : 695 – 697 .
- Kahnert , M. 2010 . Modelling the Optical and Radiative Properties of Freshly Emitted Light Absorbing Carbon Within an Atmospheric Chemical Transport Model . Atmos. Chem. Phys. , 10 : 1403 – 1416 .
- Khalizov , A. F. , Xue , H. X. , Wang , L. , Zheng , J. and Zhang , R. Y. 2009 . Enhanced Light Absorption and Scattering by Carbon Soot Aerosol Internally Mixed with Sulfuric Acid . J. Phys. Chem. A , 113 : 1066 – 1074 .
- Kim , S. H. , Fletcher , R. A. and Zachariah , M. R. 2005 . Understanding the Difference in Oxidative Properties Between Flame and Diesel Soot Nanoparticles: The Role of Metals . Environ. Sci. Technol. , 39 : 4021 – 4026 .
- Knutson , E. O. and Whitby , K. T. 1975 . Aerosol Classification by Electric Mobility: Apparatus, Theory and Applications . J. Aerosol Sci. , 6 : 9
- Lack , D. A. and Cappa , C. D. 2010 . Impact of Brown and Clear Carbon on Light Absorption Enhancement, Single Scatter Albedo and Absorption Wavelength Dependence of Black Carbon . Atmos. Chem. Phys. , 10 : 4207 – 4220 .
- Lack , D. A. , Cappa , C. D. , Cross , E. S. , Massoli , P. , Ahern , A. T. , Davidovits , P. and Onasch , T. B. 2009 . Absorption Enhancement of Coated Absorbing Aerosols: Validation of the Photo-Acoustic Technique for Measuring the Enhancement . Aerosol Sci. Technol. , 43 : 1006 – 1012 .
- Lack , D. A. , Lovejoy , E. R. , Baynard , T. , Pettersson , A. and Ravishankara , A. R. 2006 . Aerosol Absorption Measurement Using Photoacoustic Spectroscopy: Sensitivity, Calibration, and Uncertainty Developments . Aerosol Sci. Technol. , 40 : 697 – 708 .
- Mulholland , G. W. , Donnelly , M. K. , Hagwood , C. R. , Kukuck , S. R. , Hackley , V. A. and Pui , D. Y. H. 2006 . Measurement of 100 nm and 60 nm Particle Standards by Differential Mobility Analysis . J. Res. Natl. Inst. Stan. , 111 : 257 – 312 .
- Net , S. , Nieto-Gligorovski , L. , Gligorovski , S. , Temime-Rousell , B. , Barbati , S. , Lazarou , Y. G. and Wortharn , H. 2009 . Heterogeneous Light-Induced Ozone Processing on the Organic Coatings in the Atmosphere . Atmos. Environ. , 43 : 1683 – 1692 .
- Park , K. , Cao , F. , Kittelson , D. B. and McMurry , P. H. 2003 . Relationship Between Particle Mass and Mobility for Diesel Exhaust Particles . Environ. Sci. Technol. , 37 : 577 – 583 .
- Ramanathan , V. and Carmichael , G. 2008 . Global and Regional Climate Changes Due to Black Carbon . Nat. Geosci. , 1 : 221 – 227 .
- Saathoff , H. , Mohler , O. , Schurath , U. , Kamm , S. , Dippel , B. and Mihelcic , D. 2003 . The AIDA Soot Aerosol Characterisation Campaign 1999 . J. Aerosol Sci. , 34 : 1277 – 1296 .
- Saathoff , H. , Naumann , K. H. , Schnaiter , M. , Schock , W. , Weingartner , E. , Baltensperger , U. , Kramer , L. , Bozoki , Z. , Poschl , U. , Niessner , R. and Schurath , U. 2003 . Carbon Mass Determinations During the AIDA Soot Aerosol Campaign 1999 . J. Aerosol Sci. , 34 : 1399 – 1420 .
- Santoro , R. J. , Semerjian , H. G. and Dobbins , R. A. 1983 . Soot Particle Measurements in Diffusion Flames . Combust. Flame , 51 : 203 – 218 .
- Schmid , O. , Schaniter , M. , Andeae , M. O. , Linke , C. , Moehler , O. , Saathoff , H. , Schoeck , W. and Wagner , U. 2004 . Absorption Properties of Black Carbon with Refractive Coatings: Intercomparison of Different Instruments . Geophys. Res. Abstr. , : 6
- Schnaiter , M. , Linke , C. , Mohler , O. , Naumann , K. H. , Saathoff , H. , Wagner , R. , Schurath , U. and Wehner , B. 2005 . Absorption Amplification of Black Carbon Internally Mixed with Secondary Organic Aerosol . J. Geophys. Res. Atmos. , 110 : 1 – 11 .
- Schneider , S. H. 1972 . Atmospheric Particles and Climate: Can We Evaluate the Impact of Man's Activities . Inst. Environ. Sci. Proc. , 18 : 557 – 563 .
- Schumann , U. , Strom , J. , Busen , R. , Baumann , R. , Gierens , K. , Krautstrunk , M. , Schroder , F. P. and Stingl , J. 1996 . In Situ Observations of Particles in Jet Aircraft Exhausts and Contrails for Different Sulfur-Containing Fuels . J. Geophys. Res. Atmos. , 101 : 6853 – 6869 .
- Sedlacek , A. and Lee , J. 2007 . Photothermal Interferometric Aerosol Absorption Spectrometry . Aerosol Sci. Technol. , 41 : 1089 – 1101 .
- Shiraiwa , M. , Kondo , Y. , Iwamoto , T. and Kita , K. 2010 . Amplification of Light Absorption of Black Carbon by Organic Coating . Aerosol Sci. Technol. , 44 : 46 – 54 .
- Slowik , J. G. , Cross , E. S. , Han , J. H. , Davidovits , P. , Onasch , T. B. , Jayne , J. T. , Williams , L. R. , Canagaratna , M. R. , Worsnop , D. R. , Chakrabarty , R. K. , Moosmuller , H. , Arnott , W. P. , Schwarz , J. P. , Gao , R. S. , Fahey , D. W. , Kok , G. L. and Petzold , A. 2007 . An Inter-Comparison of Instruments Measuring Black Carbon Content of Soot Particles . Aerosol Sci. Technol. , 41 : 295 – 314 .
- Slowik , J. G. , Cross , E. S. , Han , J. H. , Kolucki , J. , Davidovits , P. , Williams , L. R. , Onasch , T. B. , Jayne , J. T. , Kolb , C. E. and Worsnop , D. R. 2007 . Measurements of Morphology Changes of Fractal Soot Particles Using Coating and Denuding Experiments: Implications for Optical Absorption and Atmospheric Lifetime . Aerosol Sci. Technol. , 41 : 734 – 750 .
- Snelling , D. R. , Liu , F. S. , Smallwood , G. J. and Gulder , O. L. 2004 . Determination of the Soot Absorption Function and Thermal Accommodation Coefficient Using Low-Fluence LII in a Laminar Coflow Ethylene Diffusion Flame . Combust. Flame , 136 : 180 – 190 .
- Weingartner , E. , Saathoff , H. , Schnaiter , M. , Streit , N. , Bitnar , B. and Baltensperger , U. 2003 . Absorption of Light by Soot Particles: Determination of the Absorption Coefficient by Means of Aethalometers . J. Aerosol Sci. , 34 : 1445 – 1463 .
- Zhang , R. Y. , Khalizov , A. F. , Pagels , J. , Zhang , D. , Xue , H. X. and McMurry , P. H. 2008 . Variability in Morphology, Hygroscopicity, and Optical Properties of Soot Aerosols During Atmospheric Processing . Proc. Natl. Acad. Sci. USA , 105 : 10291 – 10296 .
- Zhu , J. Y. , Choi , M. Y. , Mulholland , G. W. and Gritzo , L. A. 2000 . Measurement of Soot Optical Properties in the Near-Infrared Spectrum . Int. J. Heat Mass. Tran. , 43 : 3299 – 3303 .