Abstract
Ultrafine particle (UFP) monitoring over the size range of 10–500 nm has been ongoing in Rochester, New York, since November 2001. A nearby large coal-fired power plant (CFPP) was shut down in the spring of 2008 for conversion to natural gas combustion. This shutdown resulted in a reduction in observed concentrations of UFP number and other pollutants. In this study, positive matrix factorization (PMF) model and conditional probability function (CPF) were used to elicit the CFPP source information based on 2005–2010 hourly concentration data of particles and gaseous species and meteorological variables. Five factors were identified, i.e., nucleation, regional transport, traffic, CFPP, and O3-rich secondary aerosol that influenced the measured pollution levels. The average 10–50 nm, 50–100 nm, and 100–500 nm particle number concentrations decreased 49.8%, 51.9%, and 52.9% from 2007 to 2008, respectively. The annual average SO2, CO, and PM2.5 concentrations also decreased by 64.1%, 39.6%, and 45.6% from 2007 to 2008, respectively. The largest reductions of 10–50 nm particles, CO, and SO2 concentrations between 2007 and 2009 were observed with northerly winds. These changes were clearly attributed to the shutdown of the large CFPP in the study area.
1. INTRODUCTION
Coal-fired power plants (CFPPs) are known to be major anthropogenic sources of atmospheric particles in terms of number concentration through direct primary emissions and secondary aerosol formation. Substantial numbers of ultrafine particles (UFP, D p < 0.1 μm) have been detected in CFPP emissions (CitationHinkley et al. 2008; CitationLiu et al. 2010). CFPPs are also the largest source of SO2 emission in the United States [CitationUS EPA (US Environmental Protection Agency) 2003]. SO2 is an important marker for the CFPP contributions to air pollution levels (CitationWatson et al. 2001). Thus, CFPPs have large impacts on air quality (CitationWang et al. in press), human health (CitationJayasekher 2009), and potentially climate (CitationGaffney and Marley 2009).
UFP size distribution data started being collected in Rochester, New York (NY), from November 2001. These data represent the longest record of UFP number concentrations available in the United States. During January–April 2008, a large CFPP (260 MWe), located on the shores of Lake Ontario, ∼12 km north of the Rochester downtown area, was gradually shut down for conversion to natural gas. The other major SO2 emitter in the area, the Eastman Kodak complex, decreased its production and SO2 emissions have fallen during recent years (US EPA, http://camddataandmaps.epa.gov/gdm/). In this study, the impacts of the CFPP on UFP and other pollutants were quantified as a part of an extensive project assessing the contributions of CFPP and traffic to air quality in Rochester, NY, using the 8-year data record (CitationWang et al. in press).
2. EXPERIMENTAL
2.1. Sampling Site and Data Description
Measurements were performed in Rochester, NY, from January 2005 to July 2010. According to 2009 estimates, the population in Rochester is 207,294 (US Census Bureau, http://www.census.gov/), making it the third largest city in New York State. shows the locations of the sampling site, the major roadways and emission sources. The sampling site is operated by the New York State Department of Environmental Conservation (NYSDEC). It is adjacent to the intersection (∼300 m) of two major roadways (I-490 and I-590) as well as NY route 96, a major route carrying traffic to and from downtown Rochester.
FIG. 1 Map of the locations of the sampling site, the major roadways, and the emission sources in Rochester, NY.
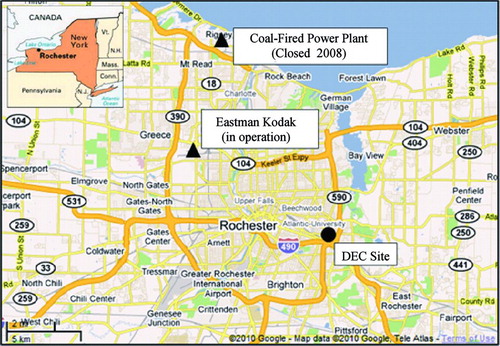
Table S1 in the online supplemental information summarizes the pollutants and instruments used in this study. The number concentrations were classified and summed into three size bins: 10–50 nm, 50–100 nm, and 100–500 nm. To minimize the instrument uncertainties, the lowest measured bin (<11 nm) and the highest bin (>470 nm) of original size distributions were excluded. Hourly averaging was done to adjust the particle number concentrations to the same time intervals as the other pollutants measured at the site by NYSDEC. Information about the CFPP emissions, traffic volume and composition, and data collection and validation has been discussed previously (CitationWang et al. in press).
2.2. Positive Matrix Factorization (PMF) and Conditional Probability Function (CPF)
PMF is a multivariate factor analysis tool that decomposes a matrix of data into two matrices—factor contributions and profiles. It has been comprehensively described by CitationPaatero and Tapper (1994) and CitationPaatero (1997). EPA PMF 4.1 was used in this study. This method is described in greater detail by Norris et al. (2008, 2010). Number concentrations of 10–50 nm, 50–100 nm, and 100–500 nm particles; PM2.5 mass concentrations, concentrations of CO, SO2, O3, and black carbon (BC) were included in the input matrix. The input data matrix includes 52,584 rows and 8 columns. All periods where there were missing data were excluded. The particle data measurement uncertainties were estimated from the equation below:
The source impacts from various wind directions can be analyzed by CPF. The method description is given by CitationKim et al. (2003). The sources are likely to be located in directions that have high conditional probability values. In this study, calm winds (<1 m/s) were excluded from the analysis because of the isotropic behavior of wind vane under calm winds. Wind sectors of 30° were used starting at 0°. A threshold criterion of the 75th percentile was selected. CPF analysis was performed using the resolved source concentration data.
3. RESULTS AND DISCUSSION
A range of factor numbers from 4 to 10 was examined. On the basis of the quality of fit as indicated by the scaled residuals distributions and the interpretability of the resulting profiles, five factors were identified, i.e., nucleation, regional transport, traffic, CFPP, and O3-rich secondary aerosol. The 2005–2010 temporal variations of all five factor contributions are shown in Figure S1. The annual, seasonal, and weekday/weekend variations of factor contributions are presented in Figure S2. Nucleation occurred more frequently during winter months corresponding to our previous findings (CitationJeong et al. 2004; CitationWang et al. in press). The O3-rich factor contributions were substantially higher during spring and summer than in the colder seasons. Regional transport and traffic were stronger on weekdays compared with weekends. The traffic factor contribution decreased continuously from 2007 to 2010, which may be due to the 2001 Highway Diesel Rule (http://www.epa.gov/otaq/regs/hd2007/frm/frdslreg.pdf). The regulation provided a “temporary compliance option” permitting up to 20% of the highway diesel produced to meet the 500 ppm sulfur limit though May 2010 provided the remaining 80% met the 15 ppm standard.
The percent contributions of each factor to the measured pollutants are shown in . Nucleation dominated 10–50 nm particles, while traffic dominated 50–500 nm particles. Heavy-duty diesel trucks can make a substantial number input above 100 nm (CitationOgulei et al. 2007). Regional transport contributed 84.8% and 57.4% to the PM2.5 and BC concentrations, respectively. The CFPP was responsible for 88.0% of the measured SO2 concentration. It also contributed 1.5%–6.8% of 10–500 nm particle number, CO, and PM2.5 concentrations. Figure S3 illustrates the diurnal variations of the contributions of the five variables between 2005 and 2010. The nucleation factor was found to rise between 6:00 and 7:00 that might represent nitrate nucleation (CitationZhou et al. 2005) just before sunrise. The morning event represents formation of UFP by the direct emissions of low volatility species rather than photochemical gas-to-particle conversion. (CitationJeong et al. 2004).
TABLE 1 Summary of the contribution percentage of each factor to the pollutants concentrations.
The diurnal profiles of regional transport and traffic factors were similar with early morning and early evening peaks. The BC and diurnal pattern suggested that regional transport was likely to have a traffic contribution. They both decreased gradually between 2005 and 2010. The O3-rich factor contributions were greater during daytime compared with nighttime. The CFPP factor showed large diurnal fluctuations. The 2005–2007 contributions exceeded those during 2008–2010. The minimum contribution was observed for the year 2010.
shows the annual variations of the CFPP factor contributions to the UFP and other pollutants. The factor profiles and contributions were scaled to the measured concentrations of each species (CitationKasumba et al. 2009). Particles in the 10–100 nm size range dominated the total particle number concentrations. On average, the number concentrations of particles in the three size bins before 2007 were higher than those after 2007. The average 10–50 nm, 50–100 nm, and 100–500 nm particle number concentrations decreased 49.8%, 51.9%, and 52.9% from 2007 to 2008, respectively. This trend was more pronounced for SO2 with a 2007–2008 concentration decrease of 64.1%. The 2006–2007 SO2 concentration increase of 32.8% was consistent with the CFPP SO2 emission inventory data (CitationWang et al. in press). Annual average CO and PM2.5 concentrations also decreased by 39.6% and 45.6% from 2007 to 2008, respectively. The mean concentrations of all the six species (10–50 nm, 50–100 nm, 100–500 nm particle number, CO, PM2.5 mass, and SO2) between 2007 and 2008 were actually significantly different based on the student's t-test results. These changes were all attributed to the shutdown of the CFPP and reductions in the Eastman Kodak industrial activity.
FIG. 2 Annual variations of contributions of the CFPP to UFP and other pollutants. Box-Whisker plot indicates median and 25/75% quartiles (boxes), mean (dash line), 10/90% quartiles (whiskers), and 5/95% quartiles (dots).
illustrates the directional pollutant contribution distributions of the CFPP factor observed in 2007 (solid line) and 2009 (dash line). The 10–50 nm particles, CO, and SO2 concentrations measured when the wind was from the northwest were generally greater compared to other wind directions in both 2007 and 2009. The greatest reduction between 2007 and 2009 was observed for northerly winds consistent with the effects of the shutdown of the CFPP. The ambient 10–50 nm particle, CO, and SO2 emissions came primarily from Eastman Kodak in 2009 (315° clockwise from the north 0°). Higher concentrations of 50–500 nm particles and PM2.5 were generally observed when the wind was from the southwest compared to other directions. It appears that CFPPs in western NY and the Ohio River Valley also influence pollution levels in the Upstate NY region (CitationWang et al., in press). The differences between 2007 and 2009 were greater when the wind was from the north. It further confirms the effect of the CFPP shutdown on the improvement of local air quality in terms of 50–100 nm particles and PM2.5 as well.
FIG. 3 Comparison of the directionalities of the CFPP factor contribution to the UFP and other pollutants. The black line represents 2007 data. The grey line represents 2009 data.
4. CONCLUSION
Five factors were identified as influencing air pollution levels using EPA PMF 4.1 with 2005–2010 hourly particle count, BC, PM2.5, and gaseous pollutant data measured at the monitoring site in Rochester, NY. They included nucleation, regional transport, traffic, CFPP, and O3-rich secondary aerosol. The CFPP factor was responsible for 88.0% of the measured SO2 concentration. It also contributed 1.5%–6.8% of 10–500 nm particle number, CO, and PM2.5 concentrations. The average 10–50 nm, 50–100 nm, and 100–500 nm particle number concentrations decreased 49.8%, 51.9%, and 52.9%, respectively, from 2007 to 2008. The annual average SO2, CO, and PM2.5 concentrations also decreased by 64.1%, 39.6%, and 45.6%, respectively, from 2007 to 2008. The greatest reductions of 10–50 nm particles, CO, and SO2 concentrations between 2007 and 2009 were observed with northerly winds, making the site downwind of the CFPP. These changes were clearly attributed to the shutdown of the large CFPP during the spring of 2008 in the study area.
uast_a_588730_sup_19137717.zip
Download Zip (165.7 KB)Acknowledgments
This work was supported by the New York State Energy Research and Development Authority (NYSERDA) through Contracts 8650 and 10604; the United States Environmental Protection Agency (US EPA) through Science to Achieve Results (STAR) grant RD83241501; a Syracuse Center of Excellence Collaborative Activities for Research and Technology Innovation (CARTI) project award, which is supported by a grant from the US EPA (Award No: X-83232501-0); and the Electric Power Research Institute under Agreement W06325. Although the research described in this article has been funded in part by the EPA, it has not been subjected to the Agency's required peer and policy review and, therefore, does not necessarily reflect the views of the Agency and no official endorsement should be inferred. The author also would like to thank Mr. Oliver V. Rattigan from the Division of Air Resources at the NYS Department of Environmental Conservation for providing black carbon data.
[Supplementary materials are available for this article. Go to the publisher's online edition of Aerosol Science and Technology to view the free supplementary files.]
REFERENCES
- Gaffney , J. S. and Marley , N. A. 2009) . The Impacts of Combustion Emissions on Air Quality and Climate—From Coal to Biofuels and Beyond . Atmos. Environ , 43 : 23 – 36 .
- Hinkley , J. T. , Bridgman , H. A. , Buhre , B. J. P. , Gupta , R. P. , Nelson , P. F. and Wall , T. F. (2008) . Semi-Quantitative Characterization of Ambient Ultrafine Particle Aerosols Resulting from Emissions of Coal Fired Power Stations . Sci. Total Environ , 391 : 104 – 113 .
- Jayasekher , T. 2009) . Aerosols Near by a Coal Fired Thermal Power Plant: Chemical Composition and Toxic Evaluation . Chemosphere , 75 : 1525 – 1530 .
- Jeong , C.-H. , Hopke , P. K. , Chalupa , D. C. and Utell , M. J. 2004) . Characteristics of Nucleation and Growth Events of Ultrafine Particles Measured in Rochester, NY . Environ. Sci. Technol , 38 : 1933 – 1940 .
- Kasumba , J. , Hopke , P. K. , Chalupa , D. C. and Utell , M. J. 2009) . Comparison of Sources of Submicron Particle Number Concentrations Measured at Two Sites in Rochester, NY . Sci. Total Environ , 407 : 5071 – 5084 .
- Kim , E. , Hopke , P. K. and Edgerton , E. S. 2003) . Source Identification of Atlanta Aerosol by Positive Matrix Factorization . J. Air Waste Manag. Assoc , 53 : 731 – 739 .
- Liu , X. , Wang , W. , Liu , H. , Geng , C. , Zhang , W. , Wang , H. and Liu , Z. 2010) . Number Size Distribution of Particles Emitted from Two Kinds of Typical Boilers in a Coal-Fired Power Plant in China . Energ. Fuel , 24 : 1677 – 1681 .
- Norris , G. , Vedantham , R. , Wade , K. , Brown , S. , Prouty , J. and Foley , C. 2008) . EPA Positive Matrix Factorization (PMF) 3.0 Fundamentals & User Guide. U.S. Environmental Protection Agency , Washington , DC : Office of Research and Development .
- Norris , G. , Vedantham , R. , Duvall , R. , Wade , K. , Brown , S. , Prouty , J. , Bai , S. , DeWinter , J. and Foley , C. 2010) . EPA Positive Matrix Factorization (PMF) 4.1 Fundamentals and User Guide , Washington , DC : Draft Version. U.S. Environmental Protection Agency, Office of Research and Development .
- Ogulei , D. , Hopke , P. K. , Ferro , A. R. and Jaques , P. A. 2007) . Factor Analysis of Submicron Particle Size Distributions Near a Major United States—Canada Trade Bridge . J. Air Waste Manage. Assoc , 57 : 190 – 203. .
- Paatero , P. 1997) . Least Squares Formulation of Robust Non-Negative Factor Analysis . Chemometr. Intell. Lab , 37 : 23 – 35 .
- Paatero , P. and Tapper , U. 1994) . Positive Matrix Factorization: A Non-Negative Factor Model with Optimal Utilization of Error Estimates of Data Values . Environmetrics , 5 : 111 – 126 .
- US EPA . 2003) . National Air Quality and Emissions Report Appendix A. http://www.epa.gov/air/airtrends/aqtrnd03/
- Wang , Y. , Hopke , P. K. , Chalupa , D. C. and Utell , M. J. Long-Term Study of Urban Ultrafine Particles and Other Pollutants . Atmos. Environ , doi:10.1016/j.atmosenv.2010.08.022 (in press)
- Watson , J. G. , Chow , J. C. and Houck , J. E. 2001) . PM2.5 Chemical Source Profiles for Vehicle Exhaust, Vegetative Burning, Geological Material, and Coal Burning in Northwestern Colorado During 1995 . Chemosphere , 43 : 1141 – 1151 .
- Zhou , L. , Kim , E. and Hopke , P.K. 2005) . Mining Airborne Particulate Size Distribution Data by Positive Matrix Factorization . J. Geophys. Res , 110 : D07S19 doi:10.1029/2004JD004707