Abstract
Contemporary near-real-time bioaerosol identifiers that read labeled DNA require a minimum DNA length of about 500,000 base pairs; and for critical applications, instrumental identification results must be verified through the use of classical microbiological culturing techniques. A 300 L/min Wetted Wall Cyclone (WWC) and an 800 L/min inertial impactor were used in a comparative study to collect aerosolized single cells of Escherichia coli (E. coli) at temperatures of 24°C and 46°C. Classical microbiological plating techniques showed that the culturability of E. coli collected with a WWC is a factor of about 100 higher than that of the impactor when the sampled aerosol is at room temperature (RT) and a factor of about 4000 higher when the sampled aerosol is at 46°C. DNA integrity was qualitatively evaluated with pulsed field gel electrophoresis (PFGE) and photographic evidence shows a significant difference in the amount of high molecular weight DNA (molecules larger than 500,000 base pairs) collected with the WWC compared with the impactor. Extracted DNA was also digested by the NotI enzyme, and the qualitative results of the restriction analysis showed there to be high integrity of the WWC-collected DNA, whereas the impactor-collected DNA showed considerable fragmentation. Real-Time polymerase chain reaction (RT-PCR) showed samples required for E. coli identification need to be about 100 times more concentrated if they are collected with the impactor rather than that of the WWC. Also, it appears that only the intact genomic DNA of the culturable cells provides adequate templates for traditional and RT-PCR amplification.
Copyright 2012 American Association for Aerosol Research
INTRODUCTION
Identification and enumeration of airborne bacteria can be accomplished with classical microbiological techniques, where the particulate matter in a sample of air is collected on, or in a suitable media, and the resulting sample is subsequently subjected to laboratory analyses including a determination of the number of culturable organisms. Recently, there has been emphasis placed on DNA analysis of microbial samples to provide near-real-time alerts for the presence of pathogenic organisms (Gluodenis and Harrison Citation2004; U.S. NRC Citation2005). At the present time, for reliable detection, the DNA identifiers require molecules with lengths that are greater than about 500 kb (500,000 base pairs, which refers to the pairs of nitrogenous bases that connect the complementary strands of DNA). As a reference, the genomic size of intact DNA in Escherichia coli K-12 (E. coli), which is similar to the strain used in this study, is about 4.6 Mb. Molecules shorter than about 500 kb present a challenge to a DNA identifier because double-strand breaks and other forms of DNA damage can block the extension step of DNA amplification (Zhou et al. Citation2008). Another concern when working with degraded DNA is that polymerization-induced errors, i.e., incorporation of incorrect nucleotides by the polymerases, may occur more frequently (Pääbo et al. Citation1990; Eckert and Kunkel Citation1991).
DNA can be preserved for extended periods, as demonstrated by its recovery from ancient specimens. Conversely, rapid DNA lysis in bacteria has been detected due to shear degradation during aerosol formation, impaction on solid surfaces, and as a result of oxidative and hydrolytic damage from storage at elevated temperatures or in damp and biologically active environments (Pääbo Citation1989). Although, Cha and Tilly (Citation1993) indicate that the shearing of genomic DNA during DNA extraction does not affect the efficiency of polymerase chain reaction (PCR) analysis, and in some cases, it is even suggested to perform rare restriction enzyme digestion of genomic DNA before PCR to increase the yield. However, their studies were performed with mammalian genomes, which are ∼3 × 10⁹ bp or about 1000× larger than the E. coli genome. As the efficiency of PCR is greater for smaller size target template DNA (e.g., previously amplified product, plasmids) than for the high molecular weight, intact complex eukaryotic genome, it may be useful to apply a rare restriction digest at directed DNA sites, provided that the target sequence remains intact (Cheng et al. Citation1995). But, random shearing may damage the target DNA, hindering the primer attachment and resulting in zero amplification, especially when larger amplicons (>1000 bp) are targeted, where amplicons are pieces of DNA formed during an amplification process. The presence of large fragments indicates relatively low levels of DNA damage (Golenberg et al. Citation1996).
Currently, and for the foreseeable future, any alarm from a DNA identification system used for the detection of pathogenic organisms, e.g., biowarfare agents, should be verified by highly reliable classical microbiological analyses, so sampling systems for DNA-based bioaerosol detection should also provide a capability to maintain the culturability of subsamples of the collected organisms (Titball and Pearson Citation1993).
During collection, the bacteria are exposed to stresses that can affect the viability and culturability of cells, and possibly the intactness of their DNA. The response of bacteria to different types of unfavorable environmental conditions, such as desiccation (osmotic stress) and thermal stress, has been studied extensively (Cox Citation1970; Walter et al. Citation1990; Branda et al. Citation2001). Mechanical stresses also affect the viability of bacteria. Stewart et al. (Citation1995) noted that impaction of Pseudomonas fluorescens bacteria against an agar surface at a speed of 40 m/s rendered 49% of the organisms nonculturable. When exposed to mechanical stresses, E. coli, which is often used as a surrogate in aerosol studies for fragile pathogenic vegetative cells, can protect itself by gating its ion channels (Zobell and Cobet Citation1962). Berrier et al. (Citation1996) concluded that mechanical forces exerted on cell membranes gate mechanosensitive ion channels in the inner membrane fraction of E. coli.
Preferring a relatively high 37°C environment for growth, E. coli cells may withstand temperatures up to 50°C (Niven Citation2004). However, when the cells are in the exponential growth phase,Footnote 1 extended exposure to elevated temperatures can result in impaired growth of the organisms or even degradation of viability as a result of thermal stress. Kaur et al. (Citation1998) noted that of several factors, which can affect the heat resistance of E. coli at temperatures of 55°C and 60°C, growth phase has a marked impact with log phase cells being less heat resistant than those of a later stationary phase.
Bacteria are often subjected to desiccation so a high tolerance to osmotic stress is required for survival. During aerosolization, due to desiccation, or during residence in liquids with a high salt content, E. coli can maintain its membrane potential against high osmotic pressure for longer periods by releasing water through its membrane channels. However, inertial impaction and collection in fluids with unfavorable ionic or glycerol contents could result in ruptured cell membranes and consequently in the leakage and ultimately in the degradation of DNA. The collection fluid used in some types of bioaerosol samplers may contain glycerol (Willeke et al. Citation1998), and surfactants, e.g., Tween-20 or Triton X-100 (White et al. Citation1975; Schafer et al. Citation1999) that could induce osmotic stress.
An inertial impactor, which was used in this study, has a polyurethane foam collection surface that is coated with ethylene glycol. Jenkins and Sherburn (Citation2005) showed that Staphylococcus aureus (S. aureus) bacteria have a good survival capability on polyurethane foam even at low relative humidity, where they related S. aureus to a possible increased risk of sudden infant death syndrome (SIDS) associated with polyurethane foam infant mattresses. Preferential survival of bacteria occurs in cell clusters residing on surfaces as some of the cells are more protected and thereby more capable of tolerating environmental stresses (Monier and Lindow Citation2003). According to recent studies, Bacillus organisms respond to multiple stresses through the coordinated action of stressosome, a supramolecular complex comprising multiple copies of the regulator of sigma B proteins (Marles–Wright et al. Citation2008).
The purpose of this study is to compare the performance of two aerosol collectors (an impactor and a Wetted Wall Cyclone [WWC]) in maintaining the culturability and DNA intactness of E. coli. The culturability of E. coli was quantified through use of classical microbiological plating techniques. Qualitative analyses were performed on DNA extracted from collected aerosol samples to examine the relative amounts of DNA with fragment lengths ≥500 kb. A pulsed-field gel electrophoresis (PFGE) device and associated DNA ladder were used to provide information on relative amounts of sufficiently sized DNA. The bacterial DNA isolated from the collected samples was also quantified in a real-time polymerase chain reaction (RT-PCR) thermocycler using specific oligonucleotide sequences to verify whether sufficient amounts of intact DNA are present for diagnostic purposes.
SAMPLING DEVICES
With reference to , the impactor used in this study has a flow rate of 800 L/min wherein aerosol from three parallel rectangular slots was impacted onto polyurethane foam (50 pores/inch) collection surfaces that were coated with ethylene glycol. At the completion of a test, collected particles were washed from the polyurethane foam. On the basis of slot width and an impaction velocity of 40 m/s, the calculated cutpoint of the impactor (Hinds Citation1999) is about 1 μm AD, where the cutpoint is defined as the particle size for which the collection efficiency is 50%. The use of a foam substrate will further reduce the cutpoint as demonstrated by Kavouras and Koutrakis (Citation2001), who observed a shift in cutpoint from 2.48 to 1.12 μm when 50 pores/inch polyurethane foam, rather than a flat solid surface, was used for particle collection in a round jet impactor. Their results also show that the collection efficiency asymptotically approaches ∼100% for large particle sizes.
FIG. 1 Test devices: (a) 800 L/min impactor. (b) 300 L/min Wetted Wall Cyclone (WWC).
The second bioaerosol collection system used in this study was a 300 L/min WWC, , which has a tangential entrance and an axial exhaust, and continuously collects particles onto a flowing liquid film (Hu and McFarland Citation2007; McFarland et al. Citation2010). The air entering the cyclone has a velocity of 35 m/s in the inlet slot, and the cyclone cutpoint is 1.2 μm AD. Although the airspeed in the slot is 35 m/s, it accelerates upon entering the cyclone to a speed of about 50 m/s, which is higher than the jet speed of the inertial impactor; however, the aerosol particles in the WWC are impacted tangentially against the wall rather than normally as is the case in the inertial impactor. The tangential impaction presents less mechanical stress to cells. Liquid from the collection zone of the WWC coalesces into rivulets and droplets, which are continuously transported by air shear through the cyclone body. The droplets and rivulets are skimmed from the airflow and aspirated out of the cyclone. The cyclone directly concentrates bioparticles from large volumes of air into small volumes of liquid in contrast with the impactor method where the concentration process is comprised of two discrete steps, i.e., collection and washing.
For comparative purposes, we also conducted limited tests to determine the culturability retention of E. coli collected on 47 mm A/E glass fiber filters. Air sampling filters are often used for the collection of bacteria for retrospective analyses, including viability analyses (CIDRAP Citation2003; CRS Citation2003). If hardy organisms such as spores are used as the test aerosol, samples collected with filters are sometimes employed to provide reference data to calculate the aerosol collection efficiency of other bioaerosol sampling devices (Lin and Li Citation1998). When the organisms are collected on sampling filters, they are not subjected to high inertial forces, as the sampling velocity is on the order of 1 m/s, but, after collection they are subjected to a continuous flow of air, which can cause desiccation, oxygen stress (Cox Citation1976), and perhaps cause enhanced exposure to an unfavorable chemical environment. Therefore, the dry filter is not useful for situations where the samples, especially fragile vegetative bacteria, need to be evaluated by culturing.
METHODS
Bioaerosol Particle Preparation and Delivery
FIG. 2 Setup for testing the WWC, impactor and filter sampler with bioaerosols. During testing with the E. coli particles, the WWC or the impactor or the filter was used to sample the bioaerosol.
The aerosol used in the testing was comprised of single bacterium cells that were generated with a Collison atomizer (BGI Inc., Waltham, MA). The mid-log phase (OD600Footnote 2 = 0.5) fresh cultures of E. coli K-12 MG1655 (E. coli Genetic Resources at Yale CGSC, The Coli Genetic Stock Center, New Haven, NE) were grown in Luria Bertani (LB) medium (Sambrook et al. Citation1989) for about 3 h at 37°C with constant shaking at 0.102 g's. (E. coli is a facultative anaerobic bacterium, requiring oxygen during fermentation). The mid-log cells are uniform in age, size, and physiological characteristics, which allow them to respond more uniformly to the different stresses during aerosolization and collection. They were harvested by pelletizing them in a centrifuge at 2880 g's for 7 min and resuspending them in 10× dilution in milli-Q (MQ) water that contained 10% phosphate buffer saline with 0.1% Triton X-100 surfactant (PBST) and had a pH of 7.4. For each sample, 3.0 mL of 1× PBST was added to 27 mL of the E. coli stock suspension in water in the atomizer to provide a final concentration of 0.1× PBST. All of the reagents and buffers used in the study, including ethylene glycol for the impactor, were autoclaved to eliminate DNase contamination. The cells, in 30 mL batches, were aerosolized with a 6-jet Collison atomizer operated at 140 kPa (20 psi), which provides an aerosol output of 12 L/min. On the basis of the concentration of E. coli in the suspension and the atomization rate, approximately 460,000 viable cells were generated during any 10-min test period.
The size of the resulting aerosol particles, determined with an aerodynamic particle sizer (APS, Model 3321, TSI Inc., Shoreview, MN), was approximately 1 μm aerodynamic diameter (AD). Check tests of the aerosol produced by the atomizer from the salt solution with no E. coli particles showed about 7% of the counts observed with the E. coli particles present. Also, mass median size of the particles produced by the salt solution was 0.95 μm AD, and that of the salt solution with E. coli was 1.05 μm, which implies that the presence of the salt did not cause a major shift in output aerosol median size.
Sampling Methodology
The bioaerosols were delivered to the impactor, the WWC, or glass fiber filters through a 200 mm (8 inch) diameter tube, . In these experiments, all of the generated bacteria were drawn into the sampler being tested, so during testing, each sampler ingested the same number of organisms. Sampling the same number of 1.05 μm AD aerosol particles with the WWC, which has a cutpoint ∼1 μm, and with the impactor, which should have a cutpoint somewhat less than 1 μm, implies the impactor should collect more aerosol particles than the WWC. Also, because the filter has essentially unity collection efficiency for single cells of bacteria, it should collect more cells than either the WWC or impactor.
The tests were performed at room temperature (RT, 24°C) and at 50°C (at the location of the atomizer, which provided temperatures of 46°C–48°C at the impactor inlet, 46°C at the WWC intake, and 44°C at the filter inlet; ). The elevated temperatures were generated by the use of a heat gun placed upstream of the mixer, and those temperatures will be reported herein as a nominal value of 46°C at the collector location. Tests were carried out with the sampling systems placed in a BSL-2 biosafety cabinet (Model NU-425, NUAIRE, Plymouth, MN), where the cabinet was operated with a constant inflow of laboratory air at RT.
During the operation with heated air, bacteria collected by the filter were subjected to the temperature of the heated air stream for the remainder of a test. Bacteria collected by the impactor were subjected to the collection surface temperature for the remainder of a test, and bacteria collected by a WWC were subjected to the collector wall temperature for the period of time that was required for the hydrosol to pass through the cyclone body, which is on the order of 1 min (Hubbard et al. Citation2011). The tests were conducted with the impactor and WWC initially at RT, so during the test period, the collection foam of the impactor would tend to approach the temperature of the heated air whereas the large thermal mass and external heat transfer of the WWC would tend to prevent a substantial rise in the temperature of the cyclone wall. As a consequence, the thermal stresses to which collected bacteria were subjected were least for the WWC and most for the filter collector.
The aerosol was generated with the atomizer for 10 min using a fresh bacterial suspension for each test. Three time-sequence procedures were used in testing the impactor. For the first type of test, the impactor was operated simultaneously with the atomizer during the 10-min aerosol generation period and then operation of both devices was stopped. The foam was removed from the impactor and the bacteria washed from the foam. The second and third types of tests involved operating the impactor, but not the atomizer, for additional periods of 50 min and 110 min.
The foam collection surface of the impactor was treated with a 30% aqueous solution of ethylene glycol prior to each test, and subsequent to operation the bacteria were recovered with two sequential washes using a 5 mM Tris(hydroxymethyl)amino- methane buffer (Tris, Mallinckrodt Baker Inc., Philipsburg, NJ), having a pH of 8 and containing 0.01% Tween-80® surfactant plus 50 mM of ethylene diamine tetraacetic acid (EDTA) chelating agent to inhibit nuclease activity.
The effectiveness of the wash procedure was checked by placing 100 μl of a suspension of Bacillus atrophaeus (BG) spores on a foam substrate, allowing the added liquid to evaporate, and then washing the foam to recover the BG spores. We used BG as the test organism because the spores are approximately the same size as E. coli cells; and, they are much less susceptible to degradation of culturability induced by osmotic stresses (Hecker and Völker Citation2001). The fraction recovered was calculated as the ratio of the number of BG spores cultured from two washes of a foam substrate to the number that had been added. On the basis of triplicate tests, the results showed the fraction recovered was 90% ± 4% (mean ± 1 standard deviation). The fraction recovered in the first wash was 87.7% and that recovered in the second wash was 2.2%. Data from experiments involving extraction of cells from the foam were adjusted through the use of a recovery fraction of 90%.
The WWC was operated with a 0.01% solution of Tween-20® in water as the collection liquid, and it was allowed to run for an additional 2 min after the atomizer was turned off to complete the biohydrosol particle removal process. The amount of collection fluid recovered from the WWC was weighed at the end of each test.
The 47 mm glass fiber filters (Type A/E, Pall Corp., Ann Arbor, MI) were operated at 100 L/min for the 10-min sampling period. The collected bacteria were resuspended by vigorously vortexing the filters in 5 mL PBST solution.
The culturable counts of the liquid samples drawn from the collectors were determined by plating 100 μL volumes in appropriate dilutions on Difco Tryptic Soy Agar (TSA) Petri dishes (Becton Dickinson Co., Sparks, MD), incubating the plates overnight at 37°C, and counting the resulting colony forming units (CFU) on the plates.
DNA Evaluations
Pulsed-Field Gel Electrophoresis of Samples
The purpose of this set of experiments was to obtain DNA band images of samples to enable qualitative comparison of material collected with the impactor and the WWC. For DNA plug preparation, cells collected with the impactor and the WWC were pelletized at 4500 g's for 10 min. All of a collected sample was used to demonstrate the sheared and intact DNA (Smith et al. Citation1988). Plugs were prepared for PFGE according to the method of Sobral and Atherly (Citation1989) and the Bio-Rad manual for CHEF-DR II PFES (Bio-Rad Citation1992).
The plugs to be restricted (DNA enzymatically cut at specific sites) were washed for 30 min in restriction buffer NEB no. 3 (New England Biolabs [NEB], Ipswich, MA) and digested with 30 units of NotI (NEB), a rare-cutter restriction enzyme with an 8-base recognition sequence that occurs only rarely in a genome (NotI cuts after the first GCFootnote 3 of a 5′…GC'GGCCGC…3′ sequence) (Ventra and Weiss Citation1989). The restriction digest was continued for 2 h at 37°C, the plugs were washed, and maintained in 1× wash buffer (Flanagan et al. Citation1989).
The DNA plugs were inserted in the wells of 1% pulsed field certified agarose gel and run for 44 h in 1× TAE (Tris-Acetic acid-EDTA) buffer at 3 V/mm, 14°C, with initial and final switch times of 200 and 1800 s, as recommended by the Bio-Rad manual for the electrophoresis of DNA in the genomic size ranges (2–4 Mb). A Saccharomyces cerevisiae (S. cerevisiae) marker [2,200–225 kb (kilo base pairs)] was used as a DNA size reference. The DNA plugs, which had been digested with the NotI restriction enzyme, were separated together with a Lambda ladder PFG marker (NEB), which has fragments from 48.5 to 1018.5 kb, with each successive band differing in size by approximately 49 kb. The ladder has at least 20 bands of the lambda concatemers that are multiple copies of the same bacteriophage lambda DNA sequences arranged end-to-end in tandem series. The separation was implemented in 1% agarose gel for 22 h at 14°C in 0.5× TBE buffer using a 6 V/mm gradient with 50 and 90 s initial and final switch times. After the electrophoresis was complete, the DNA was stained by gently rocking the gel for 30 min in a 1× TBE bath containing 0.5 μg/mL ethidium bromide (Sigma, St. Louis, MO) and the fluorescence of the ethidium bromide was visualized under ultraviolet (UV) light. The images were recorded with a computer-operated camera (AlphaImager, Alpha Innotech Corp., San Leandro, CA). An example is shown in Lane 1 of , which has the S. cerevisiae marker and where the 500 kb DNA molecular size may be noted. During electrophoresis of the undigested samples, the large intact genomic DNA molecules (∼4.6 Mb) do not travel very far and stay in or near the well, which is the darkened band at the top of the lanes. The more mobile, smaller DNA fragments travel further in the downward direction in .
Classical PCR Diagnostics
PCR amplification is a widely used technology that detects a certain gene, or part of a gene, in the DNA template by amplifying the relevant fragment using the thermostable Taq polymerase enzyme and specific DNA probes that recognize and bind only to that specific DNA sequence. The integrity of the genomic DNA template is essential for reproducible amplification of fragments with sizes >1.3 kb (Deagle et al. Citation2006). With increasing target size, there is an increasing likelihood that the handling of the DNA will have rendered a template strand unusable by randomly introducing a single-stranded nick or double-stranded break within the target sequence. Therefore, it is crucial to maintain the intactness of the genomic DNA during the collection and isolation process (Cheng et al. Citation1995).
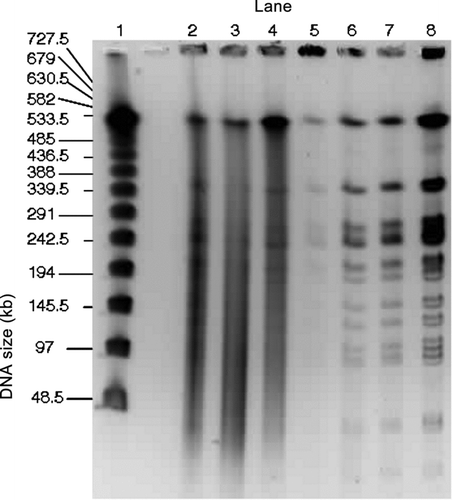
FIG. 3 PFGE gel image of E. coli genomic DNA collected by the impactor and the WWC from air at room temperature. Darkness of the wells at the top of each lane is an indication of the amount of relatively intact DNA. Impactor sampled air for different time periods. Lanes 1 and 2: Impactor 10 min collection during aerosolization period (for all the impactor samples, odd numbered lanes show the first wash and even numbered lanes the second wash). Lanes 3 and 4: Impactor, 10 min collection with 50 min additional operation. Lanes 5 and 6: Impactor, 10 min collection with 110 min additional operation. Lane 7: S. cerevisiae marker. Lanes 8 through 11: WWC collector hydrosol sample, 10 min collection during aerosolization period with 2 min additional operation for flushing. Lane 12: E. coli stock suspension.
In this study, the PCR reaction was performed using the concentrated E. coli samples from the impactor and the WWC collector as templates to verify whether sufficient amounts of intact DNA are present in the samples for diagnostic purposes. This was accomplished by amplifying the 1.375 kb recA target sequence (the recA gene is encoding a 38 kilodalton E. coli protein essential for the repair and maintenance of DNA, Sancar et al. Citation1980), with oligonucleotide sequences (primers) that bind specifically to the target sequence.
Because PCR could be inhibited by the presence of high concentrations of EDTA (Huggett et al. Citation2008) in the impactor substrate wash liquid, a procedure was used to reduce the EDTA content. The cells from 1/4 of each sample were microcentrifuged (Model 5417, Eppendorf NA, Brinkmann Instruments, Westbury, NY) at 10,000 g's for 8 min and the sediment suspended in 50 μL of sterile MQ water. The resuspended cells were then lysed at 95°C for 10 min (Ganguly et al. Citation2005), the lysates collected by microcentrifuging the cell debris at 117 g's for 2 min, and aliquots of the supernatant were used as DNA templates. This procedure also concentrated the DNA, which aided the PCR analysis.
The PCR reaction was set up following the guidelines of Liang and Johnson (Citation1988) and Sambrook et al. (Citation1989). The reaction mixture (25 μL total) contained the DNA template (5 μL), the forward and reverse recA primers (100 mM, 1 μL each), 100 mM deoxyribonucleotide triphosphate (dNTP) mix (1 μL, Promega Corp., Madison, WI), 10× PCR buffer (2.5 μL, Promega), and Taq polymerase (1 μL, Promega). The recA primers M761 (5′- CAC CGT CTG GTA AGC TTT TGC CAC TG) and M762 (5′- CGA CGG GAT GTG AAT TCT GTC ATG G) (Integrated DNA Technologies, Inc., Coralville, IA) were used to amplify the 1.375 kb fragment. The amplification process consisted of a 94°C initial denaturing step (5 min), 30 cycles (94°C for 0.5 min, 53°C for 0.5 min, and 72°C for 2 min), and a final extension at 72°C for 7 min.
To verify whether a single product of the correct size was formed, the PCR products were analyzed with gel electrophoresis, where they were separated on a 1% agarose gel in 1× TAE (Tris-acetate-EDTA) buffer at 100 V. The bands in different lanes that ended up at the same distance from the top, containing molecules of approximately the same size, were compared with distances traveled by molecules in a 1 kb ladder (NEB, Ipswich, MA), which contains digested DNA fragments with known sizes ranging 0.5–10.0 kb. The gels were stained with ethidium bromide, visualized with UV light, and photographed with the AlphaImager camera.
Quantification of Intact DNA by Real-Time PCR (RT-PCR)
RT-PCR, which combines a thermal cycler and an optical module (VanGuilder et al. Citation2008), has been increasingly applied for the fast quantification and specific identification of microorganisms (An et al. Citation2006). At the end of each PCR cycle, the optical module measures the fluorescence intensity of each reaction, which is generated by the fluorescent dye Sybrgreen (SYBR, Applied Biosystems, Warrington, UK), intercalating with the double-stranded DNA (O’Mahony and Hill Citation2002; Stetzenbach et al. Citation2004). The dye only fluoresces when bound to the dsDNA (i.e., the PCR product). The data analysis software of the RT-PCR system calculates a threshold based on the background fluorescence, and determines the cycle number Ct at which the fluorescence in the sample exceeds the threshold.
For tests with RT-PCR, aerosol was generated with the Collison atomizer and collected with the WWC and impactor as was done in the other experiments; however, in this case more concentrated hydrosol suspensions were used in the Collison atomizer that increased the bioaerosol concentration by a factor of about 4×. Tests were only conducted at RT.
Again, because of concern that EDTA in the impactor samples could interfere with the PCR analyses, special procedures were used where the cells were pelletized and resuspended in 1×, 2×, 10×, and 100× dilutions of the original concentration. The E. coli bacteria were lysed by heating 1 mL aliquots of the diluted samples in 1.5 mL Eppendorf tubes for 10 min at 95°C. Placing the tubes on ice for 5 min quickly chilled the suspensions, and the cell debris was sedimented by microcentrifuging at 117 g's for 2 min. Aliquots (2 μL) of the supernatants in appropriate dilutions were added as the DNA template to the PCR reaction mixture. The reaction mixture contained 5 μL of 2× Power SYBR Green PCR Master Mix (Applied Biosystems, Warrington, UK), 2 μL of the hydrosol sample supernatant, 1 μL of sterile DNA-free milli-Q water, 1 μL of the universal 16S forward 1048 (5′-GTGSTGCAYGGYTGTCGTCA), and 1 μL of the reverse 1194 (5′-ACGTCRTCCMCACCTTCCTC) primers to amplify a 146 bp fragment. The thermocycling program of the AB StepOne RT-PCR System (AB, Foster City, CA) consisted of an initial cycle of 95°C for 10 min followed by 40 cycles at 95°C for 15 s and 60°C for 60 s. After the PCR process was completed, a dissociation curve (melting curve) was constructed for the range 60°C–95°C to detect any nonspecific amplification, including primer–dimer induced positive results. The dissociation of the DNA strands during heating would be indicated by a large reduction in fluorescence at a specific temperature (melting point).
FIG. 4 PFGE gel images of E. coli genomic DNA collected by the impactor and the WWC collector from air at a temperature of 46°C. Darkness of the wells is an indication of the amount of relatively intact DNA in each lane. Lane 1: S. cerevisiae marker. Lanes 2 and 3: Impactor, 10 min collection during aerosolization period (for all the impactor samples, even numbered lanes are the first wash and odd numbered lanes the second wash). Lanes 4 and 5: Impactor, 10 min collection with 50 min additional operation. Lanes 6 and 7: Impactor, 10 min collection with 110 min additional operation. Lanes 8–11: WWC collector hydrosol sample, 10 min collection during aerosolization period with 2 min additional operation for flushing. Lane 12: E. coli stock suspension.
With respect to a quantification of the DNA, the threshold value, Ct, is dependent on the amount of genomic DNA in a sample, which in turn is proportional to the number of cells in the sample. The functional form is that Ct is linearly related to the logarithm of microorganism concentration in the sample (An et al. Citation2006), with higher values of Ct associated with smaller values of concentration.
Appropriate dilutions of the E. coli stock suspension were used to create a standard calibration curve (). The mid-log phase E. coli stock suspension contained fresh cells that had not been exposed to sampling stress, and on the basis of the LIVE/DEAD® BacLight™ Bacterial Viability Kit (Invitrogen Molecular Probes, Carlsbad, CA) staining results of the stock suspensions, the number of culturable cells was directly proportional to the total number of cells in a ratio of least 90%. Each test or calibration data point showing the relationship of Ct as a function of microorganism concentration was based on three replicate tests. The least squares best fit for the calibration curve is:
RESULTS
Culturability of E. coli
shows culturability retention results, in terms of CFU, for the E. coli samples collected with glass fiber filters, the inertial impactor, and the WWC. Each sampler ingested the entire output of the aerosol generator and the generator output was approximately constant (a fresh suspension containing approximately the same number of E. coli cells for each test condition), so the samplers ingested approximately the same number of organisms (460,000). The WWC collector provided total viable counts >300,000 CFU, both at RT and also at 46°C , suggesting that the WWC can even sample hot air and not induce significant culturability losses in a bioaerosol. The total CFU counts from the use of the impactor sampler, which has the ethylene glycol coated polyurethane foam collection surface, were a factor of about 2 logs less than the WWC at RT and a factor of about 3 logs less at 46°C. More specifically, these data show that if the impactor and the WWC were to ingest the same number of E. coli cells in the aerosol state at RT, the WWC would provide 100 times as many culturable organisms as the impactor; and, if the sampled air were at 46°C the WWC would provide about 4000 times as many culturable organisms.
TABLE 1 Total CFU counts for samples collected with a 47 mm glass fiber filter, an impactor with an ethylene glycol-coated polyurethane foam collection surface, and a WWC. Each device ingested all of the aerosol output from the Collison atomizer. Tests were conducted with the sampled air at RT (24°C) and at an elevated temperature. The samples were collected during a 10 min aerosolization period, but the WWC was run for two additional min to allow bacteria to be flushed from the unit
To determine if the presence of ethylene glycol would significantly degrade the culturability of the as-collected samples, we performed experiments with the 300 L/min WWC using 30% ethylene glycol for the collection of vegetative E. coli cells. About 30% more culturable cells were detected in 30% ethylene glycol as compared with samples collected in 0.01% Tween-20, which suggests that ethylene glycol per se may not be the principal factor in causing the degradation of E. coli culturability.
The results for the filter show the number of viable E. coli cells recovered from A/E glass fiber filters at RT is about 4300 CFU, which is about 80 times less than that recovered from the WWC liquid effluent even though the filter should have a higher collection efficiency than the WWC for the 1 μm particles. No culturable cells were detected in the filter samples collected at 46°C. It is likely that most of the E. coli bacteria lost culturability after collection on the filter due to desiccation and oxygen stresses that are enhanced by the moving airstream.
The coefficients of variation (ratios of means to standard deviations) of the results are also given in . It may be noted that the data scatter, as indicated by the coefficients of variation (on the order of unity), is small as compared with ratios of the mean CFU values for the different sampling scenarios.
DNA Intactness
Images from qualitative DNA integrity tests for the samples collected from air at RT and 46°C are shown in and , respectively. The sample sources are distinguished by lane numbers shown at the top of an image and DNA sizes are shown on the left sides of the diagrams. Because approximately the same number of cells was sampled in each test, the darkness of the wells at the top of a lane is an indication of amount of relatively intact DNA.
Pulsed-Field Gel Electrophoresis Tests of E. Coli DNA Degradation
shows images for impactor samples in Lanes 1–6, with the odd-numbered lanes for the first wash of a sample, and the even-numbered lanes for the second wash. Lanes 1 and 2 are from the 10-min sample, Lanes 3 and 4 are from a 10-min sample with 50 min of additional operation, and Lanes 5 and 6 are from a 10-min sampled followed by 110 min of additional operation. The S. cerevisiae marker (225–2200 kb) is provided in Lane 7 and the E. coli stock suspension is shown in Lane 12. Lanes 8–11 show qualitative results for 4 replicate WWC samples, where 10-min samples were collected with each followed by a 2-min wash period.
The PFGE conditions were selected for the analysis of the intact genomic DNA but these conditions were not optimal for the separation of the S. cerevisiae marker fragments, which resulted in compressed bands. Nevertheless, the image shows the presence of molecules within the cited range for the marker of 225–2200 kb.
The impactor samples (Lanes 1–6), particularly Lanes 3 and 5 show DNA degradation resulting in fragments <500 kb. The WWC collector replicate samples show intense, intact bands of high molecular weight consistent with intact chromosomal DNA (wells of Lanes 8–11) similar to the DNA extracted from the E. coli stock suspension (Lane 12), and a low amount of background (faint traces in the lanes) perhaps due to the presence of contaminants, e.g., proteins from E. coli. Clearly, the images for the wells of the WWC samples (Lanes 8–11) are darker than those for the impactor (Lanes 1–6), which indicates that there to be more high quality DNA in the WWC samples. Operation of the impactor for additional times of 50 and 110 min after the aerosol generation period did not appear to cause significant further DNA degradation.
Sharper images were obtained for tests involving sampling 46°C air, . In , the S. cerevisiae marker is shown in Lane 1 and the E. coli stock is shown in Lane 12. The impactor samples (Lanes 2–7, with the even-numbered lanes for first washes and the odd for second washes) show pronounced degradation with DNA fragments <500 kb. The samples from the 300 L/min WWC show high amounts of high molecular weight DNA, consistent with intact chromosomal DNA (wells of Lanes 8–11), similar to the E. coli stock sample (Lane 12) and also to the RT samples. The amount of high molecular weight DNA for impactor-collected samples is considerably less than that of the WWC samples. Operation of the impactor for additional times beyond the aerosol generation period does not appear to cause further DNA degradation.
A comparison of the residual material in the wells from tests where the impactor-sampled aerosol at RT () and at 46°C () shows considerably less material at the higher temperature. In contrast, differences of material in the wells for the WWC tests at the two temperatures cannot be distinguished from the images.
FIG. 5 PFGE gel image of the separation of the E. coli genomic DNA collected at RT and digested with NotI. Samples are from the impactor (Lanes 2 and 4), the WWC (Lanes 5 and 7), and the E. coli stock suspension (Lane 8). Lambda ladder samples (Lane 1) are shown for comparison. The three impactor samples are replicates that were collected over 10 min periods and combined the first and second washes. The three WWC samples are replicates that were collected over 10 min sampling periods followed by 2 min rinses. (Courtesy of Emilia Mollova, US Genomics).
Qualitative Results of DNA Intactness with PFGE Using NotI Restriction Digest
The results of tests with NotI restriction on E. coli samples collected at RT are shown in . For comparison, a lambda ladder PFG marker with bands of the lambda DNA concatemers is shown in Lane 1, and the E. coli stock suspension is shown in Lane 8. Ideally, the NotI restriction process would result in well-defined DNA segment lengths as illustrated in Lane 8; however, the DNA of the E. coli collected with the impactor (Lanes 2–4) shows smeared lanes for three consecutive samples indicating the presence of degraded DNA fragments rather than just the segments cut with the NotI restriction digest. These three samples were collected in consecutive 10-min sampling periods, and each contained the material obtained from the two washes. In contrast to the impactor samples, those from the WWC (Lanes 5–7) provide intense and intact bands that are quite similar to those of the E. coli stock suspension. The WWC samples represent three consecutive collections followed by 2-min rinses, which should provide the same number of collected bacteria; however, there are differences in image intensity, e.g., Lane 5, where incomplete restriction digest may have resulted in fewer bands and more intact DNA in the well.
Quantification with Real-Time PCR (RT-PCR) and Qualitative Results from Classical PCR Diagnostics
shows the RT-PCR results for the impactor and WWC samples, where lower values of Ct indicate greater amounts of useful DNA. For these tests, the impactor and the WWC sampled the same number of cells, with the aerosol at RT. The impactor and WWC samples were added to the PCR reaction mixtures in 1×, 2×, 10×, and 100× dilutions of the initial suspensions (equivalent amount of liquid as that either exhausted from the WWC or used in washing the impactor collection substrates). Even though the samples had been pelletized, in the resuspension process the appropriate amount of liquid was used to restore the original concentrations.
FIG. 6 (a) Real-time PCR amplification of Impactor and WWC samples compared with a standard curve that was prepared from serial dilutions of the E. coli stock suspension. Samples for the impactor and WWC were applied in 1×, 2×, 10× and 100× dilutions of the initial sample volumes. (b) Gel images of traditional PCR amplification of the 1.375 kb recA fragment from the E. coli samples collected from air at room temperature with the impactor and the WWC. Lane 1: Impactor 10 min collection during aerosolization period. Lane 2: Impactor 10 min collection with 50 min additional operation. Lanes 3–4: WWC 10 min collection during aerosolization period with 2 min additional operation for flushing. Lane 5: E. coli stock suspension. Lane 6: Negative control (E. coli cells only). Lanes 7 and 8: 1 kb ladder (NEB). Lane 9: Negative control (reaction mixture lacking DNA).
With reference to , the Ct values and CFU counts of the WWC and impactor samples are in good agreement with the values of the standard curve (calibration curve), where the standard curve was prepared from the E. coli stock suspension. As an example, for the WWC at 1× dilution, the threshold cycle (Ct) value is 16.9. The calibration curve, EquationEquation 2, predicts that c CFU = 3.41E+5 CFU/mL, where the calibration curve is based on the analysis of the cells that were neither subjected to the stresses associated with atomization nor the stresses of aerosol collection. By comparison, the corresponding experimentally measured value was c CFU = 3.46E+5 CFU/mL. This agreement suggests that only intact genomic DNA of the culturable cells in the impactor and WWC samples provides the templates for amplification, i.e., the primers fail to recognize the presence of DNA from damaged cells.
At 1× dilution, the threshold cycle (Ct) values, which provided positive identification, were 16.9 for the WWC samples and 22.5 for the impactor samples. The corresponding experimentally determined values of c CFU were 3.46E+5 CFU/mL and 3.70E+3 CFU/mL, respectively. The volume of WWC liquid was 4.29 mL and that of the impactor was 3.53 mL. Thus, when the 2 devices sampled the same number of E. coli cells, the WWC provided 1.48E+6 culturable cells and the impactor provided 1.32E+4 culturable cells. The ratio of culturable cells provided by the WWC to that of the impactor is 112×. Alternatively, from EquationEquation 2, which is based on the RT-PCR calibration curve, the ratio of CFU concentration in the WWC effluent liquid, c CFU,wwc, to that in the impactor wash liquid, c CFU,imp, is:
With regard to the question of whether traces of EDTA in the impactor samples, subsequent to the process of pelletizing and resuspending the DNA, might have interfered with the RT-PCR reactions, the data points in for the 1×, 2×, 10×, and 100× WWC dilutions follow the calibration curve. In a similar manner, the 1×, 2×, 10×, and 100× impactor dilutions follow the calibration curve. As EDTA was involved in the impactor but not the WWC experiments, the EDTA does not have an effect on the impactor results presented herein.
shows the gel images of the classical PCR amplification products where qualitatively it may be observed that no amplification product can be detected in the 10-min or 60-min impactor samples (Lanes 1–2), which is likely due to the lack of sufficient intact genomic DNA. However, strong bands of about 1.375 kb can be seen in the WWC (Lanes 3–4) and the E. coli stock (Lane 5) samples, indicating successful amplification of the target recA gene. Lane 6, a negative control E. coli pellet that has neither the enzyme nor the oligonucleotide primers, and Lane 9, a negative control that has only reaction mixture (lacking DNA), should not have DNA bands, and none are visible.
SUMMARY AND DISCUSSION
A study was conducted on the culturability and DNA intactness of E. coli aerosol particles, as affected by collection with an 800 L/min inertial impactor and a 300 L/min WWC. The aerosol was generated with a Collison atomizer and was comprised of approximately single-cell particles with sizes of about 1 μm AD. When the two devices sample the same number of single-cell particles, the WWC retains a factor of 100–4000 more culturable cells than the impactor, with the lower factor associated with sampling air at RT and the higher factor associated with sampling 46°C air. Tests were also conducted with samples collected on glass fiber filters. When the same number of cells was sampled by both the WWC and the filter, 100× less culturable bacteria were detected with the filter sample than the WWC when the sampled air was at RT, and no culturable cells were recovered from the filter when the sampled air was at 46°C. In contrast, at 46°C the WWC provided 316,000 culturable cells out of a total of approximately 460,000 cells that were generated.
These experiments were conducted with each sampler ingesting all of the aerosol particles from the generator, where the generator produced the same number of particles in each test. The filter would collect all of the E. coli particles, and cutpoints of the WWC and impactor are about 1 μm and somewhat less than 1 μm, respectively. Thus, the filter should collect more particles than the impactor, and the impactor should collect more particles than the WWC. Yet there the number of culturable cells provided by the WWC is significantly larger than that from the impactor, and the impactor provides more culturable cells than the filter.
High molecular weight DNA is necessary for contemporary near-real-time labeled-DNA identifiers, which typically require a minimum length of about 500,000 base pairs. Undamaged bacterial genomic DNA of the E. coli K-12 strain has on the order of 5 × 10⁶ base pairs, so some damage is acceptable. Qualitative results were obtained on the intactness of the E. coli DNA collected by the impactor and the WWC through visual examination of the lanes resulting from PFGE. When the two devices were used to sample the same number of aerosol particles over 10-min periods at RT, there is clearly more high molecular weight consistent with intact chromosomal DNA (∼4.6 Mb) resulting from the use of the WWC, as evidenced by the relative amounts of DNA remaining in the wells of the lanes after completion of the electrophoresis process. Similar results are obtained when the aerosol sampled by the devices is at 46°C; however, it appears that there is even less useful DNA in the impactor samples. When the impactor samples are exposed to heated air for an additional period of 110 min beyond the aerosol collection stage, the amount of high molecular weight DNA does not appear to be further diminished.
When exposed to restriction digest using the NotI enzyme or PCR amplification using the recA specific oligonucleotides that target a longer sequence (1.375 kb), the WWC samples retained a high quality DNA template similar to that of the E. coli stock. In contrast, the lanes for the impactor samples were smeared indicating the presence of DNA fragments as well as the intended restriction segments.
Quantitative results were obtained on the WWC and impactor samples using RT-PCR. Those results showed that 1× dilutions of E. coli collected with the WWC required a threshold cycle number (Ct) of 16.9 for identification, whereas the E. coli collected with the impactor required a cycle number of 22.5. In terms of the relative concentration of cells that must be collected to affect DNA identification, the impactor would require a factor of about 100× more than the WWC. Also, the RT-PCR tests showed that the data points for Ct as a function of culturable cell concentration (CFU/mL) of the WWC and impactor to be in good agreement with the standard curve, which suggests that only the intact genomic DNA of the culturable cells provide adequate templates for amplification. For the WWC samples, the experimental data points for Ct as a function of the concentration of culturable cells agreed well with the calibration curve for the RT-PCR, which suggests the intactness of the cells is maintained during the WWC collection.
In comparing the performance of the WWC with that of an impactor, the WWC has a significantly better yield in culturability and causes less damage to the DNA of E. coli. We believe that these results are manifestations of two phenomena. First, the collection of particles in the WWC is by oblique impaction onto the curved inner wall of the cyclone (the air jet is nearly tangential to the cyclone wall) while that of the impactor takes place with the collection surface perpendicular to the air jet, which causes more mechanical stress to be exerted on the organism. Second, the aerosol particles are collected on a continuously flowing liquid film in the WWC and are not subjected to as severe additional post-impaction stresses, e.g., osmotic and thermal stresses, as are the particles collected by a classical impactor.
Acknowledgments
This work was supported by the Edgewood Chemical Biological Center of the U.S. Army Research, Development, and Engineering command under contract DAAD13–03-C-0050. The authors wish to express their appreciation to Edward W. Stuebing, Jerold R. Bottiger, and Jana Kasavan of the Army and Dr. Carlos F. Gonzalez of the Department of Plant Pathology at the Texas A&M University for their suggestions and help.
aCurrent addresses: AR McFarland, PhD, PE, Inc., Houston, TX.
Notes
A.k.a. log phase, which is a time period characterized by the increase in the number of new bacteria appearing per unit time being proportional to the existing population.
Optical density at 600 nm light wave length.
Guanine (G) and cytosine (C) are two of the five main nucleobases found in the nucleic acids DNA and RNA. In DNA, guanine is paired with cytosine via hydrogen bonds.
Related Research Data
REFERENCES
- An , H. R. , Mainelis , G. and White , L. 2006 . Development and Calibration of Real-time PCR for Quantification of Airborne Microorganisms in Air Samples . Atmos. Environ. , 40 : 7924 – 939 .
- Berrier , C. , Besnard , M. , Ajouz , B. , Coulombe , A. and Ghazi , A. 1996 . Multiple Mechanosensitive Ion Channels from Escherichia coli, Activated at Different Thresholds of Applied Pressure . J. Membrane Biol., , 151 : 175 – 187 .
- Bio-Rad . 1992 . CHEF-DR II Pulsed Field-Gel Electrophoresis Systems Instruction Manual and Application Guide Catalog Numbers 170–3612 through 170–3729 , Hercules , CA : Bio-Rad Laboratories .
- Branda , S. S. , Gonzalez-Pastor , J. E. , Ben-Yehuda , S. , Losick , R. and Kolter , R. 2001 . Fruiting Body Formation by Bacillus subtilis . Proc. Nat. Acad. Sci. , 98 : 11621 – 11626 .
- Cha , R. S. and Thilly , W. G. 1993 . Specificity, Efficiency, and Fidelity of PCR . Genome Res. , 3 : S18 – S29 .
- Cheng , S. , Chen , Y. , Monforte , J. A. , Higuchi , R. and Van Houten , B. 1995 . Template Integrity Is Essential for PCR Amplification of 20- to 30-kb Sequences from Genomic DNA . PCR Method. Appl. , 4 : 294 – 298 .
- CIDRAP . 2003 . BioWatch Program Aims for Nationwide Detection of Airborne Pathogens Center for Infectious Disease Research and PolicyNews, February 26, 2003, revised March 10, 2003
- Cox , C. S. 1970 . Aerosol Survival of Escherichia coli B Disseminated from the Dry State . Appl. Microbiol. , 19 : 604 – 607 .
- Cox , C. S. 1976 . Inactivation Kinetics of Some Microorganisms Subjected to a Variety of Stresses . Appl. Environ. Microbiol. , 31 : 836 – 846 .
- CRS . 2003 . The BioWatch Program: Detection of Bioterrorism , Washington , DC : Congressional Research Service, Center for Democracy & Technology . Report No. RL 32152.
- Deagle , B. E. , Eveson , J. P. and Jarman , S. N. 2006 . Quantification of Damage in DNA Recovered from Highly Degraded Samples – A case study on DNA in Faeces . Front. Zool. , 3 : 1 – 11 .
- Eckert , K. A. and Kunkel , T. A. 1991 . DNA Polymerase Fidelity and the Polymerase Chain Reaction . Genome Res. , 1 : 17 – 24 .
- Flanagan , J. L. , Ventra , L. and Weiss , A. S. 1989 . Rapid Method for Preparation and Cleavage of Bacterial DNA for Pulsed-field Separation . Nucleic. Acids Res. , 17 : 814
- Ganguly , T. , Chen , P. , Teetsel , R. , Zhang , L. P. , Papaioannou , E. and Cianciarulo , J. 2005 . High-throughput Sequencing of High Copy Number Plasmids from Bacterial Cultures by Heat Lysis . BioTechniques, , 39 ( 3 ) : 304 – 308 .
- Gluodenis , T. and Harrison , S. 2004 . Homeland Security and Bioterrorism Applications: Detection of Bioweapon Pathogens by Microfluidic-Based Electrophoretic DNA Analysis . Med. Lab. Obser. , 36 : 34 – 38 .
- Golenberg , E. M. , Bickel , A. and Weihs , P. 1996 . Effect of Highly Fragmented DNA on PCR . Nucleic Acids Res. , 24 : 5026 – 5033 .
- Hecker , M. and Völker , U. 2001 . General Stress Response of Bacillus subtilis and Other Bacteria . Adv. Microb. Physiol. , 44 : 35 – 91 .
- Hinds , W. C. 1999 . Aerosol Technology – Properties, Behavior, and Measurement of Airborne Particles , 2nd ed , New York , NY : John Wiley & Sons, Inc. .
- Hu , S. and McFarland , A. R. 2007 . Numerical Performance Simulation of a Wetted Wall Bioaerosol Sampling Cyclone . Aerosol Sci. Technol. , 41 : 160 – 168 .
- Hubbard , J. A. , Haglund , J. S. , Ezekoye , O. A. and McFarland , A. R. 2011 . Liquid Consumption of Wetted Wall Bioaerosol Sampling Cyclones: Characterization and Control . Aerosol Sci. Technol. , 45 : 172 – 182 .
- Huggett , J. F. , Novak , T. , Garson , J. A. , Green , C. , Morris-Jones , S. D. Miller , R. F. 2008 . Differential Susceptibility of PCR Reactions to Inhibitors: An Important and Unrecognized Phenomenon . BMC Res. Notes, , 1 : 70
- Jenkins , R. O. and Sherburn , R. E. 2005 . Growth and Survival of Bacteria Implicated in Sudden Infant Death Syndrome on Cot Mattress Materials . J. Appl. Microbiol. , 99 : 573 – 579 .
- Kaur , J. , Ledward , D. A. , Park , R. W. A. and Robson , R. L. 1998 . Factors Affecting the Heat Resistance of Escherichia Coli O157:H7 . Letters in Appl. Microbiol. , 26 : 325 – 330 .
- Kavouras , I. G. and Koutrakis , P. 2001 . Use of Polyurethane Foam as the Impaction Substrate/Collection Medium in Conventional Inertial Impactors . Aerosol Sci. Technol. , 34 : 46 – 56 .
- Liang , W. and Johnson , J. P. 1988 . Rapid Plasmid Insert Amplification with Polymerase Chain Reaction . Nucleic Acids Res. , 16 : 3579
- Lin , X. and Li , C. S. 1998 . The Effect of Sampling Time and Flow Rates on the Bioefficiency of Three Fungal Spore Sampling Methods . Aerosol Sci. Technol. , 28 : 511 – 522 .
- Marles-Wright , J. , Grant , T. , Delumeau , O. , van Duinen , G. , Firebank , S. J. Lewis , P. J. 2008 . Molecular Architecture of the “Stressosome,” a Signal Integration and Transduction Hub . Science , 322 ( 5898 ) : 92 – 96 .
- McFarland , A. R. , Haglund , J. S. , King , M. D. , Hu , S. , Phull , M. Moncla , B. 2010 . Wetted Wall Cyclones for Bioaerosol Sampling . Aerosol Sci. Technol. , 44 : 241 – 252 .
- Monier , J.-M. and Lindow , S. E. 2003 . Differential Survival of Solitary and Aggregated Bacterial Cells Promotes Aggregate Formation on Leaf Surfaces . Proc. Nat. Acad. Sci. , 100 : 15977 – 15982 .
- Niven , G. W. 2004 . Ribosome Modulation Factor Protects Escherichia coli during Heat Stress, But This May Not Be Dependent on Ribosome Dimerisation . Arch. Microbiol. , 182 : 60 – 66 .
- O’Mahony , J. and Hill , C. 2002 . A Real Time PCR Assay for the Detection and Quantitation of Mycobacterium avium subsp. paratuberculosis using SYBR Green and the Light Cycler . J. Microbiol. Meth. , 51 : 283 – 293 .
- Pääbo , S. 1989 . Ancient DNA: Extraction, Characterization, Molecular Cloning, and Enzymatic Amplification . Proc. Natl. Acad. Sci. , 86 : 1939 – 1943 .
- Pääbo , S. , Irwing , D. M. and Wilson , A. C. 1990 . DNA Damage Promotes Jumping Between Templates During Enzymatic Amplification . J. Biol. Chem. , 265 : 4718 – 4721 .
- Sambrook , J. , Fritsch , E. F., and Maniatis , T. 1989 . Molecular Cloning: A Laboratory Manual , (2nd ed.) , Cold Spring , NY : Cold Spring Harbor Laboratory Press .
- Sancar , A. , Stachelek , C. , Konigsberg , W. and Rupp , W. D. 1980 . Sequences of the recA Gene and Protein . Proc. Natl. Acad. Sci., , 77 : 2611 – 2615 .
- Schafer , M. P. , Fernback , J. E. and Ernst , M. K. 1999 . Detection and Characterization of Airborne Mycobacterium tuberculosis H37Ra Particles, a Surrogate for Airborne Pathogenic M. tuberculosis . Aerosol Sci. Tech. , 30 : 161 – 173 .
- Smith , C. L. , Klco , S. R. and Cantor , C. R. 1988 . “ Pulsed-Field Gel Electrophoresis and the Technology of Large DNA Molecules, ” . In Genome Analysis: A Practical Approach , Edited by: Davis , K. E. 41 – 72 . Oxford , , England : IRL Press .
- Sobral , B. W. and Atherly , A. G. 1989 . A Rapid and Cost-effective Method for Preparing Genomic DNA from Gram-negative Bacteria in Agarose Plugs for Pulsed-field Gel Electrophoresis . BioTechniques, , 7 : 938
- Stetzenbach , L. D. , Buttner , M. P. and Cruz , P. 2004 . Detection and Enumeration of Airborne Biocontaminants . Curr. Opin. Biotech. , 15 : 170 – 174 .
- Stewart , S. L. , Grinshpun , S. A. , Willeke , K. , Terzieva , S. , Ulevicius , V. and Donnelly , J. 1995 . Effect of Impact Stress on Microbial Recovery on an Agar Surface . Appl. Environ. Microbiol. , 61 : 1232 – 1239 .
- Titball , R. W. and Pearson , G. S. 1993 . BWC Verification Measures: Technologies for the Identification of Biological Warfare Agents . Polit. Life Sci. , 12 ( 2 ) : 255 – 263 .
- U.S. NRC . 2005 . Sensor Systems for Biological Agent Attacks: Protecting Buildings and Military Bases , Washington , DC : U.S. National Research Council. National Academies Press . Committee on Materials and Manufacturing Processes for Advanced Sensors,
- VanGuilder , H. D. , Vrana , K. E. and Freeman , W. M. 2008 . Twenty-five Years of Quantitative PCR for Gene Expression Analysis . Biotechniques, , 44 : 619 – 626 .
- Ventra , L. and Weiss , A. S. 1989 . Transposon-mediated Restriction Mapping of the Bacillus subtilis Chromosome . Genetics, , 78 : 29 – 36 .
- Walter , M. V. , Marthi , B. , Fieland , V. P. and Ganio , L. M. 1990 . Effect of Aerosolization on Subsequent Bacterial Survival . Appl. Environ. Microbiol. , 56 ( 11 ) : 3468 – 3472 .
- White , L. A. , Hadley , D. J. , Davids , D. E. and Naylor , R. 1975 . Improved Large-Volume Sampler for the Collection of Bacterial Cells from Aerosol . Appl. Microbiol. , 29 ( 3 ) : 335 – 339 .
- Willeke , K. , Lin , X. and Grinshpun , S. 1998 . Improved Aerosol Collection by Combined Impaction and Centrifugal Motion . Aerosol Sci. Technol. , 28 : 439 – 456 .
- Zhou , S. , Pape , L. and Schwartz , D. C. 2008 . “ Optical Sequencing: Acquisition from Mapped Single-Molecule Templates, ” . In Next-Generation Genome Sequencing Edited by: Janitz , M. 133 – 151 . Weinheim , , Germany : Wiley-VCH Verlag GMBH & Co. KgaA, .
- Zobell , C. E. and Cobet , A. B. 1962 . Growth, Reproduction and Death Rates of Escherichia coli at Increased Hydrostatic Pressures . J. Bacteriol. , 84 : 1228 – 1236 .