Abstract
Computational fluid dynamics (CFD) simulations of nasal drug delivery often neglect the initial spray particle conditions (e.g., particle velocity) and instead introduce particles entrained by the inhaled airflow into the nasal cavity. The results presented in this study aim to provide some insight into spray droplet formation after atomization of a drug formulation from a nasal spray device. A commercial nasal spray device was tested under a constant flow in order to better understand its spray formation and characteristics. External characteristics such as the spray cone angle define the shape of the atomized spray that exits from the device, while the internal characteristics such as the droplet size distribution help to determine the likelihood of inertial impaction within the nasal cavity. The experimental method makes use of particle image velocimetry (PIV) and particle/droplet image analysis (PDIA) to obtain droplet diameters and spray velocities in different spray regions. Image processing techniques were applied to enhance visualization and a droplet concentration field. It was shown that there is some variation in the droplet diameters with respect to its radial and axial position from the spray orifice. Empirical curve fits for the particle size distribution were formulated to allow easier adoption of the data into CFD models. The dimensions of the external spray were shown to be much larger in comparison with the dimensions of a nasal cavity, which means that only a narrow portion of the spray will fit within the narrow cross sections of the nasal cavity. The results may be used for the validation of spray atomization models and applied to the particle deposition study of sprayed particles in nasal cavity in future.
Copyright 2012 American Association for Aerosol Research
INTRODUCTION
Traditionally, nasal drug delivery has been commonly used in the treatment of nasal congestion and minor complications such as allergic rhinitis. However, the nasal cavity also provides the potential for delivering systemically acting drugs, due to the highly vascularized mucosa walls directly connected to the bloodstream (Kimbell et al. Citation2004). Despite this, the efficacy is compromised by the delivery device that provides particles at high velocities leading to early deposition within the nasal vestibule (Cheng et al. Citation2001; Inthavong et al. Citation2006), rather than penetrating the nasal valve and depositing onto the main nasal passage walls in the turbinate nasal region. Therefore, studies of nasal-sprayed particles and its deposition are important for improving the efficacy of nasal drug delivery.
Recently, simulations using computational fluid dynamics (CFD) have been performed to model the transport and deposition of particles in realistic nasal cavities during inhalation (Inthavong et al. Citation2006; Kimbell et al. Citation2007; Liu et al. Citation2007, Citation2010; Shi et al. Citation2007). Typically, the particles are introduced into the flow domain after a steady state simulation has been performed and hence a one-way gas-particle coupling approach is used. In relation to drug delivery, the studies by Inthavong et al. (Citation2006) and Kimbell et al. (Citation2007) provide an evaluation of different nasal spray delivery parameters on drug delivery efficiency. The parameters include spray cone angle, initial particle velocity, insertion angle, particle size, and particle release location. Improvements to the current state of CFD simulations can be made by applying more realistic initial particle conditions as they are produced during the atomization process of the nasal spray device. Important information such as the particle size, initial velocity, and initial locations is imperative to the CFD simulations, and this can be achieved through experimental measurements.
Several experimental studies for determining such spray characteristics have been performed which provide good contribution toward a set of data, or database for CFD simulations. These results include Cheng et al. (Citation2001), which found single-mode and bimodal droplet size distribution (DSD) variations between four spray pumps and provided a lognormal distribution profile of the DSD. The Dv 10, Dv 50, and Dv 90 values have been measured by Suman et al. (Citation2002), Dayal et al. (Citation2004), Foo et al. (Citation2007), Guo and Doub (Citation2006), and Guo et al. (Citation2008) for three different spray pumps and different drug formulations.
In these studies, laser diffraction has been used to characterize the DSDs by the cumulative volume mean diameters (VMDs) at Dv 10, Dv 50, and Dv 90, respectively. The laser diffraction technique is based on the scattering of light from a collimated laser beam as it hits the droplet that passes through it. The scattered light then hits a detector at different angles, inversely proportional to the particle's size; thus, the droplets of the same size will scatter light to the same part of the detector array. As a result, there is a scattering pattern on the detector and a DSD can be determined by fitting the data with a scattering algorithm/model typically supplied with the laser imaging system. The accuracy of the DSD therefore has a reliance on the scattering model. One other issue in relation to laser diffraction is the selection of the spray tip to laser distance. Since the spray formation can develop over 50 cm in length (Suman et al. Citation2002), the DSD will vary significantly if the laser beam is passed across the spray close to the spray nozzle compared with a distance far from the nozzle distance.
Other imaging techniques that have been used to characterize nasal sprays include particle image velocimetry (PIV) and phase Doppler anemometry (PDA). PIV pulses a laser light sheet twice in succession to illuminate particles, which is captured as a photographic image. Postprocessing the images produces an instantaneous velocity field in a 2D plane. Williams et al. (Citation2009) used PIV to measure the droplet velocities from nasal spray devices containing water and found the velocities ranged from 1.7 to 28.6 m/s over different positions in the 2D plane and the average over two spray pumps ranged from 8.4 and 12.8 m/s. Crosland et al. (Citation2009) also showed that PIV could be used to measure the 2D velocity field but for pressurized metered-dose inhalers.
PDA is a single-point measurement formed by two coherent laser beams that intersect to form a small measuring volume. The droplet velocities and diameters are determined by the Doppler bursts from the laser light scattering. Recently, the study by Liu et al. (Citation2010) used PDA to determine both the droplet velocity and size. Thirteen sampling positions located in the horizontal plane, 3 cm above the spray device orifice, were measured, which showed that droplet velocities near the center of the spray plume were higher and more consistent than those near the edge. A comparison of the studies presented in this literature survey shows that the use of laser diffraction for nasal spray characterization is more prominent over PIV and PDA. This may be due to the US Food and Drug Administration (FDA) guidelines, which suggest the measurements of cumulative VMD undersize as one metric for nasal spray testing. However, for laser diffraction and PDA, the selection of the vertical distance from the nasal spray orifice as the measurement location can have a significant influence on the outcome (Dayal et al. Citation2004).
Another droplet sizing method that can be used is particle/droplet image analysis (PDIA). The basic principle of the technique is the detection of droplets by direct photography in narrow depths of field. A large sample is needed to obtain statistically representative samples, and as such, an automated or semiautomated segmentation threshold algorithm is used to quantify and analyze the droplets. The algorithm is primarily based on the work by Yule et al. (Citation1978) taking into account the image focus and edge gradient intensity of a droplet image. PDIA has been used successfully for high-speed sprays produced from pressure-swirl atomizers (Fantini et al. Citation1990; Kashdan et al. Citation2003).
This article aims to provide both qualitative images and quantitative data for a better understanding of the droplet formation from nasal spray atomization. The focus is to determine realistic values for the required parameters for setting up CFD initial particle conditions. These include initial particle locations, velocity, mass flow rate, and spray angle. The external spray characteristics such as plume geometry and spray velocity field is determined by PIV. PDIA is used to obtain magnified images of the near-nozzle spray region to reveal the physical behavior of nasal spray atomization, and by processing the PDIA images, regional DSDs can be obtained. Finally, the spray plume geometry is compared with the human nasal cavity geometrically and by highly simplified CFD visualization to determine the important measurement region of a nasal spray. It is anticipated that these results will help determine the relevant measurement regions for nasal spray plumes and for CFD simulations of nasal spray drug delivery by determining better initial particle conditions in the computational domain.
METHOD
Spray Image Acquisition
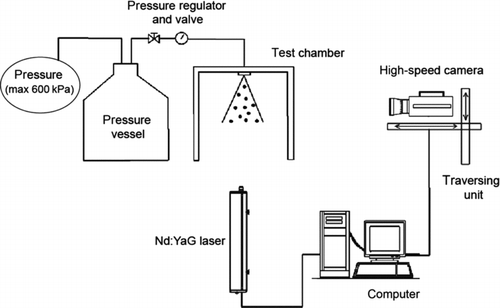
A steady stream of water is passed through a nasal spray that is placed in a perspex test chamber. A schematic of the setup is given in , which shows both the pressurized water supply and the visualization system. An upstream pressure of up to 600 kPa was available and a pressure regulator is fitted at the outlet end to monitor a constant steady operating pressure of 500 kPa. The transparent perspex test chamber encloses a nasal spray nozzle that is pointed downward. This allows a laser sheet to pass through the spray in the vertical plane, and measurements are taken without any interference from gravitational settling of droplets, which is unavoidable if the nasal spray were to be directed upward. The visualization system includes a SensiCam 12-bit digital charge-coupled device (CCD) camera (1280 × 1024 pixels), which is synchronized with a New Wave 120 mJ double-pulsed Nd:YAG laser to produce the laser sheet.
The camera was mounted on a high precision (±17 μm precision) traversing unit, which allowed precise movements in all three coordinates to reposition the camera. Water was released through a pressure regulator valve and allowed to reach steady conditions before image acquisition took place. A single run was limited to 3 min in order to avoid pressure variations associated with a decreasing liquid volume in the pressure tank and repeated until 400 pairs of PDIA images in each camera location (10 locations in total) and 900 pairs of PIV images (in one laser sheet/camera location) were obtained. The nasal spray device used in the present study was provided by Saint-Gobain/Calmar.
PIV
The Nd:YAG laser beam was expanded by a cylindrical lens to form a 1.5- to 2-mm-thick planar vertical light sheet over the measurement plane. The field of view (FOV) of the CCD camera was 268 × 215 mm, and the interrogation windows were 32 × 32 pixels (8.4 × 8.4 mm), with 50% overlap between consecutive interrogation cells, providing a velocity vector spacing of 16 pixels (4.2 mm). The uncertainty of pixel displacement is given as 0.2 pixels (Intelligent Laser Applications 2004) within the interrogation window of 32 × 32 pixels, resulting in a 0.6% error uncertainty. The sheet was passed through the vertical middle plane of the spray and the camera was aligned perpendicular to the laser sheet. Nine hundred pairs of images with a time difference of 40 μs between each image pair were obtained. This allowed calculation for the instantaneous 2D velocity vector map for each image pair. An ensemble average of the instantaneous vector maps was created to produce an average 2D velocity vector field.
For gas flows, seeded tracer particles are added to the flow so that they can be illuminated with a sheet of laser light and captured visually with a camera. The seeded particles need to give excellent contrast while being able to trace the flow sufficiently for a given flow rate and geometry. However, in PIV measurements of sprays, droplets play the role of the seeding particles. As Ghaemi et al. (Citation2010) points out, the characteristics of velocity and size are dependent on the atomizer design and spatial location and therefore may not be the optimum choice of seeding particles from a PIV processing viewpoint. This is particularly so in regions of high number density occurring in the near-nozzle region, which was found to produce relatively high error (Ikeda et al. Citation1998). Consequently, the PIV results in this study within the near-nozzle region should be taken with caution given the relatively high error. However, the use of PIV is to visualize and determine the external spray characteristics such as plume geometry and spray cone diameters. For the near-nozzle region, PDIA visualization and analysis is used to investigate the first 12 mm downstream from the nozzle.
PDIA
Droplet images were acquired with a long-distance microscope lens with a magnification of 2.46. This captured a physical region of 3.85 × 3.08 mm equating to a resolution of approximately 3.01 μm/pixel. A set of 400 image pairs for each FOV (10 views) was obtained, and the detection of the droplet diameters was performed based on an automated segmentation threshold algorithm to determine that a droplet is in the focal plane (Yule et al. Citation1978; Whybrew et al. Citation1999). The diameter and sphericity of a droplet are discretized from an estimate of the pixel area of the droplet image with a correction for out-of-focus effects, which typically appear up to 30% larger than they actually are. The PDIA technique uses two thresholds, one to measure the gray out-of-focus border area and the other to measure the dark core area. From the ratio of these two areas, the true droplet size and its distance from the plane of best focus can be deduced. Additionally, the PDIA algorithm also corrects the bias introduced by droplets that touch the edges of the image.
When a particle is complete, the final border checks, focus calculations, etc., are performed on the particle. This algorithm (Kim and Fisher Citation1999; Kashdan et al. Citation2003; Zhou and Cheng Citation2005) is built into the propriety accompanying software, VisiSize-Solo, which measures and reports pixel area, perimeter, focus parameter, and x–y coordinates of the top, bottom, left extreme, and right extreme. The minimum particle resolution is defined through the following correlation:
Diameter measurements are based on an area estimate of the shadow image of an individual droplet. Three statistical mean diameters are used in this study: the number mean diameter, D 10; the volume mean diameter, D 30; and the Sauter (or surface weighted) mean diameter (SMD), D 32. The various diameters are defined using the following equation:
The SMD was selected to represent the mean diameter of droplets within the flotation cell and is particularly relevant to hydrodynamics and mass transfer, since both drag and reaction rates are proportional to the droplet area.
The accuracy of the PDIA imaging system for small spherical objects is dependent on the effects of diffraction, defocus, and optical resolution. A small spherical droplet in the path of an illuminating plane that is digitally imaged by a system of lenses is found with blurred edges, where the definition of the shadow edge becomes progressively more difficult with decreasing size. Experimental calibration of the system is performed to quantify and account for these effects (object defocus on the halo area) on shadow droplet image properties, which are stored in a machine-specific calibration file. This allows for diameter corrections to be made by determining the location of a defocused droplet relative to the plane of focus based on the intensity gradient across the droplet image. Other calibrations include a depth of field calibration specific for the lens used and a correction for the measurement bias toward larger droplets. Details of the calibration are given in Kashdan et al. (Citation2003).
The acquired spray images are in an 8-bit gray scale, and segmentation of droplets relies on a good contrast between the object and the background. In practice, the threshold is generally set at a gray scale level corresponding to 10, below the position at which the background-gray-level peak starts to rise. This is to prevent any background noise from being incorrectly accepted as foreground droplets. A good image signal-to-noise ratio is also important for measurement accuracy, and this relies on ensuring sufficiently wide gray-scale separation between the object and the image background as indicated by the image intensity histogram. This improves image contrast and measurement accuracy as the sensitivity to the threshold level is reduced; however, a decrease in the applied threshold level tends to reduce the calculated droplet diameter and the sensitivity to the threshold level increases considerably with decreasing droplet diameter. We applied a background subtraction to enhance the contrast and then applied a threshold level of 0.9. At this level, the calibrated data show errors of 10% for 18 μm droplets and a decreasing error of 5% for 80 μm droplets.
An important control parameter during droplet segmentation is the shape rejection. This is chosen so that droplets that overlap each other or ligaments that do not resemble droplets may be rejected. The value was set between 0.6 and 0.75 to reject overlapping droplets and the number of droplets that were rejected from the different settings varied by 3.5%. Considering the possible errors, the determined values for the smaller ranged droplets <80 μm have uncertainty from 5% up to10% for the smallest of the droplet sizes.
FIG. 2 80× SEM image of a cutaway of the nasal spray device showing the nozzle orifice and its tangential ports. The orifice diameter is 0.28 mm.
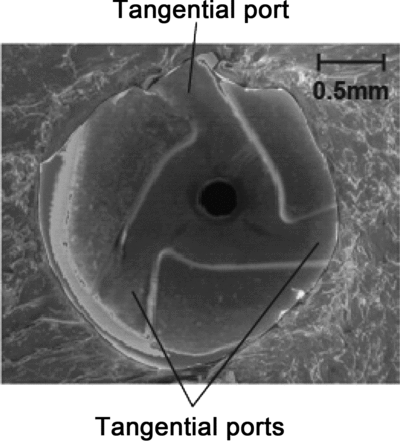
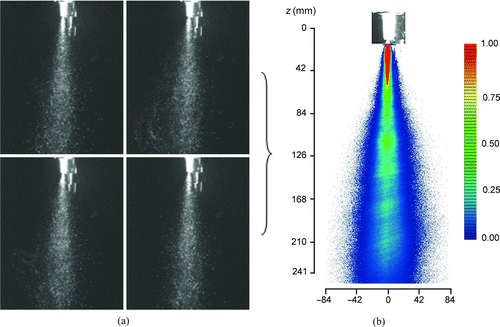
FIG. 3 (a) Four sample images of the spray highlighting the fluctuating properties of the spray plume. (b) Averaged spray plume color map created by overlaying each of the 900 individual spray images. The scale/legend represents the percentage of images that contain spray droplets. The vertical axis is in the z-coordinate and units in millimeters. (Color figure available online.)
RESULTS AND DISCUSSION
External Spray Characteristics by PIV Measurements
To understand the spray formation and external spray characteristics, knowledge of the internal atomizer nozzle can provide expectations to its features based on established knowledge (Lefebvre Citation1989; Liu Citation2000). The nasal spray device was sliced open at the nozzle and a scanning electron microscope (SEM) was used to determine the type of atomizer used. shows the 80× image SEM magnification of the internal atomizer, which is a pressure-swirl type. In this case, there are three tangential ports that force the drug formulation to swirl through the orifice, which is 0.28 mm in diameter. Lefebvre (Citation1989) notes that these atomizers produce much wider cone angles over plain orifice atomizers because of the swirling motion imparted to the liquid, thus spreading it out in the form of a conical sheet as soon as it leaves the orifice. Typically, there are two types of pressure-swirl atomizer. In one design, droplets are produced uniformly throughout the spray that is called a solid-cone spray. This results in a relatively coarse atomization at the center of the spray where larger droplets exist. In contrast, a hollow-cone spray will produce droplets that are concentrated at the outer edge of the spray cone. This produces finer atomization (smaller droplets), which is advantageous for combustion applications.
The external spray characteristic and plume geometry is first analyzed by using PIV, which captured 900 image pairs over four test runs, since each image acquisition run was limited to 3 min to avoid large discrepancies in pressure losses from the pressurized tank and mark shot noise. shows four samples of these images, where the spray plume varies in shape as it propagates downstream. Although the spray is continuous, the spray plume exhibits fluctuations caused by the turbulent-free shearing of the moving fluid in the still air. By overlaying each of the 900 individual spray images, an averaged spray plume geometry can be determined in order to average out the fluctuations in the spray. Each acquired image is an 8-bit digital image consisting of pixels with gray scale intensity values, which vary between 0 and 255 where 0 is black and 255 is white. The droplets act as seeding particles and are picked up in the image as white in color. For each spray image, individual pixels, P(x,y), are checked to determine if a droplet is present based on the level of gray intensity, g(x), of each pixel, and if so, the intensity is incremented by 1. If no droplets are detected, then a value of zero is given. A color map, which represents the percentage of images that contain spray droplets at each individual pixel, can then be defined as the total number of droplets recorded for a given pixel divided the number of images checked. This can be summarized as follows:
A single plane is used to characterize the 2D velocity spray field. Suman et al. (Citation2002) noted that the US FDA draft guidance requests that data from the developing plume be collected from “two side views, at 90 degrees to each other”. However, in this case, only one plane from a single view is taken, with the assumption that the spray may be symmetrical. However, this may not necessarily be the case if an atomizer is poorly manufactured or designed with asymmetry. The interrogation and correlation algorithm is performed with ILA-VidPIV software (Intelligent Laser Applications 2004) to produce a 2D velocity field (), where a maximum velocity of 16.8 m/s is reached at approximately 28 mm downstream from the nozzle. The region immediately downstream of the nozzle is a liquid sheet, which means that the PIV is not able to pick up the droplets that are acting as the seeding particles. Therefore, the velocity that it measures in the near-nozzle region (<28 mm from the nozzle) is in fact invalid. The drag imparted onto the spray by the surrounding air decreases the spray velocity further downstream of the nozzle. This can be seen by taking the maximum velocity at the centerline of the PIV velocity vector profile. The profile shows that the spray velocity decreases from its peak velocity to 5.8 m/s at a distance of 200 mm from the nozzle. In this region of the spray, the motion of the droplet begins to shift toward the sedimentation regime rather than from the inertial effects of the spray atomizer. By comparison, it is noted that the terminal velocity of a water droplet with a diameter of 0.226 cm (2260 μm) has a terminal velocity of 5.5 m/s (Flower Citation1927). This region is also quite far from the nozzle and is not applicable for nasal spray applications, given that the nasal cavity dimensions are in the order of 1–10 mm in diameter and width and 100 mm in length.
FIG. 4 (a) PIV 2D vector plot of the averaged mean droplet velocity field of the spray nozzle. (b) Maximum velocity at the centerline of the PIV data. The vertical axis is in the z-coordinate and units in millimeters.
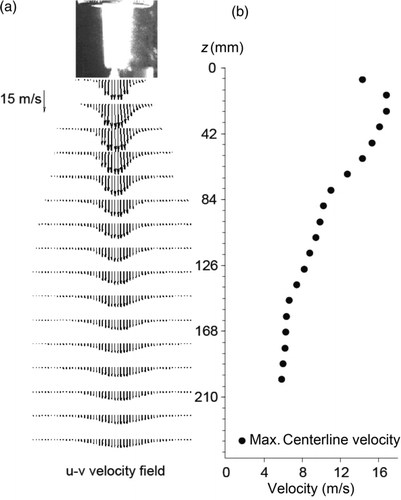
It should be noted that at the spray nozzle, the PIV measurement is not able to resolve the velocity profile because of a lack of clearly distinguishable droplets. Just downstream and in the near-nozzle region, there is a high droplet density. As discussed earlier, there are relatively high errors associated within this region. It has been shown that a high droplet density causes the problem of secondary scattering (Black et al. Citation1996; Ghaemi et al. Citation2010), where the initially illuminated light from the laser sheet is scattered off the droplets, which in turn illuminates other droplets that exist outside the laser sheet, leading to secondary scattering. This process increases the depth of field and the effective thickness of the laser sheet, leading to an underestimation of the in-plane droplet velocity by including the lower velocity droplets of out-of-plane locations. The velocity profile at z = 7 mm in shows smaller values in comparison with the next velocity profile downstream at z = 21 mm. Further downstream, the influence of secondary scattering is reduced as the droplet density and the droplet velocity gradient in the radial direction decreases (Ghaemi et al. Citation2010).
Near-Nozzle Spray Characteristics by PDIA Measurements
Using a traversing system, the camera with an FOV of 3.082 mm × 3.853 mm is moved into 10 different positions in order to capture the extent of the spray field within the first 12.3 mm of spray development downstream from the spray nozzle. shows the PDIA near-nozzle measurement in relation to the PIV external spray field. The first two rows extend for 6.164 mm, which shows the dense liquid region where the spray has not yet atomized. This near-nozzle region of the nasal spray produces a continuous swirling stream of liquid. At a distance from the nozzle, the liquid sheet breaks into ligaments before finally atomizing into droplets. The distance at which clearly formed particles are observed is the breakup length (Lbu ), which occurs just after the ligament breakup region (between the second and the third row, R2 and R3). At this location, the droplets dispersed over the diameter of the spray cone, which also appears to be hollow. This is important for CFD simulations of drug delivery in nasal cavities, since particle initialization in a computational simulation needs to be defined at the breakup length rather than as a point source at the nozzle.
FIG. 5 A collation of single-shot images at different regions of the spray field. The FOV is 3.082 mm × 3.853 mm, which is moved through the spray field using a high-resolution traversing unit. The labels R1–R4 represent the row number and C1–C5 the column number corresponding to the FOV. The spray cone angle is defined as the angle between the centerline and one of the spray peripheral boundary, θ. (Color figure available online.)
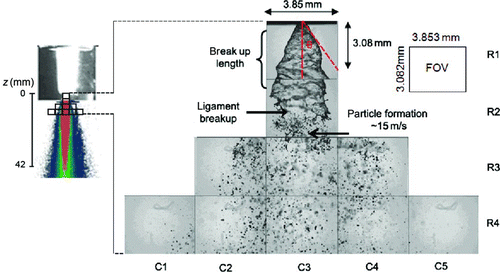
FIG. 6 Spray atomization and droplet formation. (a) Images taken from location R1C3 with the last image, after image processing is applied. (b) Images taken from R2C3—arrows indicate sheet ligaments breaking off and the red line indicates the breakup length, Lbu , by manual inspection. (c) Images taken from R3C3 by PDIA visualization. (d) Schematic of primary spray breakup. (Color figure available online.)
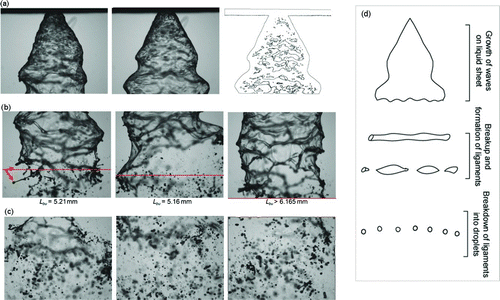
Additional spray images of the center column C3 of rows R1 (near-nozzle region), R2 (ligament breakup region), and R3 (primary breakup region) are shown in . At the near-nozzle region, the liquid is forced through the nozzle orifice under the action of a swirling centrifugal force. Owing to the action of the swirling centrifugal force, a vortex will be formed in the central part inside the spray nozzle. The interaction between the swirling liquid sheet and the surrounding air creates instabilities in the form of rapidly propagating waves produced on the liquid surface. The spray outline shows the liquid oscillating in a sinusoidal pattern. Also on the surface, the liquid has sinusoidal wave patterns, suggesting the movement of the liquid ‘rolling’ downstream in waves. The growth and amplitude of these waves are thought to be a function of the surface tension, aerodynamic forces, and liquid viscosity (Tian et al. Citation2007), and the sheet disintegrates into ligaments once the unstable waves reach a critical amplitude.
It is thought that a spectrum of infinitesimal disturbances appears on the liquid sheet surface where each disturbance is characterized by a wave number based on its amplitude. The largest wave number is then responsible for the sheet to break up. Here the gas Weber number, Weg =ρ g U 2 l/σ, is calculated as 1.06, where ρg is the gas density (1.225 kg/m3), U is the average spray velocity (15 m/s), l is the characteristic length taken as the orifice diameter (0.28 mm), and σ is the liquid surface tension (0.0728 N/m). It has been shown that for low-speed viscous sheet atomization (Weg < 2), such as those found in nasal spray applications, long wave instabilities in the form of sinuous waves are dominant (Chung et al. Citation2000; Kirkpatrick and Armfield Citation2005). These instabilities produce fluctuating velocities and pressure, which can be seen pulling and stretching at the liquid sheet interface (R1C3 in ). The images show that the liquid sheet is oscillating highly unstably. Dombrowski and Johns (Citation1963) showed that the forces acting on the gas–liquid interface include gas pressure, surface tension, liquid inertia, and viscosity. The liquid viscosity plays a role in the atomization whereby a higher viscosity reduces the maximum growth rate of the instabilities prolonging the sheet breakup. Furthermore, the surface tension also acts as a stabilizing process for the sheets (Chung et al. Citation2000). The images taken from R2C3 show the product of the wave/disturbance growth until it becomes unstable leading to an eventual breakdown of the liquid sheet. Here, thin liquid ligaments are sheared off from the sheet, which continues to break up to form droplets. It is evident that the sheet breakup length is not constant due to the swirling motion. Images taken from R3C3 show the first clear droplets beginning to form from the ligaments. Within the set of the images, there were some images (<5%) that showed residual fragments of the liquid sheet that persisted downstream, but these would break up rapidly to form droplets. According to Dombrowski and Johns (Citation1963), the amplitude of the unstable waves on the liquid sheet is equal to the radius of a ligament which forms on drop per wavelength.
In order to quantify the spray cone angle, further image processing techniques were applied. The set of images was processed with the Canny edge detection scheme, which produces an outline of the spray. shows an example of a detected outline for an image at R1C3. The averaged spray angle, which is actually taken as the angle from the centerline to one of the peripheral spray boundary, was θ = 25.8 (this angle is sometimes called the half-angle). Consequently, the full spray cone is equal to twice this spray angle, i.e., θ
full and is 51.6 . For the breakup length, the oscillating nature of the liquid sheet made it difficult to use the edge detection scheme. Instead, manual inspection was performed over 200 images, which proved to be statistically sufficient to get an averaged value (). In nearly all the inspected images, the breakup occurred within the R2C3 location (i.e., <6.164 mm). The average sheet breakup length, ![]() , was determined to be 5.65 ± 0.38 mm (standard deviation error). At this location, the average sheet breakup length, clearly formed droplets are still not present. Here, ligaments tear off the liquid sheet that continues to break up into the droplets, which occur further downstream. Therefore, the formation of droplets is more dominant in the R3C3 images. From a CFD simulation of nasal drug delivery perspective, it may be prudent to introduce the sprayed particles at a further distance than the average breakup length (e.g., ∼6.164 mm from the nozzle).
, was determined to be 5.65 ± 0.38 mm (standard deviation error). At this location, the average sheet breakup length, clearly formed droplets are still not present. Here, ligaments tear off the liquid sheet that continues to break up into the droplets, which occur further downstream. Therefore, the formation of droplets is more dominant in the R3C3 images. From a CFD simulation of nasal drug delivery perspective, it may be prudent to introduce the sprayed particles at a further distance than the average breakup length (e.g., ∼6.164 mm from the nozzle).
Mean Droplet Size Measurements by PDIA Measurements
Nasal spray device evaluation methods have mainly been driven by the FDA guidelines (Suman et al. Citation2002), which suggest using laser diffraction to measure the cumulative VMDs, Dv 10, Dv 50, and Dv 90. One issue with laser diffraction is that it is a point source measurement and therefore can only capture a small region at a time. Furthermore, since the spray changes its characteristics as it propagates downstream, the selection of the laser measurement distance from the nozzle is important. PDIA is a region-based measurement that allows a larger area to be measured. However, this also has some setbacks, in that the accuracy of the results relies on the droplet discretization algorithm in detecting the droplets from a 2D captured image.
VMDs are mainly used as a measure of the mass flow of the droplet phase, and in multiphase flows, where the droplet phase occupies a certain amount of volume, the void fraction can be determined. This is important in relation to nasal spray applications as they are designed to deliver a specific dose per actuation. The SMD is also commonly used for characterizing spray atomizers, but has mainly been used in applications where the active surface area is important, such as catalysis or combustion. In this section, the VMD is mainly used and compared with data in the literature, as it is the mass that is important in nasal spray applications. The SMD values will be used to compare with empirical correlations for the produced droplets based on the upstream fluid conditions.
FIG. 7 Global (a) VMD (D 30) distribution and (b) droplet number distribution in the atomized spray region (R3 and R4). (Color figure available online.)
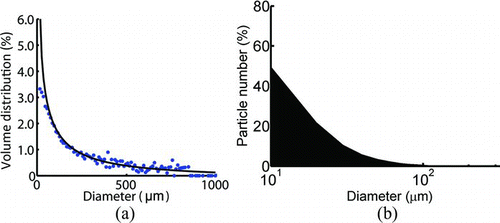
FIG. 8 Local VMD (D 30) distribution in the atomized spray region (R3 and R4). (Color figure available online.)
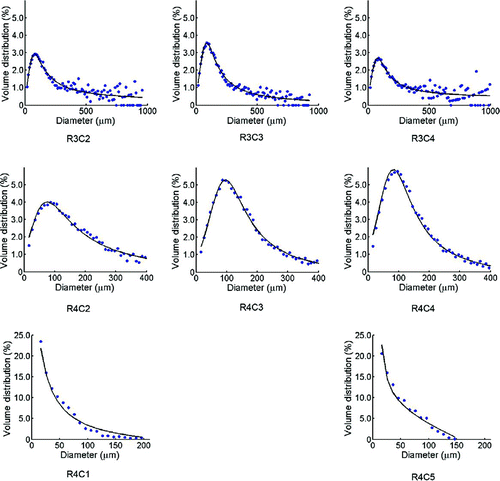
The droplet diameters were measured by analyzing the captured image from the PDIA system. Droplets were categorized into diameter bins of 10 μm in the range of 11–1200 μm; thus, the smallest detectable droplets by PDIA (13 μm) fall into the first diameter bin of 11–20 μm. The global VMD (D 30) distribution for the droplets formed after ligament breakup (i.e., all locations in rows R3 and R4) is given in . Only the bottom two rows are used since the first two rows consist of a dense liquid sheet. A skewed distribution biased toward the smaller diameter range is found where a large percentage of droplets is in the range of 11–300 μm (cumulative percentage of 91.7%). The accompanying particle number distribution highlights the skewed distribution toward smaller droplets. Locally, the droplet distributions for each separate FOV in R3 and R4 (defined in ) are presented in . A curve fit having the polynomial form
TABLE 1 Coefficients for the curve fit correlation in Equation (Equation3) at different FOV locations
FIG. 9 Mean diameters taken at (a) R3 and (b) R4. The average mean diameters for each row are given the legend within each chart.
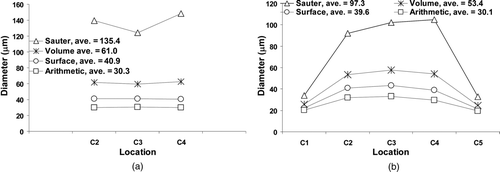
provides the mean droplet diameters and its spatial variation across the lower two rows measured (R3 and R4). The averaged diameters across each row are also given. It is evident that the droplets are larger in size at R3 compared with the downstream location at R4, although the distance between the two rows is only 3.8 mm. The arithmetic mean does not change greatly and this is mainly due to the large number count of the smaller diameter droplets. Droplets in the center column, C3, are typically larger than those in outer radial locations, C1 and C5. The SMD values can be compared with established empirical correlations, which are evaluated below:
The values of Dv 10, Dv 50, and Dv 90 are compared with existing experimental data and summarized in . There are some large differences in the values compared and this may be due to the measurement technique. mentions the studies in which the laser diffraction technique, which takes measurements at a point, was used, while the PDIA, which measures a 2D area field, was used in this study. Another issue is the different measurement distances taken from the laser beam to the nozzle tip and the spatial location of the measurement point within the spray field for laser diffraction measurements. During the atomization process, droplets undergo secondary breakup as it travels further downstream and a decrease in the mean diameters was verified by Dayal et al. (Citation2004), which showed a decrease in Dv 50 values by 17%–27% when the measured distance from the laser beam moved from 15 to 60 mm.
TABLE 2 Cumulative VMD measurements
Nasal Spray Drug Delivery Application
The absorption of nasal drug formulations into the bloodstream occurs most effectively in the main nasal passage (middle region) where curved turbinate structures exist (Davis and Illum Citation2003). The benefits of targeted drug delivery are evident in improving its efficacy while also reducing the bitter taste that users may experience from swallowing, mucociliary action, or forced movement by further sniffing. Current spray device designs administer drug formulations in a vertical position (Kublik and Vidgren Citation1998). This contradicts the directional path of the nasal cavity, which is horizontal, and often leads to high droplet impaction at the top of the nostrils. This can be improved by spray atomizer designs that produce finer droplet sizes to reduce the inertial property of the droplet, leading to less droplets impacting early within the nostrils. Furthermore, this may also enhance the absorption of drugs since aqueous drug solutions with small molecular size are more rapidly absorbed via the aqueous path of the mucous membrane.
The overall length of a nasal cavity from the nostril inlet to the posterior end at the nasopharynx is approximately 97 mm and the height is 47 mm, and exhibits a narrow passageway with a minimum cross-sectional area of ≈1.4 cm2 located about 2.0 cm from the anterior tip of the nose (Wen et al. Citation2008). The length and diameter of the spray plume that were measured are approximately 241 and 84 mm respectively, which means that the spray plume will not develop freely in the nasal cavity, as it would during the experimental measurements taken in this study. To determine how much of the spray plume is important for the evaluation of nasal drug delivery, a simple illustrative CFD analysis can be performed to contextualize the nasal spray delivery and its formation under application. The nasal cavity model was created from CT scans of a human subject () and has been used in earlier studies by the authors (Inthavong et al. Citation2006, Citation2008). Large droplets (100 μm) with high inertia are delivered with an initial velocity of 15 m/s into the left nasal cavity with a negligible flow rate (0.01 L/min). The 100 μm droplets were chosen for the high inertial property, which retains its velocity and basically travels in a straight line unless it impacts on the nasal surface wall. The initial conditions of the droplets were described based on the shape of the measured spray plume. By tracking the droplets, the wall deposition patterns and the spatial locations of the droplets as they pass through cross-sectional slices labeled A to D can be shown. Three injection angles, 90 , 45 , and 30 , are evaluated for which a user may perform, whereby more horizontal angles can be achieved by tilting the head backward. The results in showed that the spray plume maximum length reached 47 mm for an injection angle of 30 .
FIG. 10 3D visualization of the unaffected experimental spray placed inside a human nasal cavity model. Four cross sections are labeled A, B, C, and D having widths of 8.1, 16.5, 17.1, and 15.3 mm, and heights of 31.3, 42.0, 42.8, and 42.8 mm respectively. Particles of 100 μm diameterare delivered into the nasal cavity at the location denoted by the large black dot just inside the nasal cavity. Subsequent particle deposition onto the nasal cavity walls is marked with small black dots. Particles passing through the cross-sectional slices A–D are also denoted by small black dots.
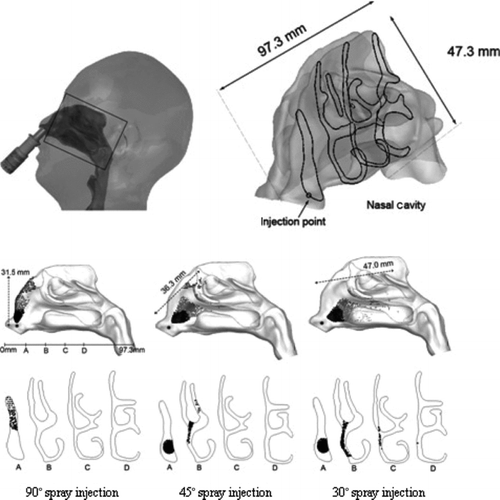
At this length, the measured spray would have a diameter of 22.6 mm (from EquationEquation (4)), which is much larger than the narrow cross sections shown. The spatial locations of the droplets that pass through each slice show that a narrow spray may enhance droplet deposition given the narrow cross sections in comparison with the spray width. There is also potential for an increase in the spray penetration when the spray is more horizontally aligned. While the CFD visualization is highly idealized, it does put into context the spray geometry dimensions in relation to the nasal cavity. Evaluations of nasal spray performance should concentrate on the external and near-field characteristics of the spray up to 50–60 mm from the spray nozzle, and certainly, it would be unnecessary to measure the entire spray plume of up to 240 mm.
Initial Droplet Conditions for CFD Studies of Nasal Spray Drug Delivery
Many commercial CFD codes provide atomization models within the software and their application sometimes requires additional information regarding the atomizer design that may not be known. For practical applications, discrete droplets may be used to represent the atomized spray. For this method, preliminary experimental measurements may be performed to establish the spray characteristics. These characteristics form the basis of the initial droplet conditions that are needed for CFD studies, which includes the spray plume and its velocity profile, and DSDs. A breakup length is observed where the liquid sheet breaks down into droplets. It is this distance from the spray nozzle exit at which droplets should be introduced into the nasal cavity. Furthermore, the spray plume diameter for which the droplets would be randomly distributed over can be determined by EquationEquation (4).
CONCLUSION
A commercial nasal spray device was tested in order to better understand its spray formation and characteristics. Experimental analysis of a continuous spray showed that the spray is characteristic of one that is produced from a pressure-swirl atomizer, which consisted of dense liquid in the near-nozzle region and a breakup of the liquid sheet into droplets. The droplet diameters and spray velocity obtained from PIV and PDIA were characterized by empirical correlations that may be of use for setting the initial boundary conditions in CFD simulations of drug delivery in the nasal cavity. It was shown that there is some variation in the droplet diameters with respect to its radial and axial position from the spray orifice. The width and length of the spray are much larger in scale in comparison with the dimensions of a nasal cavity. This implies that only a narrow segment of the spray actually fits within the narrow cross sections of the nasal cavity. The application of the spray into a human nasal cavity highlighted the inefficiency of a vertically aligned nasal spray, and that perhaps aligning the spray in a more horizontal position may help improve the efficacy of drug delivery, given that the nasal passage is horizontal. Introduction of droplets into the nasal cavity for CFD studies should account for the breakup length and the spray plume diameter for which the droplets would be randomly distributed over. Future studies may involve integrated modeling of the spray within the nasal cavity itself.
REFERENCES
- Black , D. L. , McQuay , M. and Bonin , M. P. 1996 . Laser-Based Techniques for Particle-Size Measurement: A Review of Sizing Methods and Their Industrial Applications . Prog. Energy Combustion Sci. , 22 : 267 – 306 .
- Cheng , Y. S. , Holmes , T. D. , Gao , J. , Guilmette , R. A. , Li , S. , Surakitbanharn , Y. and Rowlings , C. 2001 . Characterization of Nasal Spray Pumps and Deposition Pattern in a Replica of the Human Nasal Airway . J. Aerosol Med. , 14 : 267 – 280 .
- Chung , K. Y. K. , Cuthber , R. J. , Revell , G. S. , Wassel , S. G. and Summer , N. 2000 . A Study on Dust Emission, Particle Size Distribution and Formaldehyde Concentration During Machining of Medium Density Fibreboard . Ann. Occ. Hyg. , 44 : 455 – 466 .
- Crosland , B. M. , Johnson , M. R. and Matida , E. A. 2009 . Characterization of the Spray Velocities from a Pressurized Metered-Dose Inhaler . J. Aerosol Med. Pulm. Drug Deliv. , 22 : 85 – 97 .
- Davis , S. S. and Illum , L. 2003 . Absorption Enhancers for Nasal Drug Delivery . Clin. Pharmacokinet. , 42 : 1107 – 1128 .
- Dayal , P. , Shaik , M. S. and Singh , M. 2004 . Evaluation of Different Parameters That Affect Droplet-Size Distribution from Nasal Sprays Using the Malvern Spraytec . J. Pharm. Sci. , 93 : 1725 – 1742 .
- Dombrowski , N. and Johns , W. R. 1963 . The Aerodynamic Instability and Disintegration of Viscous Liquid Sheets . Chem. Eng. Sci. , 18 : 203 – 214 .
- Fantini , E. , Tognotti , L. and Tonazzini , A. 1990 . Drop Size Distribution in Sprays by Image Processing . Comput. Chem. Eng. , 14 : 1201 – 1211 .
- Flower , W. D. 1927 . The Terminal Velocity of Drops . Proc. Phys. Soc. , 40 : 167
- Foo , M. , Cheng , Y. , Su , W. and Donovan , M. 2007 . The Influence of Spray Properties on Intranasal Deposition . J. Aerosol Med. , 20 : 495 – 508 .
- Ghaemi , S. , Rahimi , P. and Nobes , D. S. 2010 . Evaluation of StereoPIV Measurement of Droplet Velocity in an Effervescent Spray . Int. J. Spray Combustion Dyn. , 2 : 103 – 124 .
- Guo , C. and Doub , W. H. 2006 . The Influence of Actuation Parameters on In Vitro Testing of Nasal Spray Products . J. Pharm. Sci. , 95 : 2029 – 2040 .
- Guo , C. , Stine , K. J. , Kauffman , J. F. and Doub , W. H. 2008 . Assessment of the Influence Factors on In Vitro Testing of Nasal Sprays Using Box-Behnken Experimental Design . Eur. J. Pharm. Sci. , 35 : 417 – 426 .
- Ikeda , Y. , Yamada , N. and Kawahara , N. PIV Application for Spray Characteristic Measurement . Proceedings of the 9th International Symposium on Application of Laser Techniques to Fluid Mechanics . Lisbon , Portugal.
- Intelligent Laser Applications . 2004 . Introduction to VidPIV User Manual , Juelich : Intelligent Laser Applications .
- Inthavong , K. , Tian , Z. F. , Li , H. F. , Tu , J. Y. , Yang , W. , Xue , C. L. and Li , C. G. 2006 . A Numerical Study of Spray Particle Deposition in a Human Nasal Cavity . Aerosol Sci. Technol. , 40 : 1034 – 1045 .
- Inthavong , K. , Tian , Z. F. , Tu , J. Y. , Yang , W. and Xue , C. 2008 . Optimising Nasal Spray Parameters for Efficient Drug Delivery Using Computational Fluid Dynamics . Comput. Biol. Med. , 38 : 713 – 726 .
- Jasuja , A. K. 1979 . Atomization of Crude and Residual Fuel Oils . Trans. ASME J. Eng. Power , 101 : 250 – 258 .
- Kashdan , J. T. , Shrimpton , J. S. and Whybrew , A. 2003 . Two-Phase Flow Characterization by Automated Digital Image Analysis. Part 1: Fundamental Principles and Calibration of the Technique . Part. Part. Sys. Charact. , 20 : 387 – 397 .
- Kim , C. S. and Fisher , D. M. 1999 . Deposition Characteristics of Aerosol Particles in Sequentially Bifurcating Airway Models . Aerosol Sci. Technol. , 31 : 198 – 220 .
- Kimbell , J. , Shroeter , J. D. , Asgharian , B. , Wong , B. A. , Segal , R. A. , Dickens , C. J. , Southall , J. P. and Miller , F. J. 2004 . Optimisation of Nasal Delivery Devices Using Computational Models . Respir. Drug Deliv. , 9 : 1
- Kimbell , J. S. , Segal , R. A. , Asgharian , B. , Wong , B. A. , Schroeter , J. D. , Southall , J. P. , Dickens , C. J. , Brace , G. and Miller , F. J. 2007 . Characterization of Deposition from Nasal Spray Devices Using a Computational Fluid Dynamics Model of the Human Nasal Passages . J. Aerosol Med. , 20 : 59 – 74 .
- Kirkpatrick , M. P. and Armfield , S. W. 2005 . Experimental and Large Eddy Simulation Results for the Purging of Salt Water from a Cavity by an Overflow of Fresh Water . Int. J. Heat Mass Transf. , 48 : 341 – 359 .
- Kublik , H. and Vidgren , M. T. 1998 . Nasal Delivery Systems and Their Effect on Deposition and Absorption . Adv. Drug Deliv. Rev. , 29 : 157 – 177 .
- Lefebvre , A. H. 1983 . Gas Turbine Combustion , Washington , DC : Hemisphere Publishing Corporation .
- Lefebvre , A. H. 1989 . Atomization and Sprays , Washington , DC : Hemisphere Publishing Corporation .
- Liu , H. 2000 . Science and Engineering of Droplets—Fundamentals and Applications , Norwich , NY : William Andrew Publishing/Noyes .
- Liu , X. , Doub , W. H. and Guo , C. 2010 . Evaluation of Droplet Velocity and Size from Nasal Spray Devices Using Phase Doppler Anemometry (PDA) . Int. J. Pharm. , 388 : 82 – 87 .
- Liu , Y. , Matida , E. A. , Gu , J. and Johnson , M. R. 2007 . Numerical Simulation of Aerosol Deposition in a 3-D Human Nasal Cavity Using RANS, RANS/EIM, and LES . J. Aerosol Sci. , 38 : 683 – 700 .
- Radcliffe , A. , ed. 1960 . Fuel Injection , Princeton , NJ : Princeton University Press .
- Shi , H. W. , Kleinstreuer , C. and Zhang , Z. 2007 . Modeling of Inertial Particle Transport and Deposition in Human Nasal Cavities with Wall Roughness . J. Aerosol Sci. , 38 : 398 – 419 .
- Suman , J. D. , Laube , B. L. , Lin , T. C. , Brouet , G. and Dalby , R. 2002 . Validity of In Vitro Tests on Aqueous Spray Pumps as Surrogates for Nasal Deposition . Pharma. Res. , 19 : 1 – 6 .
- Tian , Z. F. , Inthavong , K. and Tu , J. Y. 2007 . Deposition of Inhaled Wood Dust in the Nasal Cavity . Inhal. Toxicol. , 19 : 1155 – 1165 .
- Wen , J. , Inthavong , K. , Tu , J. Y. and Wang , S. 2008 . Numerical Simulations for Detailed Airflow Dynamics in a Human Nasal Cavity . Respir. Physiol. Neurobiol. , 161 : 125 – 135 .
- Whybrew , A. , Nicholls , T. R. , Boaler , J. J. and Booth , H. J. Diode Lasers—A Cost Effective Tool for Simultaneous Visualisation, Sizing, and Velocity Measurements of Sprays . Proceedings of the 15th Annual Conference on Liquid Atomization and Spray Systems . Toulouse , France.
- Williams , T. J. , Gilles , J. C. and Murphy , S. Velocity Profiling of Sprays from Pharmaceutical Nasal Spray Pumps . Paper presented at the annual meeting of Respiratory Drug Delivery Europe . Lisbon , Portugal.
- Yule , A. J. , Cox , N. W. and Chigier , N. A. 1978 . “ Measurement of Particle Size in Sprays by the Automated Analysis of Spark Photographs ” . In Particle Size Analysis , Edited by: Groves , M. J. 61 – 73 . London : Heyden .
- Zhou , Y. and Cheng , Y. S. 2005 . Particle Deposition in a Cast of Human Tracheobronchial Airways . Aerosol Sci. Technol. , 39 : 492 – 500 .
