Abstract
The droplet collision algorithm of O’Rourke has been considered as the standard approach of droplet collision calculations. This model is based on the assumption that those droplets within a parcel are distributed uniformly in a single computational cell and also other parcels are considered to be collision partners only if they are located in the same cell. Hence, it has a problem of mesh dependency for the calculation of collision rate resulting obviously from the block of collision by cell boundaries and droplet density distortion when the average parcel number per cell, ψ, is small. This can cause an unacceptable computational expense for engineering applications. To overcome the above problem, the present study establishes a new mesh-independent collision model based on the adaptation of the volume in which droplets within a parcel are uniformly distributed and the corresponding space for search of the collision partners. The new model is found valid over a wide range of ψ. The collision rate calculated from it agrees well with O’Rourke's model for large ψ and remains virtually invariable with ψ. This allows an appropriate calculation to use significantly less parcels and thus less time. Such an advantage of the new model is confirmed in its application to a three-dimensional (3D) case. The 3D calculation also suggests that fine particles tend to agglomerate where the fluid flow direction changes rapidly and in between two eddies where they interact with each other.
Copyright 2012 American Association for Aerosol Research
1. INTRODUCTION
Many industrial processes emit hazardous, and inhalable, particles into the atmosphere. As these fine particles can enter the human respiratory system, they pose a significant danger to public health. This issue has thus received increased attention (Thurston and Spengler Citation1985; Vedal et al. Citation1998; Pope et al. Citation2002; Englert Citation2004). With the aerodynamic diameter <10 μm (PM10), the inhalable particulate matter follows air streams very well and so is difficult to be removed. Ordinary industrial particle filtration devices, e.g., electrostatic precipitator, Venturi scrubber, bag-type dust collector, and cyclone dust collector, either provide a low removal efficiency of fine inhalable particles with aerodynamic diameter <2.5 μm (PM2.5), especially ultrafine particles (UF, PM0.1), or are highly energy-consuming(Li et al. Citation2007).
Particle (droplet) collision and coalescence method has been identified as a potential and efficient way to help existing dust filters remove inhalable particles (Sun and Guo Citation2010). It was reported to have an important effect on particle size distribution (Reade and Collins 2000). Agglomerators are such new technologies being developed. Agglomerators are in general placed upstream from the primary capture device and seek to promote the agglomeration of small particles to larger particles. In this way, the “agglomerated” fine particles will be removed with the large particles by the primary filter. These devices include the sieving electrostatic precipitator (Pasic et al. Citation2006) and the Indigo agglomerator (Truce et al. Citation2006) for coal-fired power-plant boilers. However, due to limitations in the spatial and temporal resolution of most experiments, direct measurement of, e.g., the collision rates between particle classes is not yet feasible. It follows that no data has been available for design optimization and the extension of agglomerators to new applications. The numerical simulation has therefore become an important tool for design of these devices together with the particle-removing apparatus and for prediction of the removal efficiency. In this context, numerical models of simulation are required to be developed appropriately. The present work is conducted for this end.
In application, droplet collision models can be used to estimate inhalable particulate collision properties efficiently. However, droplet collisions are difficult to model since numerical problems generally affect the prediction of the occurrence of collision, while physical uncertainties cause errors in the outcomes of collision (Hou and Schmidt Citation2006). Despite this, the general Monte Carlo sampling of droplets is widely used in droplet collision models, because it allows only a subset of droplets to be tracked, known as parcels, to statistically represent the larger population.
Dealing with droplet collisions during an evaporating spray process, a stochastic approach to collision was proposed by O’Rourke (Citation1981) with a probability-based algorithm, which has long been considered the standard approach to achieve spray collision simulations. However, this method manifests serious mesh dependency in both the density and the types of meshes (Schmidt and Rutland Citation2000; Li et al. Citation2006) in spray simulation and is time-consuming (Schmidt and Rutland Citation2000). Schmidt and Rutland (Citation2000) used the NTC (no time counter) method to establish a model with linear computational cost. By using a separate randomly aligned collision mesh based on a polar coordinate system, this model was able to reduce its mesh dependency. Later, Hou and Schmidt (Citation2006) further improved this model by adaptively refining the mesh according to local parcel number density every time step. However, the existence of two sets of grid may cause difficulty in momentum coupling between two phases and the collision mesh would need additional space to store and extra time to adapt every time step. Numerical results of Li et al. (Citation2006) show that the NTC model is also mesh-dependent. In addition, random parcel sampling may lead to unconserved momentum.
The essential problem of O’Rourke's numerical model is the assumption that parcels can collide only within the same cell, which prevents the colliding between parcels very close to each other but in different cells. It also assumes that droplets are uniformly distributed within the cell when calculating the probability of collision. This widely used approach is sound only when the average parcel number per cell, denoted by ψ, is big enough. In fact, when ψ ≈ 1 or even smaller, the cell boundary effect, which blocks parcels in different cells from colliding and the droplet density misrepresentation or distortion, would significantly affect the collision calculation. (This effect can be seen from the test cases presented late.) However, in engineering applications, the gas phase cell size is required to be small so as to precisely simulate the flow field. This will lead to a large number of computational cells and thus an unacceptable time expense with large ψ. Hence, there is a need of such a collision model that is valid for very small ψ.
Apart from the collision mesh adaptation method derived by Schmidt and Rutland (Citation2000), several other methods were explored to reduce the mesh dependency. Bauman (Citation2001) developed the Proximity Collision Model, which examines each pair of parcels located within a distance between each other to determine if a collision occurs. However, a proper collision radius, r coll, is usually hard to decide and hence this model assumes that the droplets are uniformly distributed within a sphere with constant user-defined radius r coll instead of the gas phase cell itself as in O’Rourke's model. The effect on collision calculation is thus ambiguous. Later, Li et al. (Citation2006) developed a model based on the idea of SPH (smoothed particle hydrodynamics) method by considering only the nearest N 0 parcels of each other as collision partners. Here, the collision probability calculation is also based on the relative distance of the collision partners instead of their relative velocities. Although this method excludes the factors of mesh dependency, it treats all the droplets within a parcel as a simple particle that ignores the droplet distribution and droplet density on the collision probability. Hieber (Citation2001) proposed the VFC (liquid void fraction compensation) method to compensate for the lack of spatial resolution by correcting the droplet density in each cell according to a predetermined average liquid void fraction computed at each time step. The VFC method considers only those cells that are partially filled and thus shrinking the cell volume in calculating the collision probability by a factor ≥1. However, it does not manipulate those cells that are overfilled. In addition, since the supposed calculating volume of the droplets within a parcel is changed, the space to search its collision partners should also be changed, and thus, still searching within the entire cell would bring in additional inaccuracy. Ting (Citation2006) developed an intra-parcel collision model to eliminate the mesh dependency. By an intra-parcel approach, Ting assumes that collision occurs only among the droplets within the same parcel. By eliminating the effect of grid boundary on collisions, simultaneously it also excludes the collisions taking place between parcels, which leads to a misrepresentation of droplet collision rate. Moreover, this method is still susceptible to droplet density distortion.
In this paper, a new mesh-independent droplet collision model is established based on the adaptation of the volume in which droplets within a parcel are uniformly distributed and the corresponding space for search of the collision partners. Several test cases of a two-dimensional (2D) rectangular domain are provided to demonstrate the mesh dependency in collision calculation of O’Rourke's method and to evaluate this new model. The application of this model is also performed to the three-dimensional (3D) agglomeration chamber of Sun and Guo (Citation2010), with the predicted removal efficiency being compared with the experimental data. Based on the comparison, some suggestions are provided for further apparatus improvement.
2. MATHEMATICAL MODEL
In the present study, the Eulerian approach is used to describe the gas phase, while the dispersed phase is described by the Lagrangian approach.
2.1. Governing Equations
The governing equations of the 3D, time-dependent and incompressible viscous turbulent flow are the continuity and Navier–Stokes equations:
2.2. Particle Motion
A discrete phase model is used to simulate the particle motion, which is governed by Newton's law of motion. The trajectory of a discrete particle is predicted by integrating the force balance on the particle, which is written in Lagrangian reference frame. The particle motion equation can be written as follows:
In (4), C
D is the drag coefficient defined as ![]() , where a
1, a
2, and a
3 are constants that apply to smooth spherical particles over several ranges of Re, given by Morsi and Alexander (Citation1972).
, where a
1, a
2, and a
3 are constants that apply to smooth spherical particles over several ranges of Re, given by Morsi and Alexander (Citation1972).
2.3. General Form of Collision Model
The general form of the stochastic collision model derived by O’Rourke (Citation1981) is used here. According to O’Rourke, the probability of collision of two droplets is derived from the point of view of the droplet with a larger diameter called the collector and identified below with the subscript 1, while the smaller droplet is identified with the subscript 2. In addition, parcel 1 consists of n 1 collector droplets of identical properties, and parcel 2 consists of n 2 smaller droplets.
The droplets within a parcel are assumed to be uniformly distributed in the cell where the parcel is currently located. Thus, the probability of a collector colliding with a smaller droplet can be given by:
Two uniform random numbers, range in [0, 1], are assigned to determine the collision outcome and the number of collisions the collector undergoes. A first random number X is assigned only if X is larger than P(0) = ![]() so that a collision can take place. A second random number Y is assigned if a collision happens. If the value of the actual collision parameter, b, defined as
so that a collision can take place. A second random number Y is assigned if a collision happens. If the value of the actual collision parameter, b, defined as ![]() is smaller than the critical offset, b
crit, defined as
is smaller than the critical offset, b
crit, defined as
In the case where coalescences take place, the actual coalescence number, N, is determined by the inequality P(N – 1) ≤ X < P(N). To simulate the turbulent effect on collision rate, a random walking model was used to tracking the parcels.
2.4. New Mesh-Independent Collision Model
In this model, we use a physically reliable volume, measured by V pr, instead of the continuous-phase cell volume V and assume that droplets are uniformly distributed in a sphere of volume equal to V pr, with the parcel position as its center rather than distributed uniformly in the cell where the parcel is located; thus, the search of collision partners is also conducted within the new volume in place of the confined space of a single cell.
Based on the fact that the droplet density is often mistaken or distorted when ψ ≈ 1, we assume that there is a physically reliable number density c pr of the droplets within a parcel. Hence, the physically reliable distribution volume V pr can be obtained as V pr=n/c pr=cV/c pr, where n is the droplet number in parcel, and c is the droplet number density when it is assumed to be confined by the cell boundary.
There are several methods to obtain the physically reliable droplet density. For the test cases below, an averaging method is used to achieve c
pr. The parcel information of both the current cell and its surrounding cells are used together to calculate c
pr, i.e., ![]() , where loc denotes the local cells within a distance of l to the current cell. l is a predetermined length scale functioning similar to the mean free path length that confines the averaging and searching process to be local, thus reducing extra time expense. In particular, l can be estimated by the equivalent cell side length when ψ = 10. For ψ ≥ 10, as shown later, no significant effect of cell size occurs on collision rate calculation in O’Rourke's model. l should not be smaller than this recommended value to obtain the physically reliable droplet density. If l is increased, the time duration of searching will increase for possible collision partners when the physically reliable droplet density is kept nearly constant. If c
pr ≤ c, the volume that a parcel occupies is enlarged and thus more collision partners exist. If c
pr > c, the volume that a parcel occupies is shrunk and less collision partners will be found.
, where loc denotes the local cells within a distance of l to the current cell. l is a predetermined length scale functioning similar to the mean free path length that confines the averaging and searching process to be local, thus reducing extra time expense. In particular, l can be estimated by the equivalent cell side length when ψ = 10. For ψ ≥ 10, as shown later, no significant effect of cell size occurs on collision rate calculation in O’Rourke's model. l should not be smaller than this recommended value to obtain the physically reliable droplet density. If l is increased, the time duration of searching will increase for possible collision partners when the physically reliable droplet density is kept nearly constant. If c
pr ≤ c, the volume that a parcel occupies is enlarged and thus more collision partners exist. If c
pr > c, the volume that a parcel occupies is shrunk and less collision partners will be found.
It is worth noting that Bauman (Citation2001) used in his Proximity Collision Model the constant collision radius, which is hard to define properly. In comparison, the new model uses a well-defined self-adjustable collision volume instead. The physically reliable collision volume is self-adjustable according to the local droplet density and the average number of collision partners within this volume can give an upper limit, say 10. Thus, the new model has reduced the time expense of searching collision partners, within a separate collision volume, from an N 2 problem to a constant value. Further, for the case of ψ ≈ 1, O’Rourke's model does not work correctly, although it needs less time in searching parcels than the new model. To get a reliable result with the same mesh setting, O’Rourke's model requires ψ to be raised to ψ = 10 at least. This means that there are much more parcels in the calculation domain and consequently that the corresponding tracking and searching time is much longer than when using the new model. A comparison of the total time taken by the two models in a 3D case, to be given below in Section 3.3.3, clearly demonstrates the advantage of the new model.
3. RESULTS AND DISCUSSION
3.1. Numerical Analysis
The numerical solution is obtained using the pressure-based finite-volume scheme implemented in the commercial software package, FLUENT (Fluent Inc. Citation2006). Pressure-velocity coupling is accomplished through the SIMPLE algorithm. The standard k-ϵ model is used to calculate the turbulent flow field. Stochastic particle tracking with random eddy lifetime is implemented with the discrete phase model. The collision models are implemented as user-defined functions of FLUENT, and particle continuous-phase interaction is enabled.
3.2. Two-Dimensional Test Cases
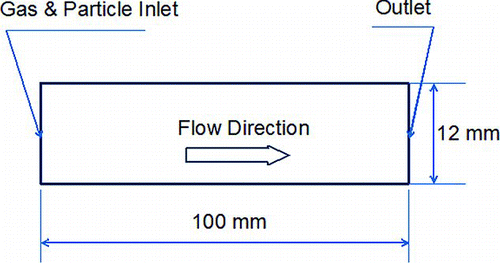
The computational domain is rectangular, 100 mm × 12 mm (), discretized into quadrilateral elements. The inlet boundary is set to be the velocity-inlet boundary with a fluid velocity of 1 m/s, and the outlet boundary is designated as a pressure-outlet boundary. The particle tracking time step is 0.0002 s, and at each time step, five parcels with the droplet diameter of 1 μm are released at a random position of the inlet. The droplet mass flow rate is 0.0001 kg/s, and the droplet surface tension is set to be 0.03 N/m, and its density is 2000 kg/m. A total of eight test cases with different cell sizes or different values of ψ are implemented to check the collision rate, as listed in . The average parcel number per cell in is calculated based on the assumption that there are 1800 parcels, typical for the control case, in the entire computational domain, while in the real test cases, this number can vary in a certain range.
TABLE 1 Test case size information
FIG. 1 Computational domain of test cases. (Color figure available online.)
3.2.1. Results
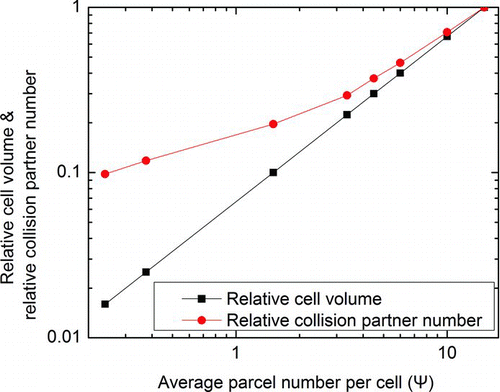
A time interval of 0.3 s is used for each test case to record the number of collisions between parcels, and the results against ψ is shown in for both O’Rourke's model and the new model. It is demonstrated clearly that as ψ increases, the collision number obtained from the new model remains nearly constant, while that from O’Rourke's model decreases. To further demonstrate the problem of O’Rourke's model when ψ is small, the average number of collision partners, relative to the control group, detected in each time step is presented in , together with the relative cell volumes of the eight test cases. Evidently, as ψ decreases, both the relative average number of collision partners and the cell volume decrease. However, the variations occur at different rates.
FIG. 2 Number of collisions taking place in 0.3 s against ψ. (Color figure available online.)
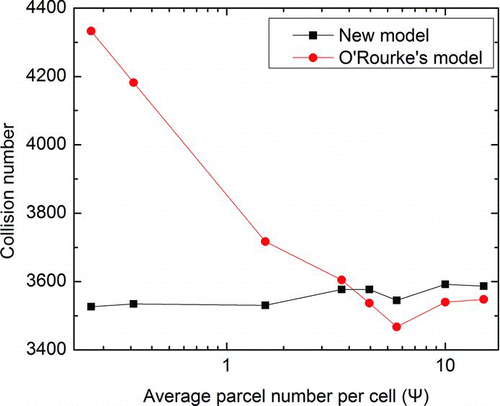
FIG. 3 Relative cell volumes and collision partner numbers against ψ, in the log-log form, for O’Rourke's model. (Color figure available online.)
3.2.2. Discussion
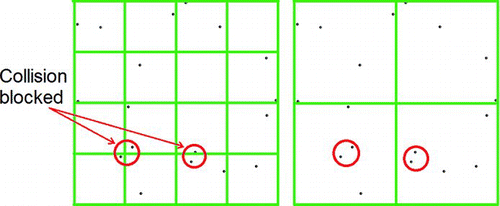
In general, there are two factors that may affect the accuracy of the collision rate calculation when ψ ≈ 1 in O’Rourke's model. One is the block of collision between parcels which are close in space but located in two adjacent cells and the other is the distortion of droplet density caused by the small size of the computational cell, both of which significantly change the collision rate in different directions.
As shown in , when the parcels are relatively homogeneously distributed in the whole domain but the cell size is reduced to an extent that ψ ≈ 1, collisions are almost totally blocked, thus leading to a significant underestimation of the collision rate.
FIG. 4 Mesh dependency: block of collisions. (Color figure available online.)
However, it is not always the case of homogeneous distribution when ψ is small. An extreme example is shown in . From a statistical perspective, the cell size should be sufficiently large (ψ >> 1) to include enough parcels to properly represent the droplet density; otherwise, when ψ is too small, especially ψ ≈ 1, the droplet density will be highly mistaken for calculation. Also, for the case with smaller cell size, as shown in , a collision rate relatively larger by ∼300% will result from O’Rourke's model.
FIG. 5 Mesh dependency: density distortion. (Color figure available online.)
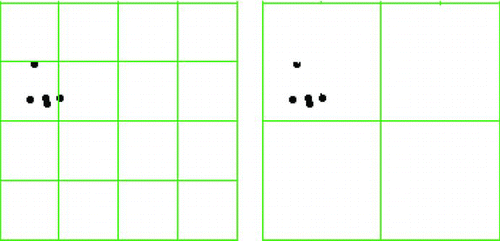
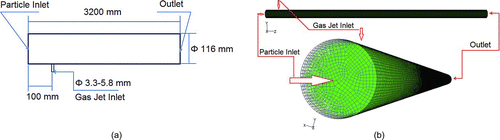
FIG. 6 3D particle agglomeration chamber: (a) schematic diagram with dimensions; (b) grid distribution of calculation. (Color figure available online.)
While the above two factors are both of great importance to the grid dependency of the collision models, shows that the cell volume plays a more important role in O’Rourke's model. For ψ ≤ 1, as ψ decreases, the relative cell volume decreases at a rate greater than that of the relative overall number of collision partners at each time step. According to Equations (6) and (7), this means that the collision probability of a pair of parcel increases more rapidly than the decrease of the number of collision partners for O’Rourke's model. As a result, see , the collision rate is significantly overestimated when ψ is small for O’Rourke's model.
On the contrary, the collision rate almost remains constant for the new collision model, as seen in . When ψ > 3, the collision rate estimated by the new model is close to that of O’Rourke's model. This, in return, further validates the new model for predicting the collision rate. In fact, because the new model uses the parcel information in nearby cells determined by a length scale rather than a single cell, the droplet density is statistically reliable and independent of the cell size. Moreover, by searching the collision partners within the physically reliable volume occupied by the parcel, there is no block problem of the cell boundary and the number of collision partners is thus reliable.
3.3. Three-Dimensional Case of Application
Similar results have also been obtained in 3D test cases. Instead of presenting the same results, an application of the new mesh-independent model for 3D cases is given in this section, as the major goal of the collision model is to help evaluate and design real particle agglomeration and removal apparatus.
A lab-scale setup to study the removal efficiency of particle collision was developed in the previous work of Sun and Guo (Citation2010). The main part of the device is a round particle agglomeration chamber with an inner diameter of 116 mm and a length of 3.2 m, and a round jet nozzle with an inner diameter varying from 3.3 mm to 5.8 mm was fixed at 100 mm from the inlet side of the chamber, as shown in .
3.3.1. Numerical Treatment
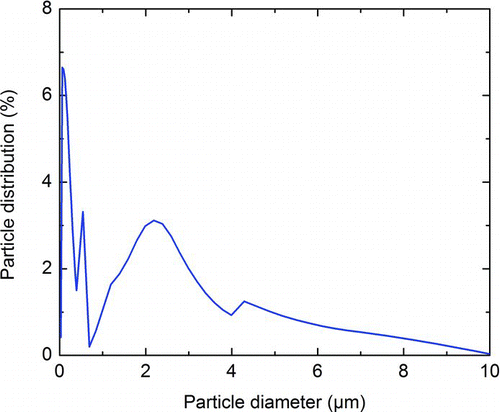
In the numerical simulation, the jet nozzle is set to be perpendicular to the chamber with an exit diameter of 5 mm. The domain is discretized into about 323,000 hexahedral elements with a minimum size of 5 mm (as shown in ). The inlet boundaries are set to be the inlet boundary of particle-laden stream with a constant velocity of 0.22 m/s and the gas-jet inlet boundary with a velocity of 21.5 m/s. A constant pressure across the chamber outlet is set to be the outlet boundary for simulations. The particle tracking time step is 0.01 s, and at each time step, 25 parcels with the droplet diameter randomly selected from a predetermined distribution are released at a random position of the particle inlet. The droplet mass flow rate is set to be 1.58×10⁻⁵ kg/s so that the overall particle mass concentration is 6.8 g/m3, and the droplet surface tension and density is set to be 0.03 N/m and 1838 kg/m3, respectively. With this setting, we try to best mimic the experimental parameter of Sun and Guo (Citation2010). Unfortunately, however, Sun and Guo did not provide the particle diameter distribution, and so we have to use the present measurement of the fly-ash particles from a power plant measured by electrical low-pressure impactor (ELPI). shows the PM10 distribution of the fly-ash particles; an extension to the diameter of 25 μm is implemented according to the median diameter in Sun and Guo (Citation2010).
FIG. 7 Particle diameter distribution employed in the 3D application. (Color figure available online.)
3.3.2. Turbulent Effect
Turbulence plays a very important role in the collision rate of real large-scale devices. So, to gain a better result, the collision kernel Γ in Equation (7) is replaced with a bidisperse EPI (eddy-particle interaction) turbulent collision kernel Γ 12 developed by Zhou et al. (Citation2001), viz.
3.3.3. Results and Discussion
After the calculation became steady, a sample of nearly 30 s was carried out at the particle inlet and outlet of the agglomeration chamber to compute the particle removal efficiency of each diameter stage. The numerical results from the new model and O’Rourke's model are shown in , both of which use the turbulent collision kernel, i.e., Equation (12). The experimental result of Sun and Guo (Citation2010) under a similar condition is also shown for comparison.
FIG. 8 Removal efficiency. (Color figure available online.)
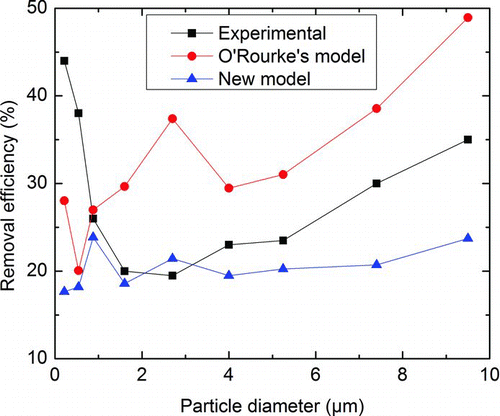
Evidently, the prediction of the new model matches well with the experimental result for the particle diameter varying from d p = 1 μm to d p = 4 μm. When d p > 4 μm, the calculated removal efficiency is lower than the measured value and the difference becomes more significant as d p increases. In comparison, for d p > 1 μm, O’Rourke's model predicts a removal efficiency which is always much higher than that from the new model and also the experimental result. However, for those ultrafine particles at d p < 1 μm, there is a considerable discrepancy for both models. One of the possible reasons for this is that the EPI turbulent collision kernel is mainly developed based on large particle inertia, i.e., τ p is on the order of T e. For d p < 1 μm, since the particle response time τ p is well below the Kolmogorov time scale τ k, the accumulation effect is significant and thus must be embodied in the collision kernel Γ12, i.e., it should be modified to be more effective for any particle inertia. The complex and integrate kernel developed by Zhou et al. (Citation2001) and Zaichik et al. (Citation2006, Citation2010) could be more effective and thus should be tried in future simulations. Other factors may also account for the discrepancy. For instance, the mesh used in this 3D application is relatively rough for an accurate fluid field, which is important in collision rate calculation. Apart from the turbulent effect, other mechanisms such as gravitational settling, Brownian diffusion, and Van der Waals attraction should also be considered for a better simulation of PM2.5 collisions. On the other hand, it is very important to have accurate experimental measurements to verify this data set, which have not been reported yet. An inlet particle diameter distribution is especially needed as a critical input of the simulation.
Despite the discrepancy above, the new mesh-independent model has proved its efficacy in the 3D application and significantly reduced the total time of simulation. Although the mesh is rough, due to large dimension of the agglomeration chamber, the mesh number is still more than 300,000. If a previous collision model such as O’Rourke's model is used, the value of at least ψ = 10 should be maintained for relative accurate results according to our tests above. For example, the recommended value of ψ in previous study of Schmidt and Rutland (Citation2000) is 20, i.e., at least five millions parcels would be tracked at every time step in calculation; our estimate from some tests indicates that the time duration for the complete simulation by O’Rourke's model using currently mainstream personal computers (e.g., Lenovo Y450A-TSI, CPU Intel Core 2 Duo T6500 2.1GHz, RAM 2GB) is well beyond 104 hours! On the other hand, the simulation using the new model requires only about 25,000 parcels in the total computational domain, and the total time needed is much less, i.e., 1/200 or 0.5% of that from the use of O’Rourke's model. Hence, the time cost and accuracy of the new model are both acceptable for engineering use.
3.3.4. Hydrodynamic Agglomeration
Agglomeration of particles depends strongly on their collision. So, the particle agglomeration aspects may be deduced from the above 3D calculation. Most of the collisions are found to take place around the side gas jet, so our observation is made over there with front, top, and side views from the chamber.
Figures S1–S3 (available online as supplementary information) show contours of particle concentration, turbulent intensity, and collision number in the cross-section through the nozzle axis of the gas jet, on the chamber wall around the gas jet inlet, and in the central y-z plane through the nozzle axis of the gas jet, respectively. These plots clearly indicate a strong correlation of particle collision number with particle concentration and turbulent intensity. Evidently, collision takes place most frequently where both the turbulent intensity and the particle concentration are high. However, neither the particle concentration nor the turbulent intensity can determine the collision frequency on its own. This can be clarified by several existing regions, indicated with a red circle, where only one parameter is high but no significant collision happens. Apparently, the turbulent intensity is high in the gas jet region, while the particle concentration is high due to the hydrodynamic aggregation. It is also important to note from Figures S1c–S3c that particles tend to cluster and collide where the particle-laden fluid flow changes direction rapidly. The corresponding regions are naturally with high turbulent intensity and particle concentration.
It is therefore deduced that fine particles often agglomerate to large particles in regions where fine particle concentration and turbulent intensity are both high. This frequently happens near the wall, the corner, and the region where two large eddies meet. One possible improvement of the 3D apparatus of current investigation might be through adding more small gas jets along the chamber length, since the highest collision rate happens closely behind the gas jet inlet, see Figures S1c–S3c. Hence, the designers of future agglomerators should consider their apparatus to have as many regions as possible where high particle concentration and high turbulent intensity occur simultaneously so as to improve the removal efficiency of fine particles by the downstream dust filtration devices.
4. CONCLUDING REMARKS
The model of O’Rourke is widely regarded as the standard approach of droplet collision calculations and is used in commercial software packages. However, this model has a problem of mesh dependency because it is based on the assumption that those droplets within a parcel are distributed uniformly in a single computational cell and also other parcels are considered to be collision partners only if they are located in the same cell. When the average parcel number per cell, ψ, is small, the use of this model can cause an unacceptable computational expense for complex engineering applications.
In response to the above, the present study has established a new mesh-independent model using an adaptable volume to calculate the collision probability and to search for collision partners. The 2D numerical tests have demonstrated that the new model is valid over a wide range of ψ. For large ψ, the collision rate obtained from it agrees well with that from O’Rourke's model. For small ψ, even less than 1.0, the collision rate from the new model remains nearly unchanging, as it should do, in contrast to the great overestimation by O’Rourke's model. Importantly, this is especially useful in engineering applications because the time of tracking parcels reduces significantly, while a high accuracy maintains in calculations of the flow field and collision rate.
Moreover, the present simulation of the 3D case shows that the particle collision rate is high where the particle concentration and the turbulence intensity are both high. It is thus suggested that fine particles should agglomerate to large particles more efficiently in the region where the fluid flow direction changes rapidly (e.g., near wall, around corners, etc.) or in between two eddies where they interact with each other. In other words, a particle agglomerator is expected to be very helpful in assisting the downstream dust filter(s) to collect fine particles if it can produce as many regions as possible where both high turbulent intensity and high particle concentration occur simultaneously.
NOMENCLATURE
| b | = |
Collision parameter |
| b crit | = |
Critical offset |
| c | = |
Droplet number density (m−3) |
| C D | = |
Drag coefficient |
| d | = |
Diameter (m) |
|
| = |
Diameter of collision circle (m) |
| Δt | = |
Time step (s) |
| F | = |
Additional acceleration force (m·s−2) |
| F b | = |
Unit body force (m·s−2) |
| g | = |
Acceleration of gravity (m·s−2) |
| l | = |
Length scale (m) |
| m | = |
Parcel mass (kg) |
| n | = |
Droplet number in parcel |
| N | = |
Collision number |
|
| = |
Average collision number |
| p | = |
Pressure (N·m−2) |
| P1,P(N) | = |
Probability |
| r | = |
Droplet radius (m) |
| Re | = |
Relative Reynolds number |
| t | = |
Time (s) |
| T | = |
Eddy lifetime (s) |
| T e | = |
Flow integral time (s) |
| u’ | = |
Turbulent RMS fluctuation velocity (m·s−1) |
| v, v | = |
(Fluid) Velocity (m·s−1) |
| v rel | = |
Droplet relative velocity (m·s−1) |
| V | = |
cell volume (m3) |
| We | = |
Collisional Weber number |
| X,Y | = |
Uniform random number |
Greek
|
| = |
Average dissipation rate of kinetic energy (m2·s−3) |
| ψ | = |
Average parcel number per cell |
| Γ, Γ12 | = |
Collision kernel (m3·s−1) |
| η | = |
|
| μ | = |
Dynamic viscosity (N·s·m−2) |
| ν | = |
Kinetic viscosity (m2·s−1) |
| ρ | = |
(Fluid) Density (kg·m−3) |
| τ k | = |
|
| τ pi | = |
Particle inertial response time (s) |
Subscript
| i (= 1,2) | = |
Parcel 1, parcel 2 |
| p | = |
Particle/droplet |
| pr | = |
Physically reliable |
| rel | = |
Relative |
uast_a_649809_sup_23351744.zip
Download Zip (1.6 MB)Acknowledgments
This work was supported by the Natural Science Foundation of China (grant no. 50876001, 50706001) and also by the Ministry of Science and Technology of China through an 863 project (grant no. 2007AA05Z300).
[Supplementary materials are available for this article. Go to the publisher's online edition of Aerosol Science and Technology to view the free supplementary files.]
Related Research Data
REFERENCES
- Bauman , S. D. 2001 . A Spray Model for an Adaptive Mesh Refinement Code , Madison , WI : University of Wisconsin-Madison . Ph.D. thesis
- Englert , N. 2004 . Fine Particles and Human Health – A Review of Epidemiological Studies . Toxicol Lett. , 149 : 235 – 242 .
- Fluent Inc . 2006 . FLUENT 6.3 User's Guide , Lebanon , NH : Fluent Inc. .
- Hieber , S. E. 2001 . An Investigation of the Mesh Dependence of the Stochastic Discrete Droplet Model Applied to Dense Liquid Sprays , Houghton , MI : Michigan Technological University . Master's thesis
- Hou , S. and Schmidt , D. P. 2006 . Adaptive Collision Meshing and Satellite Droplet Formation in Spray Simulations . Int. J. Multiphas. Flow , 32 : 935 – 956 .
- Li , Q. , Cai , T.-m. , He , G.-q. and Hu , C.-b. 2006 . Droplet Collision and Coalescence Model . Appl. Math. Mech. , 27 : 67 – 73 .
- Li , Y.-l. , Li , J. , Li , J.-x. , Liang , W.-j. and Jin , Y.-q. 2007 . Technological and Economical Analysis on Particle Removing . J. China Coal Soc. , 32 : 1196 – 1200 .
- Morsi , S. A. and Alexander , A. J. 1972 . An Investigation of Particle Trajectories in Two-Phase Flow Systems . J. Fluid Mech. , 55 : 193 – 208 .
- O’Rourke , P. J. 1981 . Collective Drop Effects on Vaporizing Liquid Sprays , Princeton , NJ : Ph.D. thesis, Princeton University .
- Pasic , H. , Khan , Z. H. and Ridgeway , R. 2006 . Sieving Electrostatic Precipitator . Paper presented at the 10th International Conference on Electrostatic Precipitation, ICESP X, Cairns, Australia, 25–29 June, Paper 12B1
- Pope , C. A. III , Burnett , R. T. , Thun , M. J. , Calle , E. E. , Krewski , D. Ito , K. 2002 . Lung Cancer, Cardiopulmonary Mortality, and Long-Term Exposure to Fine Particulate Air Pollution . JAMA , 287 : 1132 – 1141 .
- Reade , W. C. and Collins , L. R. 2000 . A Numerical Study of the Particle Size Distribution of an Aerosol Undergoing Turbulent Coagulation . J. Fluid Mech. , 415 : 45 – 64 .
- Schmidt , D. P. and Rutland , C. J. 2000 . A New Droplet Collision Algorithm . J. Comput. Phys. , 164 : 62 – 80 .
- Sun , D. and Guo , Q. 2010 . Effect of Gas Jet on Agglomeration of Inhalable Particles . Int. J. Chem. Reactor Eng. , 8 : S4
- Thurston , G. D. and Spengler , J. D. 1985 . A Quantitative Assessment of Source Contributions to Inhalable Particulate Matter Pollution in Metropolitan Boston . Atmos. Environ. , 19 : 9 – 25 .
- Ting , F. C. 2006 . Intra-Parcel Collision Model , Houghton , MI : Michigan Technological University .
- Truce , R. J. , Wilkins , J. W. , Crynack , R. and Harrison , W. 2006 . “ Enhanced Fine Particle Collection Using the Indigo Agglomerator ” . Cairns , , Australia Paper presented at the 10th International Conference on Electrostatic Precipitation, ICESP X, 25–29 JunePaper 6A2
- Vedal , S. , Petkau , J. , White , R. and Blair , J. 1998 . Acute Effects of Ambient Inhalable Particles in Asthmatic and Nonasthmatic Children . Am. J. Respir. Crit. Care Med. , 157 : 1034 – 1043 .
- Zaichik , L. I. , Alipchenkov , V. M. and Avetissian , A. R. 2006 . Modelling Turbulent Collision Rates of Inertial Particles . Int. J. Heat Fluid Flow , 27 : 937 – 944 .
- Zaichik , L. I. , Simonin , O. and Alipchenkov , V. M. 2010 . Turbulent Collision Rates of Arbitrary-Density Particles . Int. J. Heat Mass. Trans. , 53 : 1613 – 1620 .
- Zhou , Y. , Wexler , A. S. and Wang , L.-P. 2001 . Modelling Turbulent Collision of Bidisperse Inertial Particles . J. Fluid Mech. , 433 : 77 – 104 .