Abstract
A strategy for examining the dynamic hygroscopic response of single aerosol particles is reported, allowing a direct investigation of the interplay of thermodynamic and kinetic factors regulating the time dependence of particle size. In particular, we investigate the rapid evaporation of water from water–glycerol droplets, measuring the evolving size with a time resolution of <10 ms (with as low as 2.5 ms being possible) over a time range from subsecond to many hours. Measurements can be made on sequential droplets generated from a droplet-on-demand generator, and a reproducibility of better than ±0.25 μm in droplet size over tens of events can be achieved at any resolved time point considered during an evaporation process lasting >2 s. The time-dependent measurements of evolving droplet size are compared with an analytical treatment of the evaporation process. Excellent agreement between measurements and simulations is found over a wide range of starting droplet compositions. The benefits of using this approach for investigating water transport within the bulk of an aerosol particle or to/from the droplet surface are discussed.
Copyright 2012 American Association for Aerosol Research
1. INTRODUCTION
Aerosol particles are associated with many areas of research and are important in a range of scientific, medical, and industrial disciplines. The rate of mass and heat transfer during evaporation and condensation is an area of particular interest. The coupling of the heat and mass transfer determines the time-dependent response in the size of a particle to changes in temperature, humidity, and chemical environment, and is governed by the interaction between the condensed particle phase and the gas phase. Understanding cloud droplet formation and growth is dependent on quantifying the rate of condensation (Nenes et al. Citation2001), and both evaporation and condensation processes are important in industrial techniques, such as spray drying (Lin and Gentry Citation2003), the evaporation and combustion of aerosolized fuel (Aggarwal Citation1998), and in pharmaceutical drug delivery to the lungs (Peng et al. Citation2000). In this publication, we present a new experimental approach for examining the evaporation of volatile components from aerosol droplets with high time resolution (<2.5 ms) over subsecond to hour timescales. In principle, this approach can also be extended to examine droplet growth through condensation and, more generally, to rapid measurements of the response of droplet size and composition to any induced change in gas phase composition.
When considering evaporation, the dynamics driving the evolving size and composition of a droplet can be considered to fall between two limiting cases. In this publication, we limit our discussion to droplets evaporating into a quiescent gas with the concentration of the volatile components assumed to be equal to zero at infinite distance from the droplet and to remain zero throughout the evaporation process. The evaporating component will be referred to as the vapor and the surrounding bath gas (e.g., nitrogen) will be referred to as the gas component. The first, most straightforward, case is that of steady-state mass transfer and occurs in droplets of low volatility (with evaporation timescales ranging from tens of seconds to hours or days). The heat transfer away from the droplet due to the latent heat of evaporation is balanced by the conductive heat transfer into the droplet from the environment. The process is isothermal, the temperature remains equal to the surrounding environment, the mass flux from the droplet is steady, and the composition remains invariant with time if all components are volatile. The mass flux is determined by the vapor pressure of the volatile component(s) and their diffusion constant(s) in the gas phase. In multicomponent droplets, the rate can be assumed to be sufficiently slow to allow mixing within the bulk of the droplet and concentration gradients do not form.
At the other extreme, a second limiting case must be considered, arising when the evaporating components are highly volatile. With increasing volatility of the evaporating components, the expected mass flux increases and the droplet evaporates on much shorter timescales (subsecond to second timescales). The transient nature of the boundary conditions (e.g., droplet radius) is such that quantities, for example, the radial distribution in the vapor concentration, cannot be considered to be equivalent to that during steady-state evaporation. In other words, the relaxation of the radial profile in the vapor concentration to a steady-state profile is much slower than the change in the boundary conditions. This is referred to as unsteady evaporation. Concentration gradients develop within the droplet bulk if liquid phase diffusion is insufficiently rapid to maintain uniform mixing. The initial heat flux away from the droplet during evaporation cannot be balanced by conduction back to the droplet surface from the gas phase. As the surface temperature decreases, the mass flux declines due to the lowering of the vapor pressure of the volatile components, illustrating the strong coupling between the heat and mass transfer. After some time, a steady-state evaporation process is established, with the heat flux to and from the droplet in balance, leading to a constant mass flux per unit surface area. At this point, the droplet temperature may be considerably lower than the ambient temperature of the gas and this is referred to as the wet-bulb temperature. The mass and heat flux from the droplet, and the concentration and temperature profiles, can be considered as having achieved steady-state evaporation (Howle et al. Citation2007).
To predict the mass flux during steady-state evaporation, the vapor pressure and vapor diffusion properties of the evaporating component must be known and the surface area decreases linearly with time (Widmann and Davis Citation1997). For unsteady-state evaporation, the mathematical description is more complex and numerical simulations are required to accurately describe the process (Jiang et al. Citation2010). An analytical treatment can be used (Kulmala et al. Citation1993) if the change in boundary conditions can be considered to be slow enough that the vapor field relaxes to a steady state on a shorter timescale—an assumption that is referred to as the quasi-steady-state assumption. Such a treatment is often based on the continuum flux model for particles evaporating within the continuum regime and this has been used in numerous studies involving both condensation and evaporation (Laaksonen et al. Citation2005).
Studies of mass and heat transfer in aerosol ensembles (Mønster et al. Citation2004) lead to a measurement of average particle properties and it can be difficult to elucidate the detail of the processes involved. Single droplet techniques remove the effects of interdroplet interactions and allow greater detail to be extracted from measurements. The evolution of droplet size is typically measured using elastic light scattering (Davis and Ray Citation1980), changes in temperature can be estimated by laser-induced fluorescence methods (Maqua et al. Citation2006), while Raman spectroscopy has been used to provide a measure of both size and composition of an evolving droplet (Buehler et al. Citation1991; Vehring et al. Citation1995; Hopkins and Reid Citation2005).
There are three approaches for isolating single droplets, the most well established being the electrodynamic balance (EDB). This technique has been used extensively to study atmospheric oxidation reactions (Pope, Gallimore, et al. Citation2010), hygroscopicity (Chan et al. Citation2005; Pope, Dennis-Smither, et al. Citation2010), light-scattering (Bakic et al. Citation2008) and charge effects (Bakhoum and Agnes Citation2005), as well as mass and heat transfer (Zhang and Davis Citation1987). Optical tweezers provide a more robust trap than a simple optical levitation trap, allowing heat and mass transfer to be studied for small perturbations away from the equilibrium state at total pressures down to the vapor pressure of the volatile component being studied (Miles et al. Citation2010). Finally, the mass flux of volatile components from droplets held in an acoustic trap can be followed, although these droplets are generally much larger than studied using an EDB or optical tweezers, and the influence of gas phase streaming must be incorporated into the analysis (Yarin et al. Citation2002; Tuckermann et al. Citation2007; Zaitone and Tropea Citation2011).
Davis (Citation1983) has used the EDB to explore the evaporation of single, binary (Taflin et al. Citation1988), and multicomponent (Ravindran and Davis Citation1981) aerosol under conditions of steady-state evaporation. For example, Zhang and Davis (Citation1987) studied mass transfer from droplets held within an airflow in an EDB. Widmann and Davis (Citation1997) investigated multicomponent evaporation of droplets representative of diesel fuel and observed the effects of fuel additives. Shulman et al. (Citation1997) studied the evaporation of aqueous droplets containing the surfactant sodium dodecyl sulfate in the regime of quasi-steady-state mass transfer, reporting a considerable slowing of the evaporation rate at a size consistent with the formation of a complete surfactant monolayer on the droplet surface. Temperature measurements have been performed on evaporating water droplets in an EDB by exploiting the temperature dependence of the OH stretching band (Heinisch et al. Citation2009). In a recent study by Pope, Tong, et al. (Citation2010), measurements made using both an EDB and optical tweezers were compared in studies of the evaporation of semivolatile organic dicarboxylic acids mixed with sodium chloride.
Experimental studies of unsteady-state evaporation have previously utilized droplet trains generated with a vibrating orifice aerosol generator (VOAG) to investigate evaporation on timescales of less than 20 ms using stimulated Raman scattering (Hopkins and Reid Citation2006; Homer et al. Citation2009) and less than 1 ms using elastic light scattering (Ray et al. Citation2008). These measurements have highlighted the importance of resolving compositional and temperature gradients within the particle bulk for understanding the mass and heat transfer with the surrounding gas phase. Homer et al. (Citation2009) illustrated how the near-surface composition of an evaporating alcohol/water droplet evolves with time due to the competition between mass flux into the gas phase and diffusion within the particle bulk.
Heinisch et al. (Citation2009) have recently reported the design of an EDB based on concentric cylindrical electrodes capable of trapping single water droplets within an airflow of known and controlled relative humidity. Our aim in this study is to expand the capabilities and uses of the cylindrical electrodynamic trap and to demonstrate its potential as a powerful tool for investigating heat and mass transfer during evaporation. This design of EDB has previously been utilized in laser scattering (Bakic et al. Citation2008) and evaporation (Heinisch et al. Citation2009) measurements of single trapped aerosol droplets. In this study, we use this EDB to examine the evaporation of binary droplets consisting of water and glycerol, recording the size evolution as water evaporates from the droplet into dry conditions. We utilize the analytical treatment of Kulmala et al. (Citation1993) and demonstrate the importance of considering the evolving droplet composition and any inhomogeneities on evaporation. In Section 2, we introduce the experimental strategy before presenting evaporation measurements in Section 3.
2. EXPERIMENTAL METHODS
An EDB traps particles with a net charge within an oscillating field and a comprehensive review of the technique is presented by Davis (Citation1997). Briefly, the application of an AC voltage to the electrodes in an EDB creates an electric potential well in which a particle with charge will sit stabilized against lateral displacements by the restoring forces resultant from the oscillating electric field. The net downward force acting on the particle due to gravity is countered by the application of a DC voltage to an electrode in the vertical axis of the confined particle.
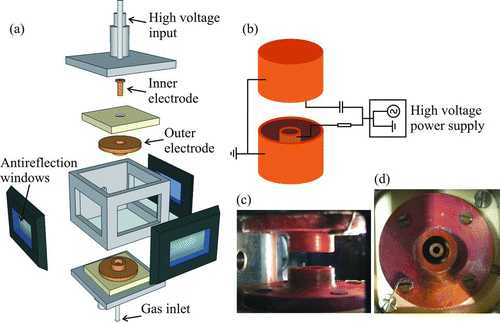
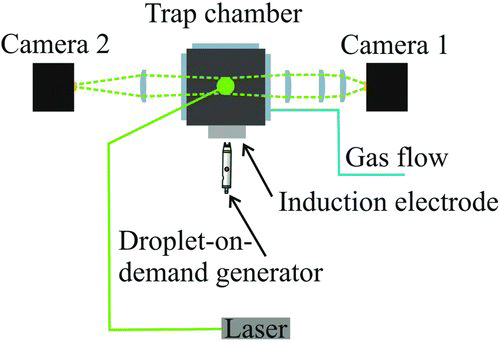
FIG. 2 Experimental configuration indicating the laser beam path and the detection angle for light scattering and imaging of a droplet in the trap. The droplet is launched from the droplet-on-demand generator in the horizontal plane midway between the upper and lower electrodes. (Color figure available online.)
The custom-fabricated cell in which the cylindrical electrodes are mounted is shown in . The cell isolates a trapped droplet from air currents and fluctuations within the surrounding environment. The cylindrical electrode configuration combines a superior trapping strength over other common geometries, such as the double ring, with a 360° viewing angle in the horizontal plane of the trapped droplet. The lower electrode also acts as a gas inlet through which an airflow can be delivered directly over the droplet, allowing processes to be studied in varying airflow velocities. This airflow is used to isolate the droplet from the ambient conditions in the chamber, providing a means of controlling the environment around the droplet.
The experiment is configured as shown in . A 532 nm green Laser Quantum Ventus CW diode laser operating at between 10 and 50 mW is used to illuminate a droplet held in the trap. Elastic light scattering collected near the forward scattering direction through an arrangement of plano-convex lenses is recorded by a Thorlabs CMOS camera (DCC1545M) running with a reduced area of interest permitting a much higher frame rate than the rated specification. A second camera is used to verify the droplet position in the trap. The walls of the chamber are formed from antireflection-coated windows (Knight Optical BK7) mounted on O-ring seals and a chamber scaffold fabricated from aluminum. The electrical connections are configured according to . An AC voltage of between 0 and 1000 V is applied to the upper and lower inner electrodes, with a frequency of 100–300 Hz depending on the size of the confined droplet. A DC voltage with a maximum range of −80 to +80 V (depending on the droplet mass, charge, and airflow velocity) is combined with the AC voltage on the lower inner electrode and both the upper and lower outer electrodes are grounded.
2.1. Droplet Generation
A voltage-activated microdroplet dispenser (MicroFab MJ-APB-01 with 30 μm orifice) is used to create droplets on a droplet-on-demand principle. A voltage pulse induces a piezo-actuated pressure wave along a capillary forcing a small volume of solution through the orifice, forming a jet that subsequently breaks down into individual droplets with a high degree of size reproducibility. The number of droplets created, their speed, and, to an extent, their size can be tailored by a fine adjustment of the applied voltage pulse. The droplets travel a horizontal distance of around 30 mm from the outer wall of the trap, through the charging induction electrode and into the trapping region. The induction electrode induces a charge separation on the droplets as they emerge from the tip and the resultant mirror charge on the droplet is linearly dependent on the induction voltage (Bogan et al. Citation2005).
The electric field strength in the cylindrical EDB makes it possible to catch individual droplets from the dispenser ensuring that conditions within the chamber are not affected by free aerosol. A single droplet travels into the EDB within tens of milliseconds and is confined in the center of the trap within 100 ms of its creation. Although this sets the lower limit on the time that can be probed during evaporation, given the reproducibility in droplet sizes generated and the repeatability of the particle trajectory, measurements could be made at earlier times during the transit of the droplet to the trapping region in a similar approach to that used previously by us. Alternatively, the droplet can be trapped and equilibrated and then a sudden change in gas phase composition is induced, initiating the heat and mass transfer process directly in the trap rather than at the point of droplet generation.
2.2. Estimating Droplet Size
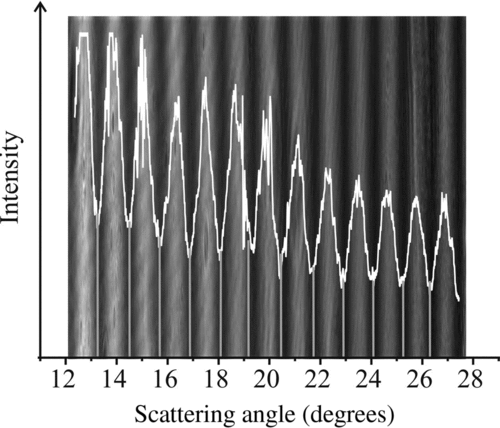
The interference between reflected and refracted rays scattering from a trapped droplet leads to a phase function (). The scattering of light by a particle is described by Maxwell's equations and an analytical solution to these for spherical particles was developed by Mie (Citation1908) for illumination by monochromatic light. The elastic scattering pattern, or phase function, is dependent on the refractive index, the incident wavelength, and the droplet size. The first two are generally well known, and thus, the phase function can be used to estimate the size. One approach for inferring size is to perform a full Mie calculation of the angularly resolved elastically scattered light for comparison with the recorded phase function. Iterative fitting can then allow the size to be retrieved by minimizing the difference between the recorded and simulated phase functions, in a method similar to that of Barnes et al. (Citation1997). A less computationally demanding method that can be used to estimate droplet size as the measurement proceeds is based on the geometrical optics approximation (Glantschnig and Chen Citation1981). The droplet radius (a) can be estimated directly from the angular separation of peaks in the scattering pattern according to
The elastic scattering depends on both the droplet size and the refractive index. To retrieve the time dependence of the droplet size from the evolving phase functions, we must know how the refractive index of the droplet changes with size. As a first attempt at estimating size, which allows an immediate estimate of the radius as a measurement proceeds, the refractive index is set at a constant value (nc ), usually chosen as the refractive index of the starting solution (which is always close to 1.33). A typical estimate of the time evolution of droplet size using this approach is shown in . In a postprocessing step after completion of the experiment, the droplet size is more accurately estimated accounting for the change in refractive index arising from the change in droplet composition during evaporation. The final steady phase function/fringe spacing recorded from the droplet at the end of the evaporation event is assumed to arise from a droplet with a composition of pure glycerol (n = 1.47). The final size is estimated, thereby also determining the mass of glycerol forming the droplet. Knowing the mass of glycerol and using the assumption of volume additivity for treating the solution density, the size of the droplet can be calculated for any added mass of water. For each of these potential trial sizes (recognizing that every trial can have only one plausible composition/mass of water), the refractive index can be estimated based on the relationship between mass fraction of glycerol and n. The phase function can be calculated from Mie calculations for each possible radius/refractive index combination. Then, through comparison with the measured phase functions, the time dependence of the size/refractive index can be retrieved directly.
Alternatively, as a more approximate treatment to performing the full Mie analysis, the initial time dependence of the radii estimated from the fringe spacing can be corrected for the change in refractive index with size. The final size, using nc , is used to estimate the droplet mass, assumed here to be pure glycerol. A mass fraction at every measured size is determined, assuming that the additional volume is due to pure water. The mass fraction is used to calculate a refractive index for each initial size measurement, and by manipulation of Equation (Equation1), a new size is calculated based upon the new refractive index. The process is repeated using the new size measurements, thus permitting a better estimate of the composition and refractive index at each point. Each point is again corrected for n, with the second iteration resulting in a very small change in size due to the insensitivity of radius to n in the geometrical optics approximation.
Determination of the refractive index from key features in the elastic scattering, such as in rainbow refractometry, is possible (Wilms and Weigand Citation2007) but was not utilized in this study. Another size determination approach, not utilized in this study but commonly used in similar techniques, is that of Mie resonance spectroscopy (Taflin et al. Citation1988), where size changes are determined from intensity fluctuations at a fixed angle from the incident laser beam.
2.3. Gas Flows
A gas inlet is connected to the lower cylindrical electrode to flow nitrogen into the cell. This flow is channeled into a jet passing over the droplet and isolates it from conditions within the chamber. The theoretical speed of the gas jet was calculated, assuming a Poiseuillian distribution of gas speeds at the outlet and a free laminar jet in the chamber (Zhang and Davis Citation1987), using the equation
FIG. 4 Theoretical gas velocity (dashed line) along with experimentally derived velocity as a function of gas volume flow rate. Error bars indicate range of DC voltage over which droplet is stable.
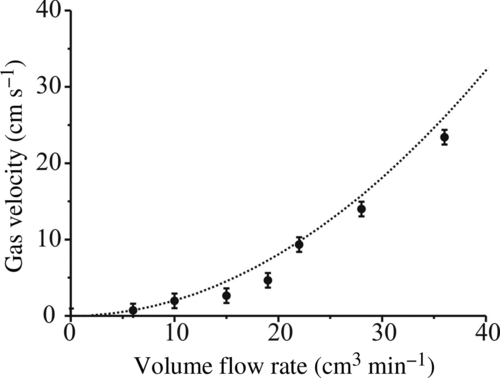
FIG. 5 Calibration of sizing technique using size standard particles. Dashed line represents the calculated size based on the peak-to-peak spacing using Equation (Equation1). The experimental points are measured peak-to-peak separations in the recorded diffraction patterns against the quoted size. The uncertainty in the angular separation is from the standard deviation in the measurement and the uncertainty in size is the standard deviation in particle size stated by the manufacturer (uncertainty in the absolute size is 0.5 μm in all cases).
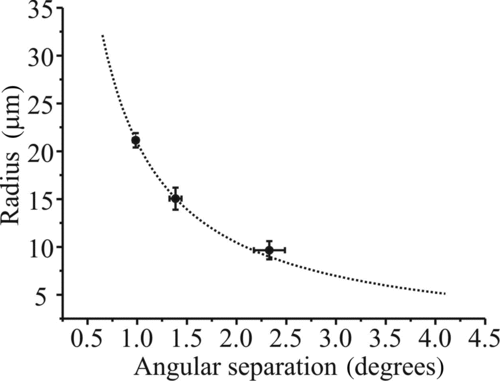
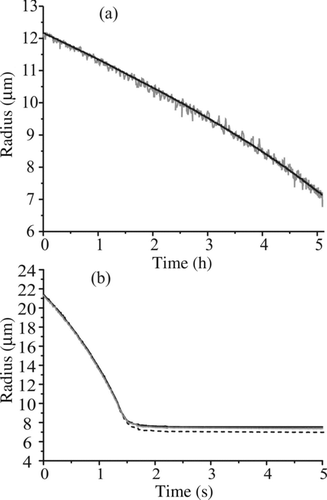
FIG. 6 (a) Comparison of the measured size evolution of an evaporating glycerol droplet (with a fixed refractive index) as determined by the geometrical optics approximation (gray) and from the fitting of phase functions to Mie theory (black). (b) Comparison of the size evolution with fixed refractive index in the geometrical optics approximation (black-dashed), postprocessed variable refractive index in the geometrical optics approximation (gray), and from a full Mie fitting (black) for a rapidly evaporating water–glycerol droplet.
3. RESULTS AND DISCUSSION
3.1. Size Calibration
The size of a droplet inferred from the phase function is heavily dependent on the assumed angular range observed by the camera. The geometrical arrangement of the laser and camera is used as a first step to estimate the angular range and central angle observed by the camera. Fine calibration is achieved using glass size standard particles (Duke Scientific 9020, 9030, 9040), which were held in the EDB. The average pixel separation of the minima in the phase function was recorded for between 10 and 20 particles of each of the three sizes in a method analogous to Pope, Tong, et al. (Citation2010). The particles have a well-defined refractive index and known size (within quoted uncertainties). The best value of the degrees-to-pixel ratio was determined (), and the angular range and the viewing angle were corroborated by Mie simulation fitting.
The benefit of the geometrical optics approximation over a full Mie fitting is the ability to estimate the size of droplets in real time with a duty cycle of hundreds of measurements per second. However, a compromise must be made between computational effort for estimating size using a full Mie fitting and the uncertainty in the estimated size resulting from the approximation. A comparison of the two methods for estimating size is shown in for an evaporating droplet of glycerol (n = 1.474) under dry conditions. The scatter in the data when using the peak separations approach is due to a fundamental limitation of the geometrical optics approximation to estimate droplet size with high accuracy (±0.25 μm in absolute size). The size evolution when retrieving particle radius from the full Mie theory fit is much less scattered and is considerably more sensitive to small size changes. However, the sizes estimated by the two approaches are consistent and give an evaporation rate of 5.58 × 10⁻¹⁵ m2 s−1. Calculation of the vapor pressure using the Maxwell steady-state diffusive mass transfer equations, utilizing the Chapman–Enskog (Chapman and Cowling Citation1991) method to estimate the binary gas phase diffusion constant, gives a value of 8.7 × 10⁻⁵ Torr, consistent with previous work (8.85 × 10⁻⁵ Torr from the approach of Cammenga et al. (Citation1977)).
shows the evaporation profile of a water–glycerol droplet of initial concentration 50 g L−1. It is clear in this figure that using a full Mie fitting gives the same result (within quoted uncertainties) as the geometrical optics approximation, but only after accounting for refractive index (as described in Section 2.2). If a constant value nc is used, the final size is underestimated and the slope of the process is overestimated.
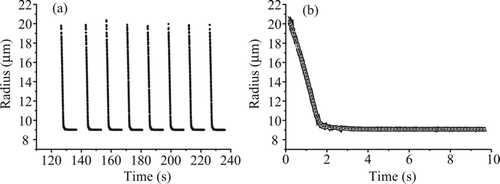
FIG. 7 (a) Typical data collection sequence for measuring the evaporation of water–glycerol droplets. (b) Expanded view of three droplets (solid black, gray, black dashed) overlaid with increasing line width for clarity, illustrating the reproducibility of the measurement.
The data presented in this article were obtained using the geometrical optics approximation, partly because very little postanalysis is required for estimating the rapidly evolving size and also as the size changes recorded were ≫ 1 μm over only a few seconds and more accurate estimates of size were unnecessary. For all measurements, the size changes are orders of magnitude larger than the uncertainty in the measurements of size and so use of the approximation was deemed appropriate.
3.2. Measurements of the Evaporation of Glycerol–Water Droplets
A typical data acquisition sequence for recording evaporation events is shown in . A single droplet was dispensed from the droplet-on-demand generator and held in the fields of the EDB. An image of the droplet was acquired and its size estimated from the phase function at a time resolution of 0.01 s. The time resolution was satisfactory for the measurements performed here, although considerably higher than this can be achieved by the instrument. Once all of the water had evaporated, the remaining glycerol droplet achieved a constant size on the timescale of the measurement. The droplet was then ejected from the trap by manipulation of the AC voltage amplitude and another droplet was dispensed. The evaporation profile recorded from many droplets was highly reproducible under a fixed set of conditions (), and the evaporation sequences were combined by taking the average size at each point in time from around 10 droplets. The standard deviation in the radius associated with each time-resolved size was very small and for the data presented here was usually much less than 1%, equivalent to less than ±200 nm, equivalent to the uncertainty in determining the size from the treatment using Equation (Equation1).
The time at which the voltage pulse was applied to the dispenser was used as the reference point for the time base for the evaporation event, or t = 0 s, and is known here with an accuracy of ±10 ms. The initial size of the droplet at this time was estimated by linear extrapolation of the radius-squared evaporation profile, over a period of over <100 ms, back to t = 0 s. Using this estimate of the initial size and the solution concentration of glycerol in the dispenser, the variation in concentration for all other sizes can be inferred, assuming that glycerol is involatile on this timescale. From the estimate of the initial size and the known solution composition, the mass of glycerol within the droplet can be calculated and the radius of the droplet remaining following water evaporation can be estimated (using the density of glycerol of 1.261 g cm−3) and compared with that measured; this is referred to as the dry size. From , it is clear that such an approach leads to a disparity between the measured final size and that expected based on the assumption that the initial droplet composition is the same as the bulk solution. Given that the solution used to generate a droplet could have been resident in the tip of the droplet-on-demand generator for some seconds (>10 s) before generation, it is likely that evaporation of the more volatile component, water, will have already occurred and the initial droplet composition would be enriched in glycerol, leading to a larger final dry size than expected.
FIG. 8 Water evaporation from water–glycerol droplets of bulk solution concentration 17.4 g L–1 (gray) and 174 g L–1 without using a purge pulse sequence (dashed) and with (solid). The dotted line indicates the expected final size based on the expected initial concentration.
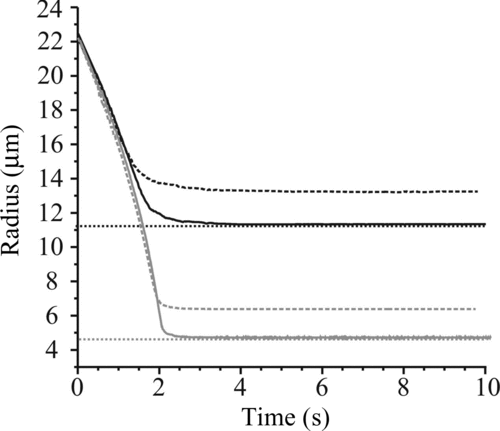
In order to reduce the effects of evaporation from the tip, it was necessary to apply a sequence of voltage pulses to the dispenser in order to flush out solution from the tip prior to trapping a droplet and recording an evaporation event. To avoid contamination of the EDB with any of these purge droplets, the pulse amplitude was lowered in order to reduce the droplet momentum and travel distance. The improvement in the agreement between the measured and estimated dry sizes can be seen in , although a marginal difference does remain. shows the expected final size, based on initial concentration of glycerol and the estimated initial size from extrapolation back to t = 0 s, and the final measured size and the estimated initial concentration inferred from this. The linear back extrapolation of size to t = 0 s provides a lower limit to the initial size as there is likely to be short unsteady period during which the size change is more rapid. Thus, if a final size measurement is available, such as for water–glycerol droplets, this is used as a point of known composition under the assumption that the droplet is completely dry.
TABLE 1 Concentration and size values for each set of water–glycerol droplets studied. Expected final size based on initial concentration of glycerol and calculated initial concentration based on measured final size
FIG. 9 Comparison of the measured size of water–glycerol droplets of different starting concentrations (solid line) with predictions from simulations (dashed). The dark gray envelope indicates the uncertainty in the predicted time dependence arising from the uncertainty in the latent heat of evaporation of water from the mixture. (a) 17.4 g L−1 (inset: uncertainty envelope due to the largest uncertainty range in latent heat [dark gray] and gas jet velocity and temperature [light gray]), (b) 43.5 g L−1, (c) 87.0 g L−1, and (d) 174 g L−1. (Color figure available online.)
![FIG. 9 Comparison of the measured size of water–glycerol droplets of different starting concentrations (solid line) with predictions from simulations (dashed). The dark gray envelope indicates the uncertainty in the predicted time dependence arising from the uncertainty in the latent heat of evaporation of water from the mixture. (a) 17.4 g L−1 (inset: uncertainty envelope due to the largest uncertainty range in latent heat [dark gray] and gas jet velocity and temperature [light gray]), (b) 43.5 g L−1, (c) 87.0 g L−1, and (d) 174 g L−1. (Color figure available online.)](/cms/asset/2e8c1985-9806-4223-a8a4-bc346cf42d69/uast_a_652750_o_f0009g.jpg)
The evaporation profiles of four different starting concentrations of water–glycerol are reported in , with each representing the averaged evolution of around 10 droplets. The initial rapid water loss is clearly visible followed by a rapid drop in evaporation rate as the last of the water is lost. The final size reached in each experiment is used to estimate the mass of glycerol and thus its concentration at every size (in g L−1). This is used to determine the refractive index and scale the size accordingly, as discussed in Section 2.2. The initial concentration of glycerol obtained through this method was used for the model predictions discussed in the following sections.
3.3. Model Treatment
An analytical model to describe the condensational growth or evaporation of a binary droplet with two volatile components has been described by Kulmala et al. (Citation1993), with a simplified set of equations also reported for unary droplets. The latter set of equations can be used to describe the evaporation of a binary droplet when only one component is volatile on the timescale of the process under study, such as in the evaporation of water from water–glycerol droplets considered here. The equation for the mass flux, in kg s−1, is given by
The simulations are performed using the same procedure used in Miles et al. (Citation2010). The relationship between the water activity at the droplet surface, equivalent to the water vapor pressure for the droplet sizes considered here, and the concentration of glycerol is calculated from the extended AIM thermodynamic model with a UNIFAC parameterization for glycerol (Clegg et al. Citation1998, Citation2001; Wexler and Clegg Citation2002). These calculations allow the variation in mass growth factor with water activity to be estimated, and by assuming a volume additivity mixing rule for estimating the density of the droplet, the variation in diameter growth factor with water activity can then be calculated. The time-dependent simulations proceed iteratively with the mass flux at time zero estimated from the water vapor pressure of the solution at the starting composition. At each time step in the evaporation, the updated particle mass from the previous time step is used in combination with the density to estimate the new droplet diameter, the corresponding diameter growth factor, and, thus, the water activity.
A single value of the latent heat of evaporation is used, as it has been shown that the value is constant across a wide range of compositions for water–glycerol mixtures (Carr et al. Citation1925; James and Phillips Citation2006). There is a difference between the values in these studies (due to the large temperature differences between the experiments), and this uncertainty is taken into account in the simulations by considering upper (2.33 kJ g–1) and lower (2.16 kJ g–1) limits for the latent heat. The best model fit is achieved with a value of 2.22 kJ g−1, and this falls within the range of values in the literature.
The experiments were conducted in a moving airflow and the Sherwood number (Sh) is used to scale the mass flux (Hopkins and Reid Citation2005) to account for the resulting mass transfer enhancement.
The mass flux is enhanced due to the increased rate of removal of the vapor phase from the surface and this is included in Equation (Equation6) by multiplying by the ratio Sh/2.
The results of the simulations are shown for comparison in , assuming thermal and mass accommodation coefficients of unity. The inset in compares the uncertainty associated with temperature (±0.5°C) and gas velocity (±1 cm s−1) with that of latent heat. It is clear from this that the experimental conditions represent a much smaller uncertainty than the model parameters. At the Knudsen numbers of these measurements, it should be noted that the simulation, within the uncertainty of the latent heat, is insensitive to thermal and mass accommodation coefficients greater than 0.05. The time dependencies of the concentration of glycerol in a droplet starting at the lowest and highest initial glycerol concentration are shown in , with the assumption that the composition of the droplet is homogenous. The final concentration approaches that of the density of pure glycerol in all cases.
FIG. 10 The evolving concentration of glycerol in droplets of low (solid gray) and high (solid black) initial glycerol concentration along with results from the simulations (dashed). The horizontal dotted line (at 850 g L–1) indicates the concentration at which the deviation from the model begins in both cases shown, and in all measured cases.
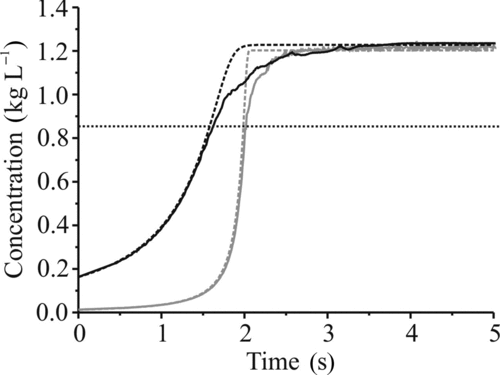
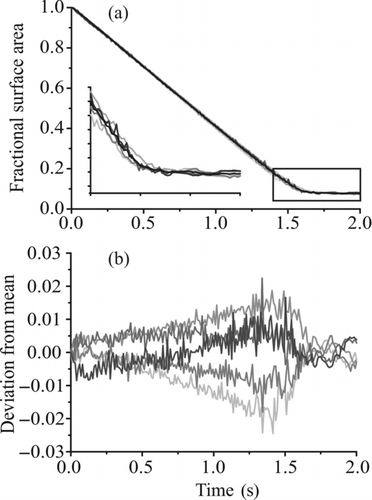
FIG. 11 Investigation of the effect of charge on the evaporation of water from water–glycerol droplets. (a) Fractional change in surface area for five induction voltages (400, 500, 600, 700, and 800 V, light gray to dark gray in increasing voltage) and the mean trend in size recorded from all the voltages (black). The inset shows an expanded view of the region indicated by the box. (b) Deviation in fractional surface area of each profile from the mean. A negative value indicates a fractional change less than the mean (i.e., faster evaporation).
There is good agreement between experimental data and simulated trends for the initial stages of the evaporation of water from the water–glycerol droplets. Deviations from the model become apparent when the droplet reaches highly concentrated states, with the model overpredicting the rate at which the final size is reached. The deviation is more apparent with droplets at higher concentrations initially, with the deviation of simulation from experiment occurring when the concentration of glycerol exceeds between 800 and 900 g L–1 (). The duration from the start of the deviation to when a final size is reached is greater in droplets with a higher initial concentration, indicating that a size-dependant factor is responsible which is not accounted for in the simulation. The model does not take into account the diffusion of species within the bulk, and it is possible that there is some impedance to water transport in the glycerol bulk, resulting in the retardation of the measured evaporation compared with the model. For larger droplets, the diffusion distance will be greater, resulting in a larger deviation from prediction. Further modeling work is planned using a more rigorous treatment based on numerical simulations (Jiang et al. Citation2010) to confirm the effects of diffusion and to examine the effects of compositional inhomogeneities on droplet evaporation.
Another effect not considered by the analytical treatment is the charge on the droplet and its influence on the surface vapor pressure of water. It has been shown by Nielsen et al. (Citation2011) that in certain cases, the influence of charge can have an appreciable effect on both the evaporation rate and the equilibrium state of a droplet. In order to determine the effects of the charge on droplet evaporation, we conducted measurements using the lowest concentration (which reaches the smallest size) of glycerol and a range of induction voltages spanning 400–800 V (). There is no trend in rate across the range of voltages used and fluctuations in evaporation rate are most likely explained by minor changes in the environmental temperature. The charge on the droplets is not sufficiently high for the effects noted by Nielsen et al. to be apparent even at the lowest size range attained in our measurements.
4. CONCLUSIONS
We have presented a detailed account of a new strategy for examining fast processes in aerosols with a time resolution of as high as 2.5 ms in measurements of evolving droplet size. Measurements on sequential droplets generated by a droplet-on-demand generator demonstrate the reproducibility of the approach, with the variability in size at any time during an evaporation event of >2 s never more than the uncertainty in size of ±0.25 μm. The capability of the instrument is assessed through measurements of water evaporation from water–glycerol droplets. A comparison with simulations using an analytical treatment of the mass and heat transfer occurring during evaporation demonstrates the reliability of the measurements.
The technique offers significant improvements over its predecessors in a number of areas:
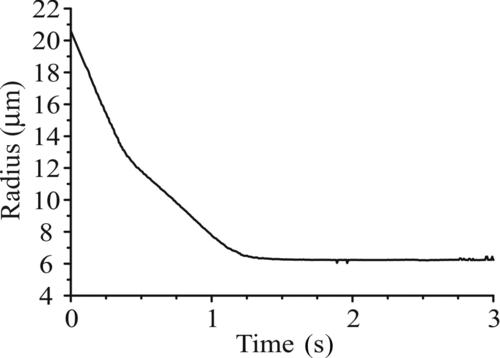
| 1. | The time resolution actually used in measurement of evolving droplet size is 50–100 times greater than earlier work in this area. Taflin et al. (Citation1988) quote a maximum resolution of 0.2 s and demonstrate a resolution of 0.5 s in their water evaporation measurements, while Shulman et al. (Citation1997) quote a maximum resolution of 0.25 s and demonstrate a resolution of ∼0.7 s. As an example of the importance of performing measurements at higher time resolutions than used before, illustrates our ability to track the size change as ethanol evaporates from a multicomponent droplet, with a radius change of ∼6 μm in the first 300 ms. This represents a much faster process than pure water evaporation and yet is still resolvable in our experiments. An accurate retrieval of size in this measurement is facile as the two volatile components, ethanol and water, have very similar refractive indices (1.33 and 1.36). Using a single value of 1.34 for the solvent component introduces negligible error to the size dependence reported. Size measurements previously conducted would not resolve the detail apparent in the time dependence for this ternary system. | ||||
| 2. | The point of creation (t = 0 s) in our experiment is very well defined, crucial for interpreting the measurements and comparison with model predictions. This also allows the robust estimation of composition throughout the evaporation event. It is unclear in previous studies whether this initial time period prior to the droplet achieving a stable position in the trap is considered or accounted for in calculations. | ||||
| 3. | Droplets can be held in gas jets of 30–40 cm s−1, with a maximum velocity currently limited by the maximum DC offset voltage we can apply. Although we do not always make use of this upper limit in this current study, this gas jet velocity does exceed the upper limit achieved in previous work on droplets held in gas flows. Zhang and Davis (Citation1987) demonstrated maximum jet velocities of around 22 cm s−1, introduced only after the droplet was confined in the trap and stabilized. Our new technique permits droplets to be caught within the airflow without adjusting flow rate. This is a consequence of the enhanced electric field strength resulting from the cylindrical electrode configuration. A key progression from this work is the opportunity it provides to rapidly change the conditions in the gas flow, initiating an evaporation or condensation event and allowing the kinetics to then be studied. This will allow, for example, measurements of the condensation rate of water between a pair of well-defined initial and final relative humidities. This type of measurement would circumvent limitations currently imposed by the time to initially load the trap, allowing studies of processes occurring on sub-100 ms timescales. | ||||
| 4. | Experiments of evaporation events can be repeated for many droplets (with initial sizes within ±100 nm) in quick succession. Previous instruments appear to have not had sufficient stability/reproducibility to allow such repeat measurements and were characterized by varying start size when repeated events were studied (Shulman et al. Citation1997). Our ability to combine the evaporation profile for many droplets, all with the same initial conditions, leads to a considerable reduction in experimental uncertainties. | ||||
FIG. 12 Evaporation from ternary component droplets containing ethanol, water, and glycerol (initial composition approximately 0.7:0.27:0.03 by volume ethanol:water:glycerol).
There is considerable scope in the experiment to conduct measurements under nonambient conditions by controlling the conditions in the gas jet (temperature and humidity). Further to this, measurements at reduced pressure could allow the surface kinetics and mass accommodation process to be investigated while future measurements at atmospheric pressure will allow the kinetics of water transport in the particle bulk to be investigated (Tong et al. Citation2011).
Acknowledgments
Dr. Christian Heinisch and Dr. Jon Wills are acknowledged for their contribution to this project at the early stages of the development of the new instrument, and Dr. Rachael Miles is acknowledged for helpful discussions. JPR acknowledges financial support from the EPSRC through the support of a Leadership Fellowship. JFD acknowledges the EPSRC for the award of a PhD studentship. AEH acknowledges the University of Bristol for the support of a postdoctoral research fellowship.
REFERENCES
- Aggarwal , S. K. 1998 . A Review of Spray Ignition Phenomena: Present Status and Future Research . Prog. Energy Combust. Sci. , 24 : 565 – 600 .
- Bakhoum , S. F. W. and Agnes , G. R. 2005 . Study of Chemistry in Droplets with Net Charge Before and After Coulomb Explosion: Ion-Induced Nucleation in Solution and Implications for Ion Production in an Electrospray . Anal. Chem. , 77 : 3189 – 3197 .
- Bakic , S. , Heinisch , C. , Damaschke , N. , Tschudi , T. and Tropea , C. 2008 . Time Integrated Detection of Femtosecond Laser Pulses Scattered by Small Droplets . Appl. Opt. , 47 : 523 – 530 .
- Barnes , M. D. , Lermer , N. , Whitten , W. B. and Ramsey , J. M. 1997 . A CCD Based Approach to High-Precision Size and Refractive Index Determination of Levitated Microdroplets Using Fraunhofer Diffraction . Rev. Sci. Instrum. , 68 : 2287 – 2291 .
- Bogan , M. J. , Bakhoum , S. F. W. and Agnes , G. R. 2005 . Promotion of Cyano-4-Hydroxycinnamic Acid and Peptide Cocrystallization Within Levitated Droplets with Net Charge . J. Am. Soc. Mass Spectrom. , 16 : 254 – 262 .
- Buehler , M. F. , Allen , T. M. and Davis , E. J. 1991 . Microparticle Raman Spectroscopy of Multicomponent Aerosols . J. Colloid Interface Sci. , 146 : 79 – 89 .
- Cammenga , H. K. , Schulze , F. W. and Theuerl , W. 1977 . Vapor Pressure and Evaporation Coefficient of Glycerol . J. Chem. Eng. Data , 22 : 131 – 134 .
- Carr , A. R. , Townsend , R. E. and Badger , W. L. 1925 . Vapor Pressures of Glycerol-Water and Glycerol-Water-Sodium Chloride Systems . Ind. Eng. Chem. , 17 : 643 – 646 .
- Chan , M. N. , Choi , M. Y. , Ng , N. L. and Chan , C. K. 2005 . Hygroscopicity of Water-Soluble Organic Compounds in Atmospheric Aerosols: Amino Acids and Biomass Burning Derived Organic Species . J. Env. Sci. Technol. , 39 : 1555 – 1562 .
- Chapman , S. and Cowling , T. G. 1991 . The Mathematical Theory of Non-Uniform Gases: An Account of the Kinetic Theory of Viscosity, Thermal Conduction, and Diffusion in Gases , Cambridge University Press, Cambridge .
- Clegg , S. L. , Brimblecombe , P. and Wexler , A. S. 1998 . A Thermodynamic Model of the System H-NH4-Na-SO4-NO3-Cl-H2O at 298.15 K . J. Phys. Chem. A , 102 : 2155 – 2171 .
- Clegg , S. L. , Seinfeld , J. H. and Brimblecombe , P. 2001 . Thermodynamic Modelling of Aqueous Aerosols Containing Electrolytes and Dissolved Organic Compounds . J. Aerosol Sci. , 32 : 713 – 738 .
- Davis , E. J. 1983 . Transport Phenomena with Single Aerosol Particles . Aerosol Sci. Technol. , 2 : 121 – 144 .
- Davis , E. J. 1997 . A History of Single Aerosol Particle Levitation . Aerosol Sci. Technol. , 26 : 212 – 254 .
- Davis , E. J. and Ray , A. K. 1980 . Single Aerosol Particle Size and Mass Measurements Using an Electrodynamic Balance . J. Colloid Interface Sci. , 75 : 566 – 576 .
- Glantschnig , W. J. and Chen , S.-H. 1981 . Light Scattering from Water Droplets in the Geometrical Optics Approximation . Appl. Opt. , 20 : 2499 – 2509 .
- Heinisch , C. , Wills , J. B. , Reid , J. P. , Tschudi , T. and Tropea , C. 2009 . Temperature Measurement of Single Evaporating Water Droplets in a Nitrogen Flow Using Spontaneous Raman Scattering . Phys. Chem. Chem. Phys. , 11 : 9720 – 9728 .
- Homer , C. J. , Jiang , X. , Ward , T. L. , Brinker , C. J. and Reid , J. P. 2009 . Measurements and Simulations of the near-Surface Composition of Evaporating Ethanol-Water Droplets . Phys. Chem. Chem. Phys., , 11 : 7780 – 7791 .
- Hopkins , R. J. and Reid , J. P. 2005 . Evaporation of Ethanol/Water Droplets: Examining the Temporal Evolution of Droplet Size, Composition and Temperature . J. Phys. Chem. A , 109 : 7923 – 7931 .
- Hopkins , R. J. and Reid , J. P. 2006 . A Comparative Study of the Mass and Heat Transfer Dynamics of Evaporating Ethanol/Water, Methanol/Water, and 1-Propanol/Water Aerosol Droplets . J. Phys. Chem. B , 110 : 3239 – 3249 .
- Howle , C. R. , Homer , C. J. , Hopkins , R. J. and Reid , J. P. 2007 . Probing the Evaporation of Ternary Ethanol-Methanol-Water Droplets by Cavity Enhanced Raman Scattering . Phys. Chem. Chem. Phys. , 9 : 5344 – 5352 .
- James , R. A. and Phillips , L. F. 2006 . Onsager Heat of Transport for Water Vapour at the Surface of Glycerol–Water Mixtures . Chem. Phys. Lett. , 425 : 49 – 52 .
- Jiang , X. , Ward , T. L. , Swol , F. V. and Brinker , C. J. 2010 . Numerical Simulation of Ethanol Water NaCl Droplet Evaporation . Ind. Eng. Chem. Res. , 49 : 5631 – 5643 .
- Kulmala , M. , Vesala , T. and Wagner , P. E. 1993 . An Analytical Expression for the Rate of Binary Condensational Particle Growth . Proc. R. Soc. Lond. A , 441 : 589 – 605 .
- Laaksonen , A. , Vesala , T. , Kulmala , M. , Winkler , P. M. and Wagner , P. E. 2005 . Commentary on Cloud Modelling and the Mass Accommodation Coefficient of Water . Atmos. Chem. Phys. , 5 : 461 – 464 .
- Lin , J.-C. and Gentry , J. W. 2003 . Spray Drying Drop Morphology: Experimental Study . Aerosol Sci. Technol. , 37 : 15 – 32 .
- Maqua , C. , Castanet , G. , Lemoine , F. , Doué , N. and Lavergne , G. 2006 . Temperature Measurements of Binary Droplets Using Three-Color Laser-Induced Fluorescence . Exp. Fluids , 40 : 786 – 797 .
- Mie , G. 1908 . Contributions to the Optics of Turbid Media, Especially Colloidal Metal Solutions . Ann. Phys. , 25 : 377 – 445 .
- Miles , R. E. H. , Knox , K. J. , Reid , J. P. , Laurain , A. M. C. and Mitchem , L. 2010 . Measurements of Mass and Heat Transfer at a Liquid Water Surface During Condensation or Evaporation of a Subnanometer Thickness Layer of Water . Phys. Rev. Lett. , 105 : 116101
- Mønster , J. , Rosenørn , T. , Svenningsson , B. and Bilde , M. 2004 . Evaporation of Methyl- and Dimethyl-Substituted Malonic, Succinic, Glutaric and Adipic Acid Particles at Ambient Temperatures . J. Aerosol Sci. , 35 : 1453 – 1465 .
- Nenes , A. , Ghan , S. , Abdulrazzak , H. , Chuang , P. Y. and Seinfeld , J. H. 2001 . Kinetic Limitations on Cloud Droplet Formation and Impact on Cloud Albedo . Tellus B , 53 : 133 – 149 .
- Nielsen , J. K. , Maus , C. , Rzesanke , D. and Leisner , T. 2011 . Charge Induced Stability of Water Droplets in Subsaturated Environment . Atmos. Chem. Phys. , 11 : 2031 – 2037 .
- Peng , C. , Chow , A. H. L. and Chan , C. K. 2000 . Study of the Hygroscopic Properties of Selected Pharmaceutical Aerosols Using Single Particle Levitation . Pharm. Res. , 17 : 1104 – 1109 .
- Pope , F. D. , Dennis-Smither , B. J. , Griffiths , P. T. , Clegg , S. L. and Cox , R. A. 2010 . Studies of Single Aerosol Particles Containing Malonic Acid, Glutaric Acid, and Their Mixtures with Sodium Chloride. I. Hygroscopic Growth . J. Phys. Chem. A , 114 : 5335 – 5341 .
- Pope , F. D. , Gallimore , P. J. , Fuller , S. J. , Cox , R. A. and Kalberer , M. 2010 . Ozonolysis of Maleic Acid Aerosols: Effect Upon Aerosol Hygroscopicity, Phase and Mass . J. Env. Sci. Technol. , 44 : 6656 – 6660 .
- Pope , F. D. , Tong , H.-J. , Dennis-Smither , B. J. , Griffiths , P. T. , Clegg , S. L. Reid , J. P. 2010 . Studies of Single Aerosol Particles Containing Malonic Acid, Glutaric Acid, and Their Mixtures with Sodium Chloride. II. Liquid-State Vapor Pressures of the Acids . J. Phys. Chem. A , 114 : 10156 – 10165 .
- Ravindran , P. and Davis , E. J. 1981 . Multicomponent Evaporation of Single Aerosol Droplets . J. Colloid Interface Sci. , 85 : 278 – 288 .
- Ray , A. K. , Devarakonda , V. and Gao , Z. 2008 . Resonance-Based Light Scattering Techniques for Investigation of Microdroplet Processes . Faraday Discuss. , 137 : 85 – 98 .
- Shulman , M. L. , Charlson , R. J. and Davis , E. J. 1997 . The Effects of Atmospheric Organics on Aqueous Droplet Evaporation . J. Aerosol Sci. , 28 : 737 – 752 .
- Taflin , D. C. , Zhang , S. H. , Allen , T. and Davis , E. J. 1988 . Measurement of Droplet Interfacial Phenomena by Light-Scattering Techniques . Am. Inst. Chem. Eng. , 34 : 1310 – 1320 .
- Tong , H.-J. , Reid , J. P. , Bones , D. L. , Luo , B. P. and Krieger , U. K. 2011 . Measurements of the Timescales for the Mass Transfer of Water in Glassy Aerosol at Low Relative Humidity and Ambient Temperature . Atmos. Chem. Phys. , 11 : 4739 – 4754 .
- Tuckermann , R. , Bauerecker , S. and Cammenga , H. K. 2007 . Generation and Characterization of Surface Layers on Acoustically Levitated Drops . J. Colloid Interface Sci. , 310 : 559 – 569 .
- Vehring , R. , Moritz , H. , Niekamp , D. , Schweiger , G. and Heinrich , P. 1995 . Linear Raman Spectroscopy on Droplet Chains: A New Experimental Method for the Analysis of Fast Transport Processes and Reactions on Microparticles . Appl. Spectrosc. , 49 : 1215 – 1224 .
- Wexler , A. S. and Clegg , S. L. 2002 . Atmospheric Aerosol Models for Systems Including the Ions H+, NH4 +, Na+, SO4 2−, NO3 −, Cl−, Br− and H2O . J. Geophys. Res. , 107 D14 : 4207
- Widmann , J. F. and Davis , E. J. 1997 . Evaporation of Multicomponent Droplets . Aerosol Sci. Technol. , 27 : 243 – 254 .
- Wilms , J. and Weigand , B. 2007 . Composition Measurements of Binary Mixture Droplets by Rainbow Refractometry . Appl. Opt. , 46 : 2109 – 2118 .
- Yarin , A. L. , Brenn , G. , Kastner , O. and Tropea , C. 2002 . Drying of Acoustically Levitated Droplets of Liquid-Solid Suspensions: Evaporation and Crust Formation . Phys. Fluids , 14 : 2289 – 2298 .
- Zaitone , B. A. A. and Tropea , C. 2011 . Evaporation of Pure Liquid Droplets: Comparison of Droplet Evaporation in an Acoustic Field Versus Glass-Filament . Chem. Eng. Sci. , 66 : 3914 – 3921 .
- Zhang , S. H. and Davis , E. J. 1987 . Mass Transfer from a Single Microdroplet to a Gas Flowing at Low Reynolds Number . Chem. Eng. Comm. , 50 : 51 – 67 .
