Abstract
Virtual impactor-based particle concentrators have been developed to enable the study of biological mechanisms and dose-response relationships of particulate matter (PM) inhalation. The Concentrated Aerosol Particle Exposure Facility (CAPEF) at the University of Toronto houses the Harvard School of Public Health designed coarse, fine, and quasi-ultrafine particle concentrators for such studies. Characterization of the concentration of the nonrefractory components of ambient particles was carried out in the winter of 2010. The fine concentrator shows higher mass concentration factors for ambient sulfate than for semi-volatile components, as measured using an Aerodyne aerosol mass spectrometer (AMS). The change in composition is based on the relative size distributions of particulate sulfate, which, compared to particulate organic and nitrate, is more dominant in larger particles more efficiently concentrated due to the physical characteristics of the virtual impactors. The ultrafine concentrator, which requires aqueous condensational growth of particles prior to concentration, shows a large enhancement in organic mass both for ambient particles and for laboratory-generated ammonium sulfate and ammonium nitrate particles added to filtered outdoor air. As suggested previously, changes in the organic mass spectrum and size distributions are consistent with addition of organic mass through reactions of water-soluble volatile organic compounds. Coagulation of particles or droplet coalescence may also account for some of the observed increase in organic mass and nitrate may be lost due to volatilization. While such effects are unlikely to affect refractory species, increased attention should be given to the effect of condensational growth on the composition of concentrated ultrafine particles.
Copyright 2012 American Association for Aerosol Research
INTRODUCTION
Particulate matter (PM) pollution is a well-known concern for environmental health. Epidemiological studies have identified a number of health effects arising from acute (Dockery and Pope Citation1994; Anderson et al. Citation2001; Samoli et al. Citation2008) and chronic (Pope et al. Citation2002; Citation2004; Miller et al. Citation2007) PM exposure. There remains a need to measure the direct physiological effects from PM exposure to supplement the epidemiological findings and determine toxicological mechanisms in vivo. A major challenge to inhalation studies, however, is that ambient PM loadings are generally too low to induce detectable acute physiological responses in most subjects. One solution is to perform exposures with laboratory-generated aerosols (for example, sulfuric acid-coated zinc oxide [Amdur and Chen Citation1989] or diesel exhaust particles [Salvi et al. Citation2000]) to achieve short-term exposure to high particle loadings. However, these particles only represent specific chemical compositions, and so the relevance to actual PM exposure is limited, particularly in light of evidence that some pollutants may have a synergistic effect on toxicity when copresent in particles (Lippman Citation1989). It is therefore better to carry out exposure studies with ambient particles to address the question of how mixed aerosol composition may influence adverse health outcomes.
To directly examine acute effects of ambient particle exposure, particle concentrator systems based on the use of virtual impactors (Marple and Chien Citation1980) have been developed to increase loadings of ambient PM to levels sufficient to elicit more readily detectable responses in human and animal subjects. Concentration of coarse particles and the accumulation mode of fine particles may be achieved through direct virtual impaction (Sioutas et al. Citation1995). Ultrafine particles, defined as particles less than 100 nm in diameter, are more difficult to concentrate, as their small size and low mass require high pressure-drops and ultrasonic acceleration to achieve direct inertial concentration, precluding the ability to combine direct concentration with in vivo exposures. Rather, to inertially concentrate these particles, they are first grown to supermicron sizes by water deposition, the droplets are concentrated by virtual impaction, and the aerosol distribution is restored by drying the water from the particle (Kim, Jaques, Chang, Froines, et al. Citation2001; Kim, Jaques, Chang, Barone, et al. Citation2001; Gupta et al. Citation2004; Geller et al. Citation2005). As these systems aim to obtain environmentally relevant particles for in vitro or in vivo health studies, it is important to preserve the original physicochemical properties of the ambient particles in the postconcentrator aerosol.
As virtual impaction is a physical process, particles concentrated directly are expected to show little difference in chemistry preconcentration and postconcentration, with the possible exception of a change in partitioning for semi-volatile constituents due to differences in pressure, temperature, and particle loading in the concentrated aerosol. Condensational growth presents more opportunities for changes in aerosol chemistry, as water-soluble volatile compounds may be taken up into the aqueous droplet and fail to volatilize upon drying. Chemical reactions taking place in water droplets are increasingly recognized as sources of secondary organic aerosol (SOA). Typically, such cloud processing involves photolytic generation of hydroxyl radicals (Lim et al. Citation2005; Carlton et al. Citation2007), though numerous laboratory investigations have provided evidence of involatile oligomeric species formed during the drying of aqueous droplets containing water-soluble volatile organic compounds (VOCs) such as glyoxyal, methylglyoxal, amines, and amino acids (De Haan, Corrigan, Smith, et al. Citation2009; De Haan, Corrigan, Tolbert, et al. Citation2009; De Haan, Tolbert, et al. Citation2009; De Haan et al. Citation2011). Importantly, these reactions are not light dependent and are accelerated during the drying of aqueous droplets, indicating that SOA formation could be significant in the short concentrator residence time, even in the absence of hydroxyl-radical oxidation of water-soluble VOCs initiated by photolytic processes.
Current evidence about the chemical integrity of concentrated particles is mixed. The output of the versatile aerosol concentration enhancement system (VACES) was examined with an Aerodyne aerosol mass spectrometer (AMS) and displayed very little change in particle composition during the concentration process, with only 2.4%–7.5% extra mass due to equilibrium partitioning of gas-phase species into the particle phase (Khlystov et al. Citation2005). It has also been demonstrated that some water-soluble gases, ammonia and hydrogen peroxide in particular, can be taken up by the growing droplets and released upon drying (Jung et al. Citation2010). In contrast, the organic carbon ion intensity in the mass spectrum of elemental carbon particles, obtained with an aerosol time-of-flight mass spectrometer (ATOFMS), increased by 30% when these particles were concentrated with the Harvard ultrafine concentrated air particle system (HUCAPS), providing some evidence of gas-to-particle partitioning of organics during the concentration process (Su et al. Citation2006).
The Health Effects of Aerosols in Toronto (HEAT) campaign was carried out in the late winter of 2010. HEAT took place at the Southern Ontario Centre for Atmospheric Aerosol Research (SOCAAR) Concentrated Air Particle Exposure Facility (CAPEF), located at the Gage Occupational and Environmental Health Unit at the University of Toronto. The goals of HEAT were to characterize the concentrating processes for the coarse, fine, and quasi-ultrafine Harvard-style particle concentrators at the CAPEF and to perform health-related studies with particles obtained from the three systems. A specific goal was to further examine the findings by Su et al. (Citation2006), who hypothesized that water-soluble species may affect the semi-volatile composition of concentrated ultrafine particles. We employ the Aerodyne AMS to study the nonrefractory composition of the particles in contrast to Su et al. (2006), which used the ATOFMS, a less quantitative aerosol analytical technique for these species. A companion paper discusses the physical aspects of particle concentration at the same facility (Rastogi et al. Citation2011). Here, we focus on the aerosol chemistry aspects of the fine and quasi-ultrafine concentrator performance using AMS characterization of the bulk aerosol nonrefractory composition.
EXPERIMENTAL
The concentrators in use at the CAPEF are built from the designs originating from the Harvard School of Public Health (Sioutas et al. Citation1997; Gupta et al. Citation2004). Due to particle transmission limitations of the aerodynamic lens in the AMS, only the compositions of concentrated fine and quasi-ultrafine particles have been examined. The fine concentrator is a multistage virtual impactor (Sioutas et al. Citation1997) bringing an inlet flow of 5000 lpm down to approximately 50 lpm for the exposure flow. In the ultrafine particle concentrator, a flow of steam is combined with the PM2.5 fraction of the input aerosol. A chiller brings the flow to a theoretical relative humidity of approximately 300%, which is sufficient for all particles to activate into water droplets regardless of aerosol hygroscopicity (Gupta et al. Citation2004). Droplets are concentrated by virtual impaction and subsequently dried with use of a heated makeup flow and band heaters. The final output of the concentrator is passed through a 200-nm cutpoint impactor to deliver a concentrated quasi-ultrafine aerosol (PM0.2). Operating conditions for the concentrators are controlled to match those established in the original design and characterization publications. Each concertrator operates discretely with separate impactor systems, but all sample from a common inlet approximately 1.5 m above ground and 10 m from College Street, a major arterial road in downtown Toronto.
The HEAT campaign took place between February 19 and March 19, 2010. The compositional characterization with the AMS took place between 9 am and 5 pm on February 23–25 and the morning of March 2 for the fine particle concentrator, and on the afternoon of March 2 and all day of March 3 for the quasi-ultrafine particle concentrator. The outside temperature during the characterization period was between −10°C and 0°C, with snowfall occurring over February 23–25 and partly cloudy-to-clear conditions on March 2 and 3.
Additional experiments were carried out in January 2011 to examine the effects of concentration on laboratory-generated aerosols. For these experiments, outdoor air was passed through a HEPA (high-efficiency particulate air) filter and particles were added using a constant output atomizer (TSI, Shoreview, MN, USA) with solutions of ammonium sulfate and ammonium nitrate.
During the characterization, a scanning mobility particle sizer (SMPS; TSI) and a time-of-flight AMS (Aerodyne Research, Billerica, MA, USA; see Drewnick et al. [Citation2005] for further details on the instrument) alternately sampled outdoor ambient and concentrated particles by means of a three-way valve set to automatically switch sampling ports every 10 min. The SMPS scanned from 17 to 765 nm once every 5 min. The AMS provided unit mass resolution electron-impact mass spectral data of the nonrefractory component of sub-micron particles (PM1) for mass-to-charge ratios (m/z) between 12 and 338. The instrument was run alternately in mass spectrometer (MS) mode and particle time-of-flight mode. In MS mode, the particle beam is continuously vaporized and the bulk aerosol mass spectrum is collected. In particle time-of-flight (PToF) mode, the beam is mechanically chopped to introduce pulses of particles to the vaporizer. As the terminal velocity of particles in the AMS vacuum is a function of the particle size and density, the arrival time of the chemical signal may be timed to the particle pulse to obtain size-resolved mass spectral data. A collection efficiency due to particle bounce (Huffman et al. Citation2005) of 0.5 was used to obtain mass loadings from the AMS, as has been reported for numerous field studies (Matthew et al. Citation2008). In addition, two fast mobility particle sizers (FMPS; TSI) were in operation, which continuously monitored the size distributions of ambient and concentrated particles.
RESULTS AND DISCUSSION
Fine Concentrator
The fine concentrator operates by means of a series of virtual impactors. This is based purely on particle inertia, and as such there are no intentionally induced changes to the physical state of the particles during the concentration process. Possible changes in the composition arising from partitioning behavior could occur through volatilization of semi-volatile components resulting from the pressure drop or the increase in temperature when the ambient air is brought indoors, or from deposition of semi-volatile components due to the increase in particle mass loading following concentration. Thus, it is valuable to use an instrument, such as the AMS, to analyze the potential changes in nonrefractory composition that might arise during the concentration process.
The mass spectrum returned by the AMS is a composite of several aerosol components. The spectrum can be broken down into basic constituents of ammonium, sulfate, nitrate, chloride, and organics by applying typical fragmentation patterns to the MS (Allan et al. Citation2004). The average bulk aerosol compositions measured in MS mode for ambient and concentrated particles are shown in . There is a change in the overall particle composition in that sulfate tends to be slightly enhanced compared to organics, nitrate, and ammonium. The apparent concentration bias toward sulfate is based on the physical characteristics of the virtual impactors used in the fine concentrator. In the Toronto area, most sulfate is the result of regional transport of oxidized SO2 emitted from coal-fired power plants in southwestern Ontario and the American Midwest (Jeong et al. Citation2011). Sulfate accumulates on particles during transport, and since sulfate is involatile and does not repartition to the gas phase after entering particles, air masses containing particulate sulfate have aged and grown to larger sizes by the time they arrive in Toronto. As such, sulfate is biased to larger particles, as shown in the particle time-of-flight composition depicted in . In addition to local sources of small organic particles, secondary formation of organic and nitrate species means that these constituents may be added to the particle surface more recently. This results in a relative bias of these species in smaller sized particles due to the combination of primary emissions and greater availability of surface area for secondary aerosol constituents.
FIG. 1 Pie charts of the average bulk composition (by mass) measured during concentrator characterization. Data shown are from ambient (left) and concentrated (right) particles from the fine concentrator characterization (top) and ultrafine concentrator characterization (bottom). (Color figure available online.)
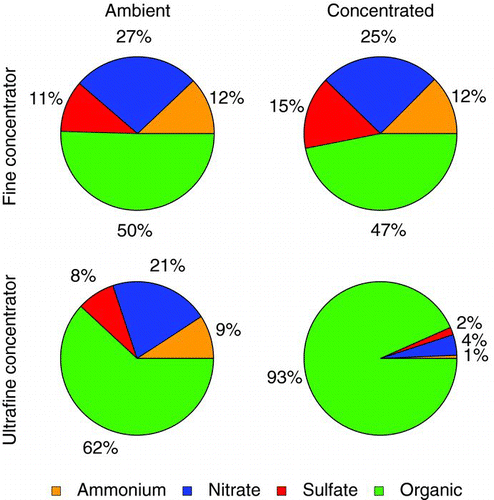
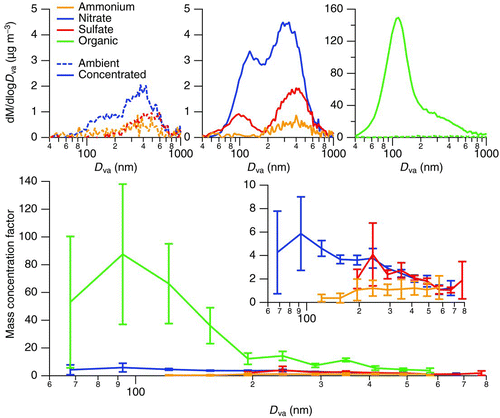
FIG. 2 The average particle time-of-flight mass distributions of ambient (left) and concentrated (center) particles for the fine particle concentrator characterization experiments. The mass concentration factor for each component as a function of size (right) reaches a maximum near a vacuum aerodynamic diameter (D va) of 600 nm. (Color figure available online.)

As discussed in the companion paper (Rastogi et al. Citation2011), size distributions of preconcentrator and postconcentrator aerosols indicate lower concentrating ability for small particles since these particles have insufficient inertia to be efficiently concentrated with the virtual impactors used. This is reflected in the size-dependent mass concentration factors in . The mass concentration factors as a function of particle vacuum aerodynamic diameter are consistent for each chemical component of the aerosol, from no concentration below 200 nm, reaching a maximum at approximately 600 nm. The maximum mass concentration factor is approximately 65 compared with the theoretical maximum of approximately 90 based on the major and minor flows of the virtual impactor. Our findings are in agreement with those of Sioutas et al. (Citation1997), where filter measurements suggested that there was no substantial change in particle composition from the use of this design of fine particle concentrator.
Ultrafine Concentrator
The ambient data from March 2010 were taken on one of the earliest dates of operation of the CAPEF ultrafine particle concentration system, and as such, the concentration factors had not yet been fully optimized. Number concentration factors near 40 are observed for the concentrators at Harvard and North Carolina (Gupta et al. Citation2004; Su et al. Citation2006), while during the entirety of the HEAT campaign, we have observed lower concentration factors in the range of 6–23 for ambient particles (Rastogi et al. Citation2011). Similar values have been reported for the HUCAPS system at the University of Rochester (Su et al. Citation2006).
The ambient particles observed during the ultrafine concentrator characterization were high in organics. Organic components made up 62% of the sub-micron nonrefractory aerosol mass for the 2 days of characterization (), and the average ratio of oxygen to carbon estimated from the mass fraction of m/z 44 (Aiken et al. Citation2008) was relatively low at 0.23, suggesting that the particle composition was influenced by fresh organic emissions from local traffic. As well, a prominent nucleation mode was observed in the number distributions on both days, reflecting the proximity of the sampling site to a busy arterial road. Number concentration factors were, on average, between 8 and 9 for the characterization experiments that included the AMS. The number concentration factors are lower than those previously reported for the Harvard and North Carolina systems, and this is due in part to some problems with virtual impactor slit alignment and supersaturation ratios that were lower than the optimal levels (Rastogi et al. Citation2011). The concentrator did not accomplish the desired reshaping of aerosol distribution, as the concentration process resulted in the prominent nucleation mode at 25 nm being replaced by a mode at 90 nm in the concentrated aerosol (Rastogi et al. Citation2011). This observation was not unprecedented, as the HUCAPS systems at both Boston and Rochester have also observed similar changes in the aerosol size distribution upon concentration when there are a large number of nucleation mode particles (Su et al. Citation2006).
The organic mass fraction was strongly enhanced in the output of the ultrafine concentrator. The sub-micron concentrator aerosol output was on average 93% organic by mass over the 2 days of characterization (). We expect some degree of enhancement in the organic mass fraction since ultrafine particles are dominated in number by freshly emitted organics from traffic. However, the organic mass concentration factor was strongly size dependent and exceeded that of the inorganic constituents. Average composition as a function of size is shown in . To reduce noise, a subset of strong mass-to-charge ratios is used to calculate the organic mass distribution. These ratios (41, 43, 44, 55, 57, 67, 69, 71, 79, 81, 83, 91, 93, 95, and 97) accounted for an average of 46% of the observed organic mass and the use of this subset does not alter the shape of the mass distribution compared with the full organic mass spectrum. The average mass concentration factor reaches a maximum of 88 ± 51 (average ± one standard deviation) for particles between 80 and 105 nm in size. Significant nitrate mass was observed in ambient particles below 100 nm, yet the concentration factor of nitrate in the same size range was about 15 times lower than that of organics, 6 ± 3 times the ambient mass. Similar factors cannot be determined for ammonium and sulfate in this size range as ambient concentrations were below detection. We hypothesize that three scenarios could lead to the larger enhancement in organic mass relative to inorganic constituents:
FIG. 3 Average mass distributions from the ultrafine concentrator March 2010 ambient concentration characterization. Data are shown for ambient (top left) and concentrated (top center) inorganic and ambient and concentrated organic (top right) components. Average mass concentration factors (bottom) are displayed as a function of particle size; the inset shows an enlargement of the mass concentration factors for inorganic constituents. (Color figure available online.)
| 1. | Small organic particles below the limits of transfer of the aerodynamic lens coagulate, coalesce, or are wet scavenged upon concentration, leading to additional mass that was previously undetectable under ambient conditions. | ||||
| 2. | Nitrate is selectively lost during the aerosol reshaping process, leading to reduced mass concentration factors for nitrate in comparison to other aerosol constituents. | ||||
| 3. | During the concentration processes, water-soluble VOCs are taken up into the droplet but do not subsequently volatilize in the drying process, leading to detection of additional organic mass by the AMS. | ||||
Particle Coagulation
The reduction of the nucleation mode upon particle concentration implies some underlying mechanism of loss. If these small particles are failing to grow into droplets, they will be primarily drawn off with the major flow in the virtual impactor. If they are wet scavenged by droplets in the saturator, grow into droplets and coalesce, or, after drying, coagulate under concentrated conditions to form larger particles, the number concentration factor will be effectively reduced but the mass in the nucleation mode will still be concentrated.
The aerodynamic lens that is used to focus particles into a narrow beam for vaporization in the AMS does not transmit all particles with 100% efficiency, as the low inertia of small particles results in a greater tendency to follow the gas flow and exit the particle beam as pumping occurs, while large particles are lost through impaction in the lens (Zhang et al. Citation2002; Liu et al. Citation2007). The lens has been demonstrated experimentally to reach a maximum transmission efficiency of 100% for particles near a vacuum aerodynamic diameter of 200 nm and degrades for larger and smaller particles, with transmission efficiency approaching zero for particles with a vacuum aerodynamic diameter less than approximately 40 nm and larger than approximately 2000 nm (Liu et al. Citation2007). This results in a challenge for interpreting ultrafine particle data since the instrument is less sensitive to the size range of interest. The effect is problematic for interpretation if coagulation, coalescence, or wet scavenging results in particles that grow into larger sizes with greater transmission efficiencies upon concentration. The end result would be that small particles grow into a size range detectable to the AMS and manifest themselves as additional mass, resulting in an inflated measurement of the true mass concentration factor.
For coagulation to account for the additional organic mass seen in the AMS, there must be sufficient nondetectable ambient organic mass at low particle sizes and an increase in detectable organic mass in the concentrated particles. The fraction of particle mass that is unobserved by the AMS may be estimated from the sub-200-nm volume distribution as measured by the SMPS. As the transmission efficiency is dependent on the vacuum aerodynamic diameter of the particle and not the physical diameter, this fraction will change depending on the density of the particles. shows the calculated mass distributions derived from the average SMPS volume distributions (assuming spherical particles) during the ambient ultrafine experiments, both before and after correction for the aerodynamic lens transmission efficiency.
FIG. 4 A comparison of calculated mass distributions based on SMPS volume (closed markers) for a range of effective particle densities for ambient (left) and concentrated (center) aerosol; the expected mass distributions observed by the AMS (open markers) are calculated based on experimental values of transmission efficiency from Liu et al. (Citation2007). The fraction of sub-200-nm particle mass that is observed by the AMS, assuming a constant particle density and a completely non-refractory aerosol, is given on the right. (Color figure available online.)
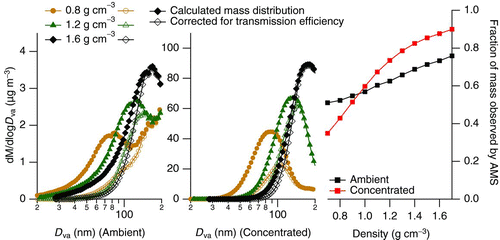
There is a significant loss of aerosol volume through the aerodynamic lens, particularly if the particles are low density. The ambient and concentrated volume distributions are different enough that at some assumed particle densities, a larger fraction of total particulate mass can indeed be measured in the postconcentrator aerosol compared with the input aerosol. However, the fraction of aerosol mass detected after concentration is, at most, 20% greater than the fraction detected from ambient aerosol, assuming a constant aerosol density during the concentration process. Thus, if we assume the 20% enhancement is entirely due to the observation of more organic mass that was previously lost in the lens, the average fraction of organic mass increases from 62% in the ambient aerosol to 68% in the concentrated aerosol. Even assuming a hypothetical but unrealistic increase in particle density from 0.7 to 1.7 g cm−3 during the concentration process, which results in a 43% enhancement in the detectable PM mass, the organic mass fraction becomes 73% in the postconcentrator aerosol. As a result, coagulation or coalescence appears to be insufficient to account for the average 93% organic fraction observed for concentrated particles.
Nitrate Loss
At the mode diameter of the mass distribution (80–105 nm), the organic mass concentration factor is about 15 times greater than that of nitrate, which may indicate that we are losing nitrate from particles. Although both organics and ammonium nitrate are semi-volatile, particulate ammonium nitrate may dissociate to gas-phase nitric acid and ammonia during the heating stage of the concentration process (Seinfeld and Pandis Citation2006) more efficiently than organic species evaporate. To examine the volatility of ammonium nitrate in the concentrator, an internally mixed ammonium sulfate and ammonium nitrate aerosol from a constant output atomizer was introduced into filtered outdoor air and concentrated. The masses of sulfate and nitrate before and after concentration were then examined. The concentration factor was consistently higher for the involatile ammonium sulfate in comparison with ammonium nitrate for the internally mixed particles, as shown in . The size dependence of the mass concentration factor was qualitatively similar to the previous ambient experiments. The mass concentration factors steadily decreased as particle size increased, a trend similar to that observed for ambient sulfate and nitrate shown in . On average, the mass concentration factors for sulfate were a factor of 2–3 higher than those observed for nitrate.
FIG. 5 Mass distributions of an internally mixed ammonium nitrate/ammonium sulfate aerosol as measured by AMS. Nitrate is considerably reduced in the concentrated aerosol (center) compared with the input aerosol (left). The mass concentration factor for sulfate is consistently 2–3 times higher than for nitrate (right). Note that in the rightmost figure, the organic trace is not included due to the nondetectable PToF organic mass in the input aerosol. (Color figure available online.)
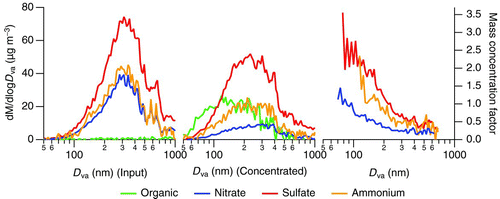
Although sulfate from laboratory aerosol is preferentially concentrated over nitrate, this does not appear to be the case for ambient aerosols. Rather, at similar size ranges, the concentration factors for ambient nitrate and sulfate are equal (). This may be the result of the additional organic content in ambient particles; if the nitrate is coated with organics, this may provide a barrier that prevents nitrate loss in the aerosol reshaper. Even if nitrate loss is significant, the factor of 2–3 loss observed for nitrate cannot account for the approximately 15-fold difference between organic and nitrate concentration factors at 88 nm for ambient particles.
Organic Carbon Uptake During Concentration
The simplest examination of organic carbon uptake is to observe the composition of organic-free particles after concentration to see if the organic fraction is enhanced. The mass distributions of internally mixed sulfate and nitrate shown in show no detectable organic in input aerosol in particle time-of-flight mode. The composition of the input aerosol is shown in . A small portion of the particle mass measured in MS mode (approximately 1%) is composed of organic compounds. After concentration, the aerosol is 19% organic by mass. Overall, the organic mass is enhanced for these aerosols by a factor of approximately 14.
FIG. 6 Pie charts of the average bulk composition (by mass) measured during addition of atomized inorganic salts. Data shown are from input (left) and concentrated (right) aerosol from mixed ammonium nitrate/ammonium sulfate (top) and ammonium sulfate (bottom) aerosols. (Color figure available online.)
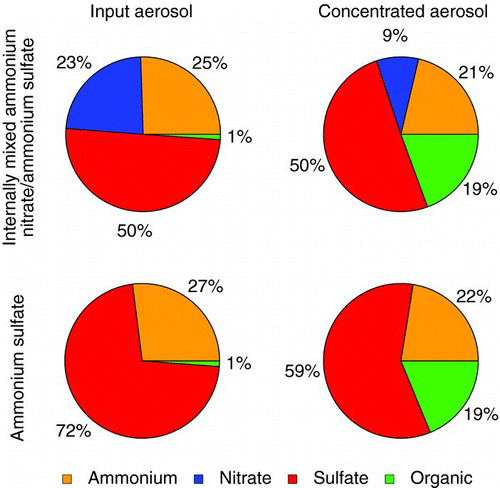
To further probe the source of this organic mass, an experiment was carried out where ammonium sulfate aerosol was added to HEPA filtered outdoor air. On average, organics again made up 19% of the concentrated aerosol mass (see ) compared with only 1% of the input aerosol, with an average mass concentration factor of 17. The concentration of the atomized ammonium sulfate solution was increased gradually to increase the mass of aerosol introduced to the concentrator over a range of 8–25 μg m−3. The mass of sulfate in the output of the concentrator scaled with the mass loading of input sulfate, while the organic output remained relatively constant with an average mass loading near 5 μg m−3, confirming that the organic mass did not arise from organic compounds internally mixed with the ammonium sulfate.
While the mass loading of ammonium sulfate in the input aerosol was increasing, the total number loading of the aerosol measured by the SMPS remained stable; that is, the size of the particles in the atomizer output grew rather than the total number of particles. This suggests that the organic mass depends more on the number concentration of particles in the concentrator input than the mass loading of particles. Considering the scenario where the extra organics comes from the uptake of water-soluble VOCs into droplets, the total organic mass added will depend on the amount of droplet surface area available for uptake. Ideally, the condenser generates uniformly sized water droplets out of all input particles, and so the available surface area will scale with the total number of input particles. The observation of constant organic mass loading with constant number loading while the mass loading of ammonium sulfate increases is consistent with the uptake of VOCs into droplets as a source of the increased organic content in concentrated particles.
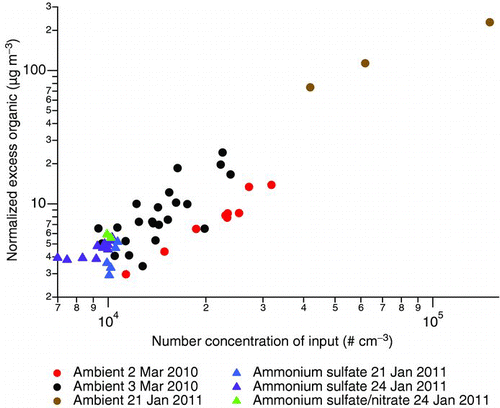
To examine the general relationship between the organic mass loading in the output aerosol and the input particle loading, we look at the excess organic mass loading resulting from particle concentration. The excess organic mass loading (Morg,e ), as we have defined it, is the difference between the organic mass loading (Morg,c ) if the concentrator output is “unconcentrated” (i.e., scaled down by the measured number concentration factor, Nc /Ni ) and the organic mass loading measured in the input aerosol (Morg,i ):
In other words, the excess organic mass loading is the mass loading of the organics that were not present in ambient particles if the concentrated aerosol is scaled back by the observed number concentration factor. While the organic mass loading in ambient particles Morg,i is not subject to the same 200-nm cutpoint as the concentrated particles, the ambient organic mass loading is typically low enough compared with the excess organic mass loading such that the inclusion of organic mass in particles greater than 200 nm does not substantially bias this calculation. In , the excess organic mass loading shows a positive relationship with the input particle number as measured by the FMPS. Data for both ambient and laboratory-generated inorganic particles lie within the same general trend of increasing excess organic mass with increasing input particle number loadings. The slope of a linear fit corresponds to the mass of organic added per particle upon concentration; on average, each particle gains 0.6 ± 0.3 fg in organic mass in the ultrafine particle concentrator, approximately equivalent to a 100-nm particle of unit density. The excess organic mass loading can be quite high—greater than 100 μg m−3 when the particle number loading is large—which requires a high mass loading of VOCs in the input aerosol. The source of these condensable VOCs is uncertain since with the current setup, effects of ambient VOCs cannot be segregated from VOCs potentially introduced during the concentration process (e.g., during the steam addition).
FIG. 7 The amount of excess organic mass, normalized by the number concentration factor observed in FMPS (2010 data) or SMPS (2011 data) counts, as a function of particle counts in the concentrator input. (Color figure available online.)
Along with a number-dependent addition of organic mass, there is a marked change in the organic mass spectrum when particles are concentrated. The change is summarized in the top three graphs of . In these plots, the change in fractional contribution of each mass-to-charge ratio to organic mass spectrum upon concentration is shown for the two characterization days in March 2010 and for the ammonium sulfate experiments discussed previously. A number of mass-to-charge ratios contribute notably more to the organic mass spectrum in concentrated particles. These include m/z 29, 41, 55, 56, 57, 70, 99, and 171. In some spectra, m/z 86, 112, 113, 127, 185, 213, and 227 are also enhanced. There is a decrease in the fractional contribution of m/z 43, 67, 77, 79, and 81 to the organic mass. These ions arise from the detection of small hydrocarbon fragments from the ionization of long-chain hydrocarbons contributing to the “picket-fence” appearance of hydrocarbon-like organic aerosol. In some instances, the fractional contribution of m/z 44, generally attributed to the CO2 + ion and indicative of oxygenated organics such as carboxylic acids, also decreases.
FIG. 8 Comparison of organic mass spectra for input and output aerosol from the ultrafine particle concentrator. The three upper graphs show the difference between the concentrated and ambient mass fractional contribution for each mass-to-charge ratio to the total organic mass for ambient particles on March 2 (top left) and March 3 (top center) 2010 and for ammonium sulfate ((NH4)2SO4) particles concentrated on January 23, 2011 (top right). The vertical scale of mass-to-charge ratios greater than 100 is expanded by a factor of 5 for clarity. Black lines indicate an increase in fractional contribution to total organic mass, while gray/red lines represent a decrease. On the lower left, the fractional contribution of each mass-to-charge ratio to the organic mass spectrum for concentrated organic aerosol from March 2, 2010, is plotted against the fractional contribution ambient organic aerosol from the same time period, points numbered by mass-to-charge ratio. On the bottom right is the same data plotted against the organic mass spectrum for concentrated ammonium sulfate collected on January 24, 2011. (Color figure available online.)
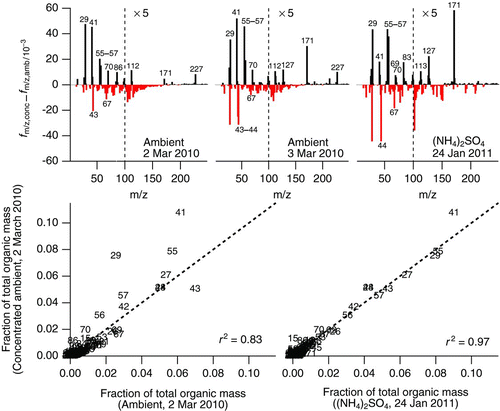
The fractional contribution of each m/z to the total organic mass for the concentrated particles on March 2, 2010, has been plotted in the bottom half of . In the left figure, it has been plotted against the mass spectrum of the ambient particles being concentrated; the linear fit has a reasonable r 2 of 0.83, although many m/z values deviate from the one-to-one line indicated. The graph on the lower right is the same spectrum plotted against the organic MS for concentrated ammonium sulfate from experiments in January 2011. Most m/z ratios fall along the one-to-one line, and a linear fit of the data yields a very high r 2 of 0.97. Therefore, the organic mass spectrum appears to resemble that of the organic artifact on concentrated ammonium sulfate particles more than it does the organic particles introduced into the concentrator. The similar appearance of the organic mass spectra taken at very different times suggests that the chemistry responsible for the organic artifact is the same on both occasions.
A common mass increase occurs at m/z 171 (see upper frames in ). This fragment has been observed by the AMS as arising from an oligomer formed during the drying of aqueous droplets containing dissolved methylamine and glyoxal along with m/z 113, also observed to increase in some mass spectra of concentrated particles (De Haan, Tolbert, et al. Citation2009). The intensities of m/z 99 and 127 also sometimes increase upon concentration, and these are fragments observed from oligomers formed from self-reactions of methylglyoxyal in drying aqueous droplets (De Haan, Corrigan, Tolbert, et al. Citation2009). The identities of these ions cannot be positively identified without a high-resolution mass spectrometer, and it should be noted that a number of ions observed by De Haan et al. (De Haan, Tolbert, et al. Citation2009; De Haan, Corrigan, Tolbert, et al. Citation2009) do not appear in the concentrated organic mass spectra. However, the composition of the particles in the laboratory studies of De Haan et al., which arise from water droplets containing high concentrations of VOC precursor, is very different than the ambient particles we have studied. Nonetheless, the appearance of high molecular weight signals in concentrated aerosols that do not appear in the mass spectrum of the input aerosol suggests that some oligomerization reactions that are irreversible on the timescale of the aerosol reshaping process occurred during the concentration process, and some of the fragments observed suggest that dark aqueous chemistry may play a role in the organic mass observed by the AMS.
As mentioned in the Introduction section, this study follows that of Su et al. (Citation2006), who also observed additional organic carbon in the HUCAPS systems in Rochester, Boston, and Chapel Hill by using an ATOFMS. Concentration of ambient particles noted a loss of particles classified as largely elemental carbon by composition and amine-containing particles, replaced by internally mixed elemental and organic carbon particles and polycyclic aromatic hydrocarbons (PAH) dominated particles. The study also observed concentrated 13C soot, which came out of the concentrator enhanced by about 30% in organic carbon mass compared with the input aerosol. They have attributed the extra organics observed to the uptake of water-soluble VOCs, as well. The AMS spectra did not show a similar increase in PAH species in concentrated aerosols, but the estimated 0.6 fg increase in organic mass per particle is similar in magnitude to the 30% organic mass increase observed by Su et al. (Citation2006) for particles near 80 nm at unit mass density. If the amine dependent oligomer product we have proposed is formed in the concentrator, this type of chemistry may help account for the loss of amine-containing particles they observed with the ATOFMS.
Interestingly, the VACES system for particle concentration has noted smaller changes in particle composition during the concentration process. Nevertheless, there can be effects on semi-volatile components in this system, with nitrate artifacts measured by the AMS and an enhancement in amine-containing particles observed by the ATOFMS (Khlystov et al. Citation2005; Su et al. Citation2006). The VACES system achieves lower water saturation ratios than the Harvard-design ultrafine concentrator by passing the input aerosol over a heated water bath and drying the particles using a diffusion dryer, rather than drying by heating (Kim, Jaques, Chang, Froines, et al. Citation2001; Gupta et al. Citation2004). It would be worthwhile to examine how these major differences in design lead to the relatively large organic artifacts we, and others, have observed.
One caveat to this discussion is that we were unable to test the droplet growth kinetics in the concentrator. A possibility we have not explored is that very small hydrocarbon-like organic particles may either activate or grow more slowly in the condenser than comparatively hygroscopic particles. If the alignment of the virtual impactor slits leads to selective loss of large droplets, we may see an enhancement of organics compared with inorganics, particularly at low size ranges should organic particles activate to form smaller droplets. While it is possible that this could account for some of the organic concentration bias observed in ambient particles, it does not explain the appearance of organic mass in concentrated ammonium sulfate particles. For this reason, formation of new organic mass from water-soluble VOCs appears to be occurring during the concentration process.
CONCLUSION
Study of concentrated particle composition produced by the University of Toronto particle concentrator systems reveals that the physical concentration process in the fine concentrator leads to little compositional change, while the condensation-based ultrafine particle concentrator leads to a strong enhancement in particulate organic mass in comparison to inorganic constituents. Evidence suggests that while coagulation of small organic particles and loss of volatile nitrate may account for at least part of this apparent enhancement, uptake of water-soluble VOCs followed by generation of lower volatility products upon droplet drying leads to organic mass that is not present in the input particles. Both particle coagulation and the deposition of organic mass to particles, causing the particles to grow, can account for the tendency of the ultrafine particle concentrator to poorly reproduce the size distribution of particles containing strong nucleation modes, observed in the University of Toronto system and previously reported by Su et al. (Citation2006).
The generalizability of these results should be interpreted somewhat cautiously, as the University of Toronto ultrafine particle concentrator has not been operating at the same concentrating efficiency as reported for previous models of the instrument. However, the presence of organic artifacts is consistent regardless of the number concentration factor observed, and so the process leading to the organic artifact appears to be independent of the parameter resulting in low concentration efficiency. Given the increase in organics from use of the CAPEF, ultrafine particle concentrator in Toronto appears consistent with previous observations from other HUCAPS systems (Su et al. Citation2006), it would be prudent to pay more attention to the composition of the semi-volatile component of output particles concentrated using condensational growth. The design elements that lead to the organic enhancement should be pinpointed to ensure that for future experiments, the original particle composition is maintained during the concentration process. We note that the composition of refractory and potentially physiologically active species such as black carbon, metals, and mineral dust is unlikely to be affected by the processes we have discussed here.
Acknowledgments
The authors thank Dr. Mike Fila for his assistance with the particulate matter exposures. The authors thank Drs. Jeremy Scott and Chung-Wai Chow for their collaboration in the HEAT (Health Effects of Aerosols in Toronto) Campaign. Funding for SOCAAR (Southern Ontario Centre for Atmospheric Aerosol Research) was provided by the Canadian Foundation for Innovation, the Ontario Innovation Trust, and the Ontario Research Fund. Additional funding was provided by the Natural Sciences and Engineering Research Council of Canada.
Related Research Data
REFERENCES
- Aiken , A. C. , DeCarlo , P. F. , Kroll , J. H. , Worsnop , D. R. , Huffman , J. A. Docherty , K. S. 2008 . O/C and OM/OC Ratios of Primary, Secondary, and Ambient Organic Aerosols with High-Resolution Time-of-Flight Aerosol Mass Spectrometry . Environ. Sci. Technol. , 42 : 4478 – 4485 .
- Allan , J. D. , Delia , A. E. , Coe , H. , Bower , K. N. , Alfarra , M. R. Jimenez , J. L. 2004 . A Generalised Method for the Extraction of Chemically Resolved Mass Spectra from Aerodyne Aerosol Mass Spectrometer Data . J. Aerosol Sci. , 35 : 909 – 922 .
- Amdur , M. O. and Chen , L. C. 1989 . Furnace-Generated Acid Aerosols: Speciation and Pulmonary Effects . Environ. Health Perspect. , 79 : 147 – 150 .
- Anderson , R. W. , Anderson , H. R. , Sunyer , J. , Ayres , J. , Baccini , M. Vonk , J. M. 2001 . Acute Effects of Particulate Air Pollution on Respiratory Admissions: Results from APHEA 2 Project . Am. J. Respir. Crit. Care Med., , 164 : 1860 – 1866 .
- Carlton , A. G. , Turpin , B. J. , Altieri , K. E. , Seitzinger , S. , Reff , A. Lim , H.-J. 2007 . Atmospheric Oxalic Acid and SOA Production from Glyoxal: Results of Aqueous Photooxidation Experiments . Atmos. Environ., , 41 : 7588 – 7602 .
- De Haan , D. O. , Corrigan , A. L. , Smith , K. W. , Stroik , D. R. , Turley , J. J. Lee , F. E. 2009 . Secondary Organic Aerosol-Forming Reactions of Glyoxal with Amino Acids . Environ. Sci. Technol., , 43 : 2818 – 2824 .
- De Haan , D. O. , Corrigan , A. L. , Tolbert , M. A. , Jimenez , J. L. , Wood , S. E. and Turley , J. J. 2009 . Secondary Organic Aerosol Formation by Self-Reactions of Methylglyoxal and Glyoxal in Evaporating Droplets . Environ. Sci. Technol., , 43 : 8184 – 8190 .
- De Haan , D. O. , Hawkins , L. N. , Kononenko , J. A. , Turley , J. J. , Corrigan , A. L. Tolbert , M. A. 2011 . Formation of Nitrogen-Containing Oligomers by Methylglyoxal and Amines in Simulated Evaporating Cloud Droplets . Environ. Sci. Technol., , 45 : 984 – 991 .
- De Haan , D. O. , Tolbert , M. A. and Jimenez , J. L. 2009 . Atmospheric Condensed-Phase Reactions of Glyoxal with Methylamine . Geophys. Res. Lett., , 36 : L11819
- Dockery , D. W. and Pope , C. A. 1994 . Acute Respiratory Effects of Particulate Air Pollution . Annu. Rev. Public Health, , 15 : 107 – 132 .
- Drewnick , F. , Hings , S. S. , DeCarlo , P. , Jayne , J. T. , Gonin , M. Fuhrer , K. 2005 . A New Time-of-Flight Aerosol Mass Spectrometer (TOF-AMS)—Instrument Description and First Field Deployment . Aerosol Sci. Technol., , 39 : 637 – 658 .
- Geller , M. D. , Biswas , S. , Fine , P. A. and Sioutas , C. 2005 . A New Compact Aerosol Concentrator for use in Conjunction with Low Flow-Rate Continuous Aerosol Instrumentation . J. Aerosol Sci. , 36 : 1006 – 1022 .
- Gupta , T. , Demokritou , P. and Koutrakis , P. 2004 . Development and Performance Evaluation of a High-Volume Ultrafine Particle Concentrator for Inhalation Toxicological Studies . Inhalation Toxicol., , 16 : 851 – 862 .
- Huffman , J. A. , Jayne , J. T. , Drewnick , F. , Aiken , A. C. , Onasch , T. Worsnop , D. R. 2005 . Design, Modeling, Optimization, and Experimental Tests of a Particle Beam Width Probe for the Aerodyne Aerosol Mass Spectrometer . Aerosol Sci. Technol., , 39 : 1143 – 1163 .
- Jeong , C.-H. , McGuire , M. L. , Herod , D. , Dann , T. , Dabek-Zlotorzynska , E. Wang , D. 2011 . Receptor Model Based Identification of PM2.5 Sources in Canadian Cities . Atmos. Pollut. Res. , 2 : 158 – 171 .
- Jung , H. , Arellanes , C. , Zhao , Y. , Paulson , S. , Anastasio , C. and Wexler , A. 2010 . Impact of the Versatile Aerosol Concentration Enrichment System (VACES) on Gas Phase Species . Aerosol Sci. Technol., , 44 : 1113 – 1121 .
- Khlystov , A. , Zhang , Q. , Jimenez , J. L. , Stanier , C. , Pandis , S. N. Canagaratna , M. R. 2005 . In Situ Concentration of Semi-Volatile Aerosol Using Water-Condensation Technology . J. Aerosol Sci., , 36 : 866 – 880 .
- Kim , S. , Jaques , P. , Chang , M. , Barone , T. , Xiong , C. Friedlander , S. K. 2001 . Versatile Aerosol Concentration Enrichment System (VACES) for Simultaneous In Vivo and In Vitro Evaluation of Toxic Effects of Ultrafine, Fine and Coarse Ambient Particles - Part II: Field Evaluation . J. Aerosol Sci., , 32 : 1299 – 1314 .
- Kim , S. , Jaques , P. A. , Chang , M. , Froines , J. R. and Sioutas , C. 2001 . Versatile Aerosol Concentration Enrichment System (VACES) for Simultaneous In Vivo and In Vitro Evaluation of Toxic Effects of Ultrafine, Fine and Coarse Ambient Particles - Part I: Development and Laboratory Characterization . J. Aerosol Sci., , 32 : 1281 – 1297 .
- Lim , H.-J. , Carlton , A. G. and Turpin , B. J. 2005 . Isoprene Forms Secondary Organic Aerosol Through Cloud Processing: Model Simulations . Environ. Sci. Technol., , 39 : 4441 – 4446 .
- Lippman , M. 1989 . Progress, Prospects, and Research Needs on the Health Effects of Acid Aerosols . Environ. Health Perspect., , 79 : 203 – 205 .
- Liu , P. S. K. , Deng , R. , Smith , K. A. , Williams , L. R. , Jayne , J. T. Canagaratna , M. R. 2007 . Transmission Efficiency of an Aerodynamic Focusing Lens System: Comparison of Model Calculations and Laboratory Measurements for the Aerodyne Aerosol Mass Spectrometer . Aerosol Sci. Technol., , 41 : 721 – 733 .
- Marple , V. A. and Chien , C. M. 1980 . Virtual Impactors: A Theoretical Study . Environ. Sci. Technol., , 14 : 976 – 985 .
- Matthew , B. M. , Middlebrook , A. M. and Onasch , T. B. 2008 . Collection Efficiencies in an Aerodyne Aerosol Mass Spectrometer as a Function of Particle Phase for Laboratory Generated Aerosols . Aerosol Sci. Technol., , 42 : 884 – 898 .
- Miller , K. A. , Siscovick , D. S. , Sheppard , L. , Shepherd , K. , Sullivan , J. H. Anderson , G. L. 2007 . Long-Term Exposure to Air Pollution and Incidence of Cardiovascular Events in Women . N. Engl. J. Med., , 356 : 447 – 458 .
- Pope , C. A. , Burnett , R. T. , Thun , M. J. , Calle , E. E. , Krewski , D. Ito , K. 2002 . Lung Cancer, Cardiopulmonary Mortality, and Long-Term Exposure to Fine Particulate Air Pollution . JAMA, J. Am. Med. Assoc., , 287 : 1132 – 1141 .
- Pope , C. A. , Burnett , R. T. , Thurston , G. D. , Thun , M. J. , Calle , E. E. Krewski , D. 2004 . Cardiovascular Mortality and Long-Term Exposure to Particulate Air Pollution: Epidemiological Evidence of General Pathophysiological Pathways of Disease . Circulation, , 109 : 71 – 77 .
- Rastogi , N. , McWhinney , R. D. , Akhtar , U. S. , Urch , B. , Fila , M. Abbatt , J. P. D. 2011 . Physical Characterization of a Coarse, Fine, and Ultrafine High-Volume Particle Concentrator System . Aerosol Sci. Technol. , in review
- Salvi , S. S. , Nordenhall , C. , Blomberg , A. , Rudell , B. , Pourazar , J. Kelly , F. J. 2000 . Acute Exposure to Diesel Exhaust Increases IL-8 and GRO-α Production in Healthy Human Airways . Am. J. Respir. Crit. Care Med., , 161 : 550 – 557 .
- Samoli , E. , Peng , R. , Ramsay , T. , Pipikou , M. , Touloumi , G. Dominici , F. 2008 . Acute Effects of Ambient Particulate Matter on Mortality in Europe and North America: Results from the APHENA Study . Environ. Health Perspect. , 116 : 1480 – 1486 .
- Seinfeld , J. H. and Pandis , S. N. 2006 . Atmospheric Chemistry and Physics , 472 New York : From Air Pollution to Climate Change (2nd Ed). Wiley Interscience .
- Sioutas , C. , Koutrakis , P. and Burton , R. M. 1995 . A Technique to Expose Animals to Concentrated Fine Ambient Aerosols . Environ. Health Perspect., , 103 : 172 – 177 .
- Sioutas , C. , Koutrakis , P. , Godleski , J. J. , Ferguson , S. T. , Kim , C. S. and Burton , R. M. 1997 . Fine Particle Concentrators for Inhalation Exposures—Effect of Particle Size and Composition . J. Aerosol Sci., , 28 : 1057 – 1071 .
- Su , Y. , Sipin , M. F. , Spencer , M. T. , Qin , X. Y. , Moffet , R. C. Shields , L. G. 2006 . Real-Time Characterization of the Composition of Individual Particles Emitted from Ultrafine Particle Concentrators . Aerosol Sci. Technol., , 40 : 437 – 455 .
- Zhang , X. , Smith , K. A. , Worsnop , D. R. , Jimenez , J. L. , Jayne , J. T. and Kolb , C. E. 2002 . A Numerical Characterization of Particle Beam Collimation by an Aerodynamic Lens-Nozzle System: Part I. An Individual Lens or Nozzle . Aerosol Sci. Technol., , 36 : 617 – 631 .