Abstract
Particle concentrators allow exposure to controlled levels of concentrated ambient particulate matter (PM) over a broad range of concentrations. The performance of these systems can be influenced by the physicochemical characteristics of PM and so it is vital to characterize the concentrators at a given site. The quasi-ultrafine PM (<0.2 μm), fine PM (0.15–2.5 μm), and coarse PM (2.5–10 μm) concentrators at the Southern Ontario Center for Atmospheric Aerosol Research (SOCAAR), University of Toronto, were characterized as a part of the “Health Effects of Aerosols in Toronto (HEAT)” campaign held during February–March, 2010. The full size distributions of ambient and concentrated particles were simultaneously measured in terms of number, surface area, and volume using high time-resolution instruments. Examination of the complete size distribution, including the unconcentrated particles beyond the cutpoints of the concentrator systems, revealed that particles in the unconcentrated size ranges made significant contributions to the particle number and surface area present in the concentrated airstreams of fine and coarse concentrators. Further transients in the ambient ultrafine particle concentrations were evident as dampened signals in these concentrated airstreams. The ultrafine concentrator exhibited a significant size shift when the ambient particle size distribution had a mode ≤30 nm. Overall the fine and coarse concentrators provided a reasonable concentrated reproduction of the ambient PM mass while questions remain regarding the representativeness of the ultrafine concentrator.
Copyright 2012 American Association for Aerosol Research
1. INTRODUCTION
Numerous epidemiological studies have found the associations between higher concentrations of ambient particulate matter (APM) and adverse effects on human health. Although the correlation between particulate matter (PM) exposure and adverse health effects is generally positive, the magnitude of associations varies with different geographic locations and seasons. Such variability has been attributed in part to the geographical and seasonal distribution of PM composition (Samet et al. Citation2000; Becker et al. Citation2005; Zereini and Wiseman Citation2011). Fine (aerodynamic diameter <2.5 μm) and ultrafine (aerodynamic diameter <100 nm) PM are of specific concern because of their larger surface area/particle number and potential to penetrate the lungs all the way to the alveolar/capillary border (Oberdorster et al. Citation2005). While fine PM concentrations may be elevated both at urban and rural sites, ultrafine PM is often higher in urban areas (Jeong et al. Citation2011; Dabek-Zlotorzynska et al. Citation2011).
Both in vivo and in vitro studies are needed to relate observed pathophysiological effects to the mechanisms underlying PM exposure. However, typical ambient PM concentrations vary greatly on a day-to-day basis and are at times too low to induce observable acute effects in animal models or healthy individuals. Particle concentrators allow exposure to controlled and reproducible levels of concentrated ambient coarse, fine, and ultrafine PM over a broad range of concentrations (Sioutas et al. Citation1995, Citation1997; Demokritou et al. Citation2002, Citation2003; Gupta et al. Citation2004a, Citation2004b). Particle concentrators use virtual impaction to separate the particles from an airstream. The particle size range of a concentrator is defined by its lower and upper cutpoints. These cutpoints mainly depend upon the impactor geometry, particle density, and ratio of the minor (output) to total (input) flow rates. Ultrafine particles cannot be directly concentrated through virtual impaction because this requires supersonic flow and excessive pressure drops which lead to high losses of semi-volatile species (Delamora et al. Citation1990; Hering and Stolzenburg Citation1995). Furthermore, the requirement of a high-pressure drop makes it impractical to conduct direct inhalation studies in animal models and humans. Consequently, condensation/evaporation technologies have been developed for concentrating ultrafine particles. Only a few studies have documented the performance of different concentrators during (Sioutas et al. Citation1995; Demokritou et al. Citation2002, Citation2003; Gupta et al. Citation2004a, Citation2004b) or after their development (Sioutas et al. Citation1997; Lawrence et al. Citation2004; Su et al. Citation2006). For example, the concentration enrichment factor (CEF) of a fine concentrator (for particle >0.15 μm) was reported to be affected by the mass median aerodynamic diameter (MMAD) of the ambient PM (Lawrence et al. Citation2004). In the case of quasi-ultrafine particles (<200 nm), the concentrator's performance was reported to depend on both the physical and chemical characteristics of the PM as a result of the water condensation–evaporation process used to grow the ultrafine particles and then dry them back to their original size (Gupta et al. Citation2004b; Su et al. Citation2006). During this concentration process, ultrafine particles experience supersaturation and heating, either of which may alter the properties from that of the original ambient particles (Gupta et al. Citation2004b). As the physical and chemical characteristics of the particles may be associated with their toxicity, any alteration during the concentration process needs to be characterized in order to allow results obtained with concentrated PM to be generalized to ambient PM.
SOCAAR's (Southern Ontario Center for Atmospheric Aerosol Research's) concentrated ambient particulate exposure facility (CAPEF) contains three high-volume particle concentrating systems developed by the Harvard School of Public Health for in vivo assessment of the acute health effects of particle inhalation under controlled conditions via human and animal exposures. The performance of SOCAAR's three PM concentrators was investigated as part of “Health Effects of Aerosols in Toronto” (HEAT) winter campaign held during February 19 to March 19, 2010, in Toronto, Canada. The major goal of HEAT was to assess the health impacts of ambient PM on mice and human airway epithelial cells via in vivo/in vitro studies using particle concentrators (Amatullah et al. Citation2012; Akhtar et al. in preparation). The HEAT campaign continued until March 19, 2010; each concentrator ran for ∼1 week for in vivo mouse exposures and for aerosol filter collection. Extracts from these filters were subsequently analyzed for chemical and reactive oxygen species (ROS), and used for in vitro exposure experiments. Results from these filter analyses will be presented elsewhere.
This article describes an investigation of changes in the physical characteristics of ambient coarse, fine, and ultrafine PM during the concentration process. The effects of the concentration process on chemical composition are discussed in a companion article (McWhinney et al. Citation2012). The specific objectives of this component of the study were to (i) determine the concentration enrichment achievable using the SOCAAR coarse, fine, and ultrafine concentrators with respect to particle number and mass, (ii) establish the size fraction cutpoints of all the three concentrators, and (iii) determine whether the process of concentration influences the size distribution of ambient particulate matter (APM) versus concentrated ambient particulate matter (CAP). The concentrators were characterized on February 19–25, and on March 3, 2010, at the study site located in downtown Toronto.
2. EXPERIMENT
CAPEF is located in the Gage Occupational and Environmental Health Unit (GOEHU) building at the University of Toronto (St. George Campus). This site is situated on College Street in the heart of downtown Toronto (43.6°N, 79.4°W) and experiences heavy traffic density (∼23,000 automobiles/weekday). Busy expressways are located to the east (∼3 km) and south (∼2 km) of the sampling site. Thus, this site is typical of many urban locations, with numerous nearby fine and ultrafine PM emissions sources, making it well suited for studying the health effects of urban PM. CAPEF has three systems, designed to concentrate particles based on their aerodynamic diameters into different size ranges: coarse (2.5–10 μm), fine (0.15–2.5 μm), and quasi-ultrafine (<0.2 μm) PM. These concentrator systems use virtual impaction to separate the particles of interest from the bulk air by splitting an inlet airflow into a major (carrying air without particles of interest) and a minor (carrying air with particles of interest) flow. Ideally the extent of concentration, that is the enrichment factor, depends upon the ratio of the minor to inlet flow.
2.1. SOCAAR Coarse, Fine, and Ultrafine Particle Concentrators
A common size-selective inlet (10-μm cutpoint, polyurethane foam [PUF] impactor) for all three concentrators is located on College Street at 1.5 m above ground level. The particle concentrators and exposure system are in the basement of the GOEHU building. There are four dampers in the inlet line, which can be opened or closed appropriately to select a particular concentrator to use. One of these dampers directs part of the airflow through a high-efficiency particle air (HEPA) filter bypass. This damper is used to reduce the particle concentration in the inflow when outflow particle concentrations are too high during human/animal exposure. Details of the development and optimization of all the three concentrators have been reported elsewhere (Sioutas et al. Citation1997; Demokritou et al. Citation2003; Gupta et al. Citation2004a). Briefly, the coarse particle concentrator is designed to concentrate particles with aerodynamic diameter ranging from 2.5 to 10 μm using a two-stage virtual impactor with a lower cutpoint of 2.5 μm. The fine particle concentrator concentrates particles with aerodynamic diameter ranging from 0.15 to 2.5 μm using a high-volume conventional impactor with a 2.5-μm cutpoint, and three virtual impactors in series with a lower cutpoint of 0.15 μm. In the coarse and fine concentrators, particles smaller than the lower cutpoint are in theory neither concentrated nor removed. In the ultrafine concentrator, ambient aerosols are drawn through a size-selective inlet where particles larger than 2.5 μm are removed. Subsequently, the airstream is drawn sequentially through a water saturator and condenser, creating saturated and then supersaturated conditions, causing the ultrafine particles to grow to super-micrometer aqueous droplets. Use of the optimum super saturation ratio (∼2.9 to 3.1) is important to ensure the growth of all the particles. At a lower super saturation ratio (<2.9), the maximum CEF may not be achieved, and hygroscopic species may grow better than nonhygroscopic species (Gupta et al. Citation2004b). The grown particles are then drawn through two virtual impactors with an overall 1-μm cutpoint. After enrichment, the original ambient particle size distribution is restored in a thermal–dilution dryer, where the concentrated airstream (50 L/min) is diluted with hot (146°C) filtered air (8 L/min) and heated to 35°C. The concentrated airstream is cooled down to room temperature via a cooled-glycol external-jacket conditioner, and particles larger than 0.2 μm are then removed by inertial impaction (PUF) in a size selective outlet. Harvard's high-volume ultrafine concentrator differs from the University of Southern California's low volume versatile aerosol concentration enrichment system (VACES). The VACES for ultrafine particles draws ambient air at much lower flow rate (110 L/min), grows the particles via supersaturation, concentrates them, and delivers concentrated airstream at a flow rate of 5 L/min. The concentrated grown particles are dried via diffusion dryer (Kim et al. Citation2001).
2.2. Semi-Continuous Measurements of Physical Characteristics
During the characterization period (February 19−25 to March 3, 2010), simultaneous measurements of particle size, number, and mass (PM1, PM2.5, and PM10) of APM and CAP were performed between 8:30 am and 5:00 pm using one of the three concentrators on different days. Aerosol filter samples were also collected in triplicate on 37-mm Teflon, 47-mm Teflon, and 47-mm quartz fiber filters so as to measure the biological response in vitro, ROS production capacity, and chemical composition of concentrated particles, respectively. For CAP measurements, the concentrated airstream was sampled isokinetically from the piping just before the exposure chamber. For APM measurements, ambient air entering the concentrator system was sampled isokinetically through a stainless steel pipe (diameter: 3/4′′) and the flow was directed to different instruments. presents the relevant instrument setup used during the characterization period.
FIG. 1 Experimental setup: APS, Aerodynamic Particle Sizer; FMPS, Fast Mobility Particle Sizer; SMPS, Scanning Mobility Particle Sizer. For PM collection, 37-mm Teflon, 47-mm Teflon, and quartz filters were used. Total inflow for all the three concentrators were 5000 L/min, and outflows for coarse, fine, and ultrafine concentrators were 52, 56, and 66 L/min, respectively.
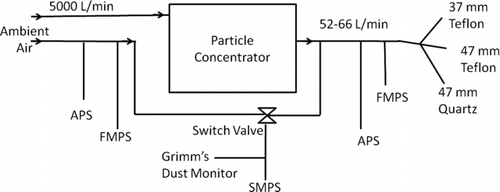
Two instruments were used in pairs for the measurement of particle number concentration and size distribution in the ambient and concentrated airstreams: a Fast Mobility Particle Sizer (FMPS, Model 3091 TSI) for particle sizes from 5.6 to 560 nm, and an Aerodynamic Particle Sizer (APS, Model 3321, TSI) for particle sizes from <0.5 to 10 μm ().
The FMPS charges the particles with a unipolar corona charger and subsequently uses 22 electrometer channels to measure the number and size distributions of particles from 5.6 to 560 nm in 32 channels (16 channels per decade) with 1-s time resolution based on their electrical mobility. Due to distortions associated with the particle number counting and sizing efficiency of the FMPS, data for particles in the size range of 8–100 nm were corrected, using the approach reported by Jeong and Evans (Citation2009). The APS measured the size distribution of particles from 0.5 to 20 μm aerodynamic diameter with 1-min time resolution using time-of-flight and light scattering techniques. Mobility diameters determined by the FMPS (mobility diameter) were converted into aerodynamic diameters using a particle density of 1.6 g/cm3 (Khlystov et al. Citation2004) and shape factor of 1, assuming spherical particles, and combined with the APS data to obtain the complete size distribution of ambient particles, or concentrated particles coming from the fine and coarse concentrators.
A set of instruments was connected to a Swagelok solenoid three-way ball valve that was switched between ambient and concentrated airstreams every 10 min. The number concentration and size distribution (10–800 nm) of particles were also measured with a scanning mobility particle sizer (SMPS) comprised of long differential mobility analyzer (DMA, TSI 3081) and condensation particle counter (CPC, TSI 3010). Mass concentrations (PM1, PM2.5, and PM10) were measured with a portable GRIMM dust monitor (Series 1.100, GRIMM Aerosol Technik, GmbH), which uses light-scattering technology for single particle counting.
FIG. 2 Size distribution with respect to averaged particle number concentration (N), surface area (S), and volume (V) of (a) ambient particulate matter (APM) and (b) concentrated ambient particulates (CAP), during characterization of the coarse concentrator on different days [D1 (Feb 19) and D2 (Feb 22)]. Y- and X-axes are on log scale. (Color figure available online.)
![FIG. 2 Size distribution with respect to averaged particle number concentration (N), surface area (S), and volume (V) of (a) ambient particulate matter (APM) and (b) concentrated ambient particulates (CAP), during characterization of the coarse concentrator on different days [D1 (Feb 19) and D2 (Feb 22)]. Y- and X-axes are on log scale. (Color figure available online.)](/cms/asset/827c34b5-0022-4bb8-9ab1-9cbd8234c3e6/uast_a_686674_o_f0002g.jpg)
During the HEAT campaign, the air inflow rate was ∼5000 L/min for all the concentrators, and the total outflow rates of the coarse, fine, and ultrafine concentrators were 52, 56, and 66 L/min, respectively, estimated by summing up the flow rates of all the instruments and filters (see , instruments not relevant to this article are not shown).
The coarse concentrator was characterized on February 19 and February 22, fine concentrator on February 23 to February 25, and ultrafine concentrator on March 3. During the rest of the campaign (March 2, 4−19), the FMPS and APS were removed from the concentrated airstream and corresponding airflow rates were compensated by increasing the sampling airflow rate to the aerosol filters so as to maintain the same minor (concentrated air) flow.
3. RESULTS AND DISCUSSIONS
3.1. Characterization of the Concentrators
3.1.1. Particle Size Distribution
Daily averaged size and number distributions of ambient and concentrated particles were compared for different concentrators on different days during the characterization period (see Figures –). These figures also present surface area and volume distributions for the APM and CAP derived from measured number concentrations. In ambient air, maximum number concentrations were observed for 10–30 nm particles, suggesting that fresh emissions from vehicles were a major source of ultrafine particles.
FIG. 3 Size distribution with respect to averaged particle number concentration (N), surface area (S), and volume (V) of (a) ambient particulate matter (APM) and (b) concentrated ambient particulates (CAP), during characterization of the fine concentrator on different days [D1 (Feb 23), D2 (Feb 24), and D3 (Feb 25)]. X-axis is on log scale. (Color figure available online.)
![FIG. 3 Size distribution with respect to averaged particle number concentration (N), surface area (S), and volume (V) of (a) ambient particulate matter (APM) and (b) concentrated ambient particulates (CAP), during characterization of the fine concentrator on different days [D1 (Feb 23), D2 (Feb 24), and D3 (Feb 25)]. X-axis is on log scale. (Color figure available online.)](/cms/asset/50f1db0c-3417-41dd-880c-f4e947b7578c/uast_a_686674_o_f0003g.jpg)
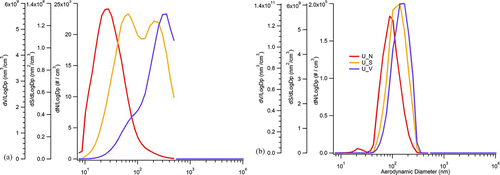
FIG. 4 Size distribution with respect to averaged particle number concentration (N), surface area (S), and volume (V) of (a) ambient particulate matter (APM) and (b) concentrated ambient particulates (CAP), based on FMPS data during characterization of the ultrafine concentrator on March 3. X-axis is on log scale. (Color figure available online.)
Characterization of the coarse concentrator was carried out on two different days (February 19 and 22). The particle size distributions in the ambient and concentrated airstreams were found to be similar for the range <1 μm, although the absolute particle number concentrations in this size range for both ambient and concentrated air were higher on February 22 (). The mode for the concentrated coarse particles was ∼2.2 μm (). The lower cutpoint of the coarse concentrator was found to be below that desired (discussed in Section 3.1.2), indicating a significant amount of fine PM was being included in the concentrated coarse PM. The majority of the particle volume was in the coarse size range as intended (). The vast majority of the particles in the concentrated coarse airstream (by number) were in the fine and ultrafine range, even though these particles were not being concentrated by the system, and this varied between days (). Similarly, a significant proportion of the surface area was in the accumulation mode range ().
The fine concentrator (PM2.5 inlet) was characterized on three different days (February 23, 24, and 25). Size distributions based on particle number, surface area, and volume for CAP and APM during this period are presented in . Among these days, small accumulation mode particles (200–300 nm) were highest on February 23, whereas relatively larger particles (∼2 μm) were highest on February 24 in the ambient and concentrated airstreams (). The lowest number concentrations over all sizes were observed on February 25. In the concentrated airstream, enrichment in number concentration was observable for particles >0.1 μm with a major peak of concentrated fine particles in the 0.2–0.4 μm range (accumulation mode). As per the design, the intended upper and lower cutpoints of the fine concentrator are 0.15 and 2.5 μm, respectively, and the characterization confirmed that the fine concentrator was performing as expected (). Similar to the case of the coarse concentrator, the particle number concentrations in the unconcentrated size range (<0.1 μm) were significant.
Thus in case of coarse and fine concentrators, particle number and/or surface area in the unconcentrated size range may influence results when comparing exposures to CAP versus filtered air, particularly if these parameters have a greater influence on some health-related endpoints than particle mass. This argument illustrates the value of examining the entire size distribution, and not just the size range being concentrated, when characterizing concentrator systems.
The ultrafine concentrator was initially characterized on March 3. This concentrator is most prone to have effects on the particle physicochemical characteristics as a result of the growth and drying involved in the concentration process. depicts the size distribution in terms of particle number, surface area, and volume for the CAP and APM on March 3. The mode of the particle-number-based size distribution shifted from ∼25 nm for ambient particles to ∼90 nm for concentrated particles. Su et al. (Citation2006) documented the characterization of Harvard's high-volume ultrafine concentrators at various locations (Rochester, Boston, and Chapel Hill). They also observed a shift in size distribution at Rochester and Boston where ambient particles had a mode at ∼10 to 20 nm. However, they found that ambient and concentrated particles exhibited similar size distributions at Chapel Hill with a mode at ∼70 to 100 nm. They attributed the observed size shift at Rochester and Boston to inefficient particle growth/drying. Our observations indicate that size restoration of ultrafine particles also depends upon the mode of the ambient particles, and the restoration may not occur efficiently when this mode is small (<30 nm), as discussed later in this section.
FIG. 5 Number-concentration-based size distribution of concentrated and ambient particulate matter with the ultrafine concentrator during the last week of the campaign. Note: CAP, concentrated ambient particulate; APM, ambient particulate matter. (Color figure available online.)
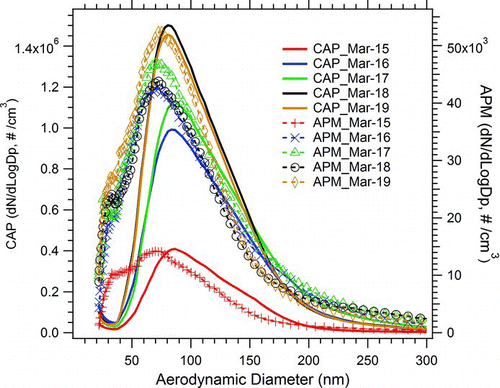
The average calculated super saturation ratio prior to the condensation phase on March 3 was 2.67 ± 0.09, which was lower than the optimum super saturation ratio of 2.9–3.1 (Gupta et al. Citation2004a). Gupta et al. (Citation2004a) documented that a lower super saturation ratio can result in a lower enrichment factor. The total particle number concentrations in ambient and concentrated airstreams measured by the FMPS indicated a lower enrichment factor: ∼5 (observed) instead of ∼40 (expected). The ultrafine concentrator was also run during the last week of the campaign (March 15−19) with a super saturation ratio of 2.85–2.92 (similar to the optimum value). During this period, the number CEF with respect to total particle concentration in ambient and concentrated airstreams ranged between 16 and 23. These values were, however, still lower than expected (∼40), suggesting that the actual supersaturation ratio in the system was still too low, or that the super saturation ratio was not the only parameter controlling the enrichment factor. The whole-day averaged number concentrations and size distributions of ambient and concentrated particles measured with the SMPS during March 15 to March 19 are presented in . The size distribution of ambient particle number concentration was slightly bimodal on most days with a minor mode at ∼30 nm and major mode at ∼60 nm (). However, the size distribution of concentrated particles was unimodal with a mode around 80 nm (), that is, the minor mode was missing from the concentrated particles size distribution. On March 3, the size distribution of ambient particles was unimodal with the mode at ∼30 nm but the concentrated particle size distribution was again unimodal, with a mode at ∼90 nm (). Particles smaller than 30 nm were essentially absent in the concentrated airstream. Thus, these particles were either being lost during the concentration process, by deposition or evaporation, or not being restored back to their original size. The observations also suggest that the extent to which concentrator restored the size distribution depended on the distribution of the ambient particles, with a higher mode in the ambient particle distribution yielding a better size restoration.
In order to test whether the size restoration of the ultrafine concentrator was affected by the mode of the original ambient particles, experiments were performed using laboratory-generated particles of known composition. The inlet airstream (5000 L/min) was directed through a HEPA filter, and (NH4)2SO4, NH4NO3, or gold colloid particles were injected into the filtered air. These particles were generated with an atomizer (TSI 3076) and dried by diffusion dryer before injection. The size distributions and number concentrations were measured before and after concentration (). Interestingly, (NH4)2SO4 and NH4NO3 particles with a size distribution mode at ∼100 nm for nonconcentrated particles exhibited satisfactory size restoration, but the gold colloid particles with the mode at ∼30 to 40 nm for nonconcentrated particles exhibited a mode ∼70 to 80 nm for concentrated particles.
FIG. 6 Number-concentration-based size distribution of concentrated (left axis) and nonconcentrated (right axis) known particles, and their ratio for each size bin while testing the ultrafine concentrator.
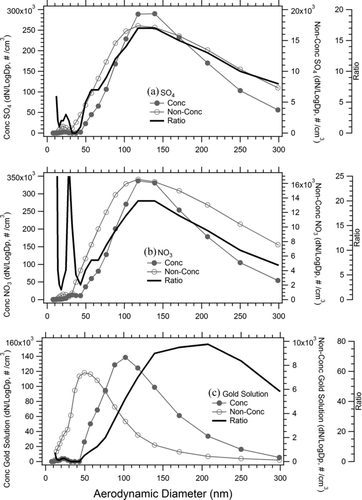
Various explanations for the shift in size distribution of ultrafine ambient particles were postulated: inefficient growth of very small particles (<30 nm) with subsequent loss to the major airstream within the virtual impactors, inefficient water removal from grown particles during the drying process, and/or aqueous phase chemistry within the droplets causing irreversible growth. The results for the gold particles pointed to irreversible growth as the most credible explanation. Concentration factors of up to 70 were observed for the larger gold particles (). These values are higher than the values of ∼20 observed for similar sized NH4NO3 particles. Further, the change in mode diameter from ∼35 to ∼75 nm for the gold particles would be consistent with the irreversible accumulation of 0.2 fg of mass on each particle (assuming ρ = 1.6 g/cm3), possibly due to condensation and/or processing. McWhinney et al. estimated a mass accumulation of ∼0.6 fg/particle that was similar in magnitude. This growth was interpreted in terms of aqueous phase organic chemistry, leading to the enhancement of organic mass on particles. This growth was also apparent in the form of much higher CEFs for organics than that for ammonium salts (McWhinney et al. Citation2012). Su et al. (Citation2006) also observed additional organic mass in concentrated ultrafine particles. This hypothesis of irreversible growth is explored in greater detail in the companion article (McWhinney et al. Citation2012). This hypothesis is also consistent with the observed shift in size distribution at Rochester and Boston where ambient particles had a mode at ∼10 to 20 nm and no shift at Chapel Hill with a mode at ∼70 to 100 nm (Su et al. Citation2006). Irreversible growth through the addition of fg/particle amounts of mass would cause 10–20 nm particles to grow substantially, while the shift for 100 nm particles might not be detectable.
3.1.2. Lower and Upper Cutpoints for Each Concentrator
Enrichment depends upon the ratio of inlet to outlet (minor) airflows. Lower and upper cutpoints of a concentrator can be estimated from efficiency curves based on the collection efficiency of different sized particles. For a particular diameter particle, particle collection efficiency for a virtual impactor can be calculated as follows (Demokritou et al. Citation2003):
FIG. 7 Effective collection efficiencies as a function of particle size for all three concentrators on each of the characterization days. X-axis is on log scale.
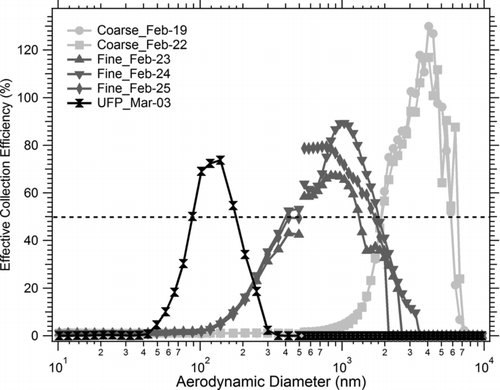
The impact of the deviations in the effective cutpoints was evaluated by estimating the fraction of CAP in the desired size range with respect to particle number and mass concentrations for each concentrator. For the coarse concentrator, 33% and 70% of the particles, by number and mass, respectively, were within the desired size range (2.5–10 μm), as apparent from number and volume distributions in . The corresponding values were 90% by number and 99% by mass for the fine concentrator, and 99% by number and 100% by mass for the ultrafine concentrator. These observations suggest that the fine and ultrafine concentrators worked as desired in terms of the particle size distributions, even though the upper and lower cutpoints were not ideal. However, the coarse concentrator suffered from a significant bias, as only 70% of the coarse CAP with respect to particle mass was PM2.5–10. The bias was predominantly due to the inclusion of some 1.0–2.5 μm particles. Despite this overlap, the chemical composition of the coarse CAP still differed substantially from that of the fine CAP (Rastogi et al. in preparation). The observation that only 33% of the particles by number were in the desired size range further points to the value of examining the entire size distribution when characterizing concentrator systems.
3.1.3. Concentration Enrichment Factors
The CEF for different measured components was estimated as the ratio of their concentrations in the concentrated to ambient airstreams for each concentrator. The CEF mainly depends upon the ratio of minor (concentrated) to total inlet (ambient) airflow rate, collection efficiency, and fractional particle losses (Sioutas et al. Citation1997; Demokritou et al. Citation2003). The CEF is an important parameter to assess the proper operation of any concentrator.
3.1.3.1. Enrichment with respect to number concentration for each size fraction
The number CEFs, defined as the ratio of the particle number concentrations in the concentrated flow to those in ambient air for each size bin from 10 nm to 10 μm, are depicted in . The data presented in are mean values of the hourly CEF, with error bars representing the corresponding standard deviation for the day. The CEFs exhibit substantial variability as a function of size indicating that the concentration process was not uniform over particle size. The peak CEF (∼130) occurred at a particle aerodynamic diameter of ∼4.0 μm for the coarse concentrator, and between 0.7 and 1.0 μm (CEF from 60 to 80) for the fine concentrator. These peak CEF values were similar to the theoretical values of 96 (5000/52) and 89 (5000/56) based on the ratio of the inlet to minor flow rates of the coarse and fine concentrators, respectively. The CEF values for particles with aerodynamic diameters close to the upper or lower cutpoints of the concentrators were substantially lower than the CEF for particles with diameters in the middle of the concentrator size range (). In the case of the ultrafine concentrator, a peak number CEF of 56 was observed for 100–120 nm particles as compared with the theoretical CEF value of 76 (5000/66). Overall the observed CEFs were lower than the theoretical values based on the flow rates for the fine and ultrafine concentrators, but higher for the coarse concentrator. There was large variability associated with the elevated CEF value of up to ∼130 for particles diameter ∼4 μm in case of the coarse concentrator (); statistically, it did not differ significantly from the theoretical value of 96. This difference may have been due to higher losses of larger particles in the ambient airstream sampling line in comparison to the losses when sampling from the concentrated airstream.
FIG. 8 The number concentration enrichment factor as a function of particle size based on the hourly averaged data on each day. The error bars represent the standard deviation on the hourly data. X-axis is on log scale.
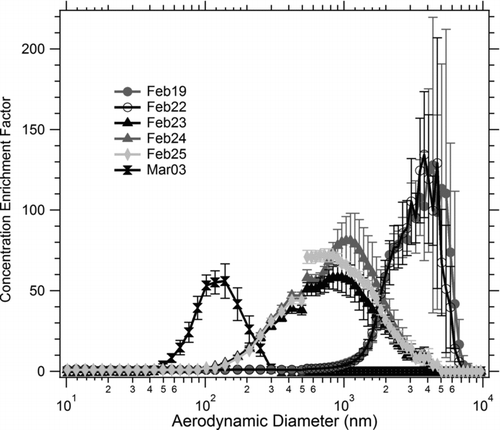
The error bars on the CEF values reflected the hourly temporal variability in the performance of each concentrator. This variability was usually between ∼5% and 30% for all the three concentrators with the exception of the larger variability (30%–80%) for particle >4.0 μm in the case of coarse concentrator on both characterization days (). This was due in part to the low number of large particles measured in the ambient airstream. Temporal variability in the number CEF of fine concentrator was different on different days, lowest (within 10%) on February 25 (clean day) and higher on February 23 and 24 (5%–30%), which were relatively polluted days. The number CEF of ultrafine concentrator exhibited 10%–30% hour-to-hour variability.
3.1.3.2. Enrichment with respect to particle mass concentration
The mass CEFs were estimated for all three concentrators using PM1, PM2.5, and PM10 data from the portable GRIMM dust monitor. Ambient and concentrated PM2.5–10, PM2.5, and PM0.2 mass data were used to calculate the mass CEF for the coarse, fine, and ultrafine concentrators, respectively. Use of concentrated and ambient PM2.5 mass to estimate the mass CEF of the fine concentrator (size range 0.15–2.5 μm) should not have introduced any significant error because the fraction of the volume/mass of particles <0.15 μm in the ambient airstream was small in comparison to PM0.15–2.5 mass (). In the case of the ultrafine concentrator, the mass CEF values for the ultrafine particles could not be measured directly. The only ambient mass measurement available was for PM1, while for the concentrated airstream, the mass measurement was for PM0.2 because of the concentrator's 0.2 μm cutoff (). To estimate a PM0.2 value for the ambient airstream, the volume-based size distributions measured with the SMPS were converted into mass concentrations, using a particle density of 1.6 g/cm3, so as to estimate the mass fraction of PM1 present as PM0.2. The ambient PM0.2/PM1 mass fraction ranged from 0.33 to 0.38 with an average value of 0.36 for all the days when the ultrafine concentrator was running. This factor was applied to the ambient PM1 mass measured by the GRIMM so as to estimate the mass CEF for the ultrafine concentrator [mass CEF = (PM1 of CAP)/(0.36*PM1 of APM)]. Overall, the mass CEF varied from 70 to 129 (103 ± 26, mean ± SD, n = 6 days), 23 to 51 (36 ± 11, n = 6), and 19 to 39 (28 ± 9, n = 5), for the coarse, fine, and ultrafine concentrators, respectively, on a day-to-day basis.
Lawrence et al. (Citation2004) characterized a fine particle concentrator over ∼3 years at Boston, USA. They found an average CEF of ∼28 with respect to particle mass, and the variability in the mass CEF was predominantly associated with MMAD of the ambient particles and pressure drop across the concentrator system. Keeler et al. (Citation2005) reported an average mass CEF of ∼5 to 13 for a fine concentrator. In our case, an effect due to pressure drop is unlikely because all the slits in the system were cleaned right before the campaign that lasted for approximately a month for whole system, and only approximately a week for each concentrator. However, MMAD was variable during campaign and could be the reason for the variability in mass CEF for fine concentrator; firm statements could only be made based on a long-term study.
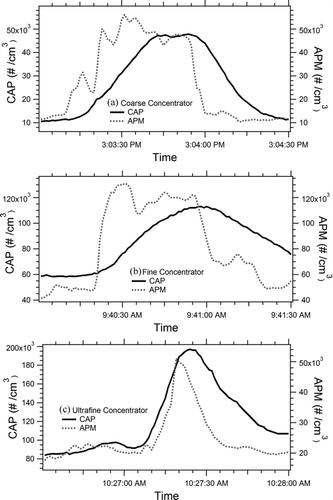
FIG. 9 Capability of the concentrators to capture transient events. Note: CAP, concentrated ambient particulate; APM, ambient particulate matter.
3.1.4. Capturing Transient Events in Ambient Particle Concentrations
Ambient particle concentrations near busy roadways (e.g., our site) can fluctuate substantially due to the presence of highly emitting vehicles such as heavy diesel trucks or poorly tuned cars. Particle number concentrations were simultaneously measured in the ambient and concentrated airstreams with a sampling rate of 1 Hz during the characterization period and these data were used to investigate how rapid transient events in the ambient air particle concentration are captured by the concentrators. As such transient events are most frequently associated with ultrafine particle number concentrations, only the FMPS data were examined. –c show three transient events with brief spikes in the ambient air total particle concentrations and the corresponding transient in the concentrated airstream. The concentrator smoothed out the transients as a result of mixing within the system with a response time of 10–20 s; a delay in the peak concentration of 20–30 s was also apparent ( and b). In case of the ultrafine concentrator, surprisingly, no significant delay was detectable ().
4. CONCLUSIONS
High-volume coarse, fine, and ultrafine concentrators were characterized in terms of their full-number-, surface-area-, and volume-based size distributions. This approach revealed that particles in the unconcentrated size ranges made significant contributions to the particle number and surface area present in the concentrated airstreams of the fine and coarse concentrator. Further transients in the ambient ultrafine particle concentrations were evident as dampened signals in these concentrated airstreams. Depending on the metric involved in exerting physiological effects, the smaller unconcentrated particles remaining after concentration of coarse and fine particles could potentially influence results when comparing exposures to CAP versus filtered air, particularly if these parameters (surface area or particle number) have a greater influence on some health-related endpoints than particle mass. Thus, it is important to examine the entire size distribution, and not just the size range being concentrated, when characterizing concentrator systems.
The ultrafine concentrator caused a shift in the size distribution suggestive of irreversible growth as a result of the concentration process. This shift was most evident when small particles (20–40 nm) dominated the input particle size distribution; the shift was not apparent when the mode was closer to 100 nm. It is implicit that these findings are relevant to the Harvard systems and cannot necessarily be generalized to other existing concentrator systems that use a different design and/or technology.
Acknowledgments
Funding for SOCAAR was provided by the Canadian Foundation for Innovation, the Ontario Innovation Trust, and the Ontario Research Fund. Operational funding for this study was provided by NSERC (Natural Sciences and Engineering Research Council of Canada) and CIHR (Canadian Institutes of Health Research). We also thank Gang Lu for his help in setting up the GRIMM dust monitor.
REFERENCES
- Akhtar , U. S. , Rastogi , N. , McWhinney , R. D. , Urch , B. , Fila , M. , Abbatt , J. P. D. , Silverman , F. , Evans , G. L. and Scott , J. A. 2012 . Comparative Toxicity of Size-Fractionated Ambient Particulate Matter in Human Airway Epithetical Cells. (In preparation) .
- Amatullah , H. , North , M. L. , Akhtar , U. S. , Rastogi , N. , Urch , B. Silverman , F. S. 2012 . Comparative Cardiopulmonary Effects of Size-Fractionated Airborne Particulate Matter . Inhal. Toxicol. , 24 ( 3 ) : 161 – 171 .
- Becker , S. , Dailey , L. A. , Soukup , J. M. , Grambow , S. C. , Devlin , R. B. and Huang , Y. C. 2005 . Seasonal Variations in Air Pollution Particle-Induced Inflammatory Mediator Release and Oxidative Stress . Environ. Health Perspect. , 113 : 1032 – 1038 .
- Dabek-Zlotorzynska , E. , Dann , T. F. , Martinelango , P. K. , Celo , V. , Brook , J. R. Mathieu , D. 2011 . Canadian National Air Pollution Surveillance (NAPS) PM2.5 Speciation Program: Methodology and PM2.5 Chemical Composition for the Years 2003–2008 . Atmos. Environ. , 45 : 673 – 686 .
- Delamora , J. F. , Hering , S. V. , Rao , N. and McMurry , P. H. 1990 . Hypersonic Impaction of Ultrafine Particles . J. Aerosol. Sci. , 21 ( 2 ) : 169 – 187 .
- Demokritou , P. , Gupta , T. , Ferguson , S. and Koutrakis , P. 2003 . Development of a High-Volume Concentrated Ambient Particles System (Caps) for Human and Animal Inhalation Toxicological Studies . Inhal. Toxicol. , 15 ( 2 ) : 111 – 129 .
- Demokritou , P. , Gupta , T. and Koutrakis , P. 2002 . A High-Volume Apparatus for the Condensational Growth of Ultrafine Particles for Inhalation Toxicological Studies . Aerosol Sci. Technol. , 36 ( 11 ) : 1061 – 1072 .
- Gupta , T. , Demokritou , P. and Koutrakis , P. 2004a . Development and Performance Evaluation of a High-Volume Ultrafine Particle Concentrator for Inhalation Toxicological Studies . Inhal. Toxicol. , 16 : 1 – 12 .
- Gupta , T. , Demokritou , P. and Koutrakis , P. 2004b . Effects of Physico-Chemical Properties of Ultrafine Particle on the Performance of an Ultrafine Particle Concentrator . Aerosol Sci. Technol. , 38 ( 2 ) : 37 – 45 .
- Hering , S. V. and Stolzenburg , M. R. 1995 . Online Determination of Particle- Size and Density in the Nanometer-Size Range . Aerosol Sci. Technol. , 23 ( 2 ) : 155 – 173 .
- Jeong , C.-H. and Evans , G. J. 2009 . Inter-Comparison of a Fast Mobility Particle Sizer and a Scanning Mobility Particle Sizer Incorporating an Ultrafine Water-Based Condensation Particle Counter . Aerosol Sci. Technol. , 43 : 364 – 373 .
- Jeong , C.-H. , McGuire , M. , Herod , D. , Dann , T. , Dabek-Zlotorzynska , E. Wang , D. 2011 . Receptor Model Based Identification pf PM2.5 Sources in Canadian Cities . Atmos. Pollu. Res. , 2 : 158 – 171 .
- Keeler , G. J. , Morishita , M. and Young , L.-H. 2005 . Characterization of Complex Mixtures in Urban Atmospheres for Inhalation Exposure Studies . Experim. and Toxico. Patho. , 57 : 19 – 29 .
- Kim , S. , Jaques , P. A. , Chang , M. , Froines , J. R. and Sioutas , C. 2001 . Versatile Aerosol Concentration Enrichment System (VACES) for Simultaneous In Vivo and In Vitro Evaluation of Toxic Effects of Ultrafine, Fine and Coarse Ambient Particles. Part I: Development and Laboratory Characterization . J. Aerosol Sci. , 32 ( 11 ) : 1281 – 1297 .
- Khlystov , A. , Stanier , C. and Pandis , S. N. 2004 . An Algorithm for Combining Electrical Mobility and Aerodynamic Size Distributions Data When Measuring Ambient Aerosol . Aerosol Sci. Technol. , 38 ( S1 ) : 229 – 238 .
- Lawrence , J. , Wolfson , J. M. , Ferguson , S. and Koutrakis , P. 2004 . Performance Stability of the Harvard Ambient Particle Concentrator . Aerosol Sci. Technol. , 38 : 219 – 227 .
- McWhinney , R. D. , Rastogi , N. , Urch , B. , Silverman , F. , Brook , J. R. Evans , G. J. 2012 . Characterization of the University of Toronto Concentrated Aerosol Particle Exposure Facility (CAPEF)—Effects on Fine and Ultrafine Non-Refractory Aerosol Composition . Aerosol Sci. Technol. , 46 : 697 – 707 .
- Oberdorster , G. , Oberdorster , E. and Oberdorster , J . 2005 . Nanotoxicology: An Emerging Discipline Evolving from Studies of Ultrafine Particles . Environ. Health Perspect. , 113 : 823 – 839 .
- Rastogi , N. and Evans , G. J. 2012 . Chemical Composition of PM2.5–10, PM0.15–2.5, and PM0.2 Collected With High Volume Particle Concentrations Over Downtown Toronto. (in preparation) .
- Samet , J. M. , Dominici , F. and Curriero , F. C. 2000 . Fine Particulate Air Pollution and Mortality in 20 U.S. Cities, 1987–1994 . N. Engl. J. Med. , 343 : 1742 – 1749 .
- Sioutas , C. , Koutrakis , P. and Burton , R. M. 1995 . A Technique to Expose Animals to Concentrated Fine Ambient Aerosols . Environ. Health Perspect. , 103 : 172 – 177 .
- Sioutas , C. , Koutrakis , P. , Godleski , J. J. , Ferguson , S. T. , Kim , C. S. and Burton , R. M. 1997 . Fine Particle Concentrators for Inhalation Exposures—Effect of Particle Size and Composition . J. Aerosol Sci. , 28 ( 6 ) : 1057 – 1071 .
- Su , Y. , Sipin , M. F. , Spencer , M. T. , Qin , X. , Moffet , R. C. Shields , L. G. 2006 . Real-Time Characterization of the Composition of Individual Particles Emitted from Ultrafine Particle Concentrators . Aerosol Sci. Technol. , 40 : 437 – 455 .
- Zereini , F. and Wiseman , C. L. S. 2011 . Urban Airborne Particulate Matter: Origin, Chemistry, Fate and Health Impacts , Berlin : Springer . doi: 10.1007/978-3-642-12278-1