Abstract
We examine the nucleated (with barrier) activation of perfectly wetting (zero contact angle) particles ranging from essentially bulk size down to approximately 1-nm mass diameter. While similar studies trace back to the pioneering work of Fletcher, we present here a novel approach to the analysis based on general area constructions that enable key thermodynamic properties, including surface and bulk contributions to nucleation work, to be interpreted geometrically with reference to the Kelvin curve. The kinetics of activation are described in more detail in terms of the mean first passage time (MFPT) for barrier crossing. MFPT theory and benchmark calculations are used to develop and test a new approximate-but-simpler-to-use analytic expression for the barrier crossing rate. The present study is motivated by recent condensation particle counter (CPC) studies that appear to finally establish the long-predicted detection of “sub-Kelvin” particles in the nano-size regime. Corresponding states thermodynamic and kinetic scaling approaches are used to facilitate the correlation and selection of optimal CPC working fluids and operating conditions based on a new metric for heterogeneous nucleation, the signal-to-noise ratio, and physical and chemical properties.
Copyright 2012 American Association for Aerosol Research
1. INTRODUCTION
Striking advance has been made over the past several years in condensation particle counter (CPC) development, enabling particles in the sub-3-nm diameter range approaching the size of molecular clusters to be routinely detected in the laboratory (Winkler et al. Citation2008; Iida et al. Citation2009; Sipila et al. Citation2009; Vanhanen et al. Citation2011) and in the atmosphere (Jiang et al. Citation2011). This breakthrough in instrumentation calls for a re-examination of the foundations of the heterogeneous nucleation theory, still largely based on the capillarity approximation (Fletcher Citation1958), wherein even small clusters are modeled as bulk-property liquid drops with simplified kinetics. Fletcher's theory predicts heterogeneous nucleation, driven by thermal fluctuations, for the activation of very small particles (less than about 6 nm), whereas larger particles undergo a transition to barrierless growth at the Kelvin limit. Activation by nucleation below the Kelvin limit is a key factor in lowering the detectable size, but only recently has the process been definitively observed (Winkler et al. Citation2008). Another important development has been the screening of multiple CPC working fluids for optimal detector performance in the sub-3-nm regime (Magnusson et al. Citation2003; Iida et al. Citation2009).
The present study has several objectives, beginning with re-examination of the theory. Any improvement over Fletcher's analysis is not easily done. One can contemplate a first-principles molecular simulation, but an accurate prediction of nucleation rate requires more realistic model potentials than are presently available. Molecular dynamics and Monte Carlo-based simulations of nucleation, which utilize the model potentials, are particularly useful at establishing trends—e.g., identifying even small systematic departures from the classical nucleation theory—but such simulations are beyond the scope of the present study. Instead, we continue to rely on the capillarity approximation for estimating the thermodynamic properties needed for the theory, while focusing on improving the kinetics. For this, an analysis of the mean first passage times (MFPTs) required for the aggregate of molecular evaporation/condensation growth steps to reach and exceed the size of the critical cluster (consisting of seed particle plus condensate) is presented. Recent results from Wedekind et al. (Citation2007) are extended for this purpose to the kinetics of heterogeneous nucleation. Series expansions for MFPT and nucleation rate are evaluated numerically and used to derive a simple analytic expression for predicting the heterogeneous nucleation rate. Comparison with the full MFPT calculation shows the approximate formula to be accurate to within a few percentage points for nucleation barrier heights in excess of about 5 kT—a range well covering the region of interest to the present study.
Although physical and chemical properties are derived from the capillarity approximation, a new approach to the thermodynamic analysis is presented. As described in Section 2, the approach is based on graphical constructions derived from the Kelvin curve. There are several reasons for pursuing the new approach: it provides convenient area constructions for homogeneous and heterogeneous nucleation barriers and a graphical interpretation even for key kinetic terms, such as the Zeldovich factor, used in the newly derived rate expression. The method further simplifies the scaling analysis used to correlate working fluid performance in Section 5. Finally, the graphical approach provides a molecular-based framework that recovers results from the classical nucleation theory when the capillarity approximation is used, while retaining applicability even in cases where the classical theory fails (Section 6).
The new results are discussed in the context of early speculations on the application of nucleation and growth as a detection tool for single neutral molecules and clusters (Reiss et al. Citation1977). A full analysis of detection capability will require, among other considerations, going beyond Fletcher's theory and viewing heterogeneous nucleation as a multi-component molecular interaction process in the nano-size regime. Here, we take preliminary steps in this direction to show that the new formulation provides a molecular-level framework, rooted in mass action and detailed balance, which can be exploited to great advantage in attempts to go beyond the classical nucleation theory.
While the results reported here were in preparation, the authors learned of a similarly motivated study of heterogeneous nucleation, also based on the capillary theory and perfect wetting (Fernandez de la Mora Citation2011). Although there are similarities between the two studies, there are notable differences in approach. Differences include the introduction here of corresponding states scaling, MFPT kinetics, and novel area constructions that provide a basis for handling the departure from the capillary theory in the form of positive/negative deviations in equilibrium vapor pressure from the Kelvin relation.
2. THERMODYNAMIC AREA CONSTRUCTIONS
This section develops several graphical constructions for key thermodynamic properties that include nucleation barrier height, surface work, and barrier shape. The approach derives from the Kelvin relation, which gives the critical size (generally consisting of seed plus condensed fluid) as a function of vapor saturation ratio:
Barrier profiles for heterogeneous and homogeneous nucleation may be derived using thermodynamic area constructions similar to those introduced recently to analyze the deliquescence and efflorescence of small particles (McGraw and Lewis Citation2009). For vapor pressures given by the Kelvin relation, these relations are of the form:
FIG 1 Area constructions derived from the Kelvin curve. Solid curve is the Kelvin curve for water from EquationEquation (1). Horizontal dashed line is for a water vapor saturation ratio of 2 (relative humidity = 200%). The point of intersection marks the critical drop size, g*, consisting of the seed particle plus n*=g*− v seed/v 1 molecules of condensed water. See text for interpretation of labeled areas R 1−R 4 and the tangent line.
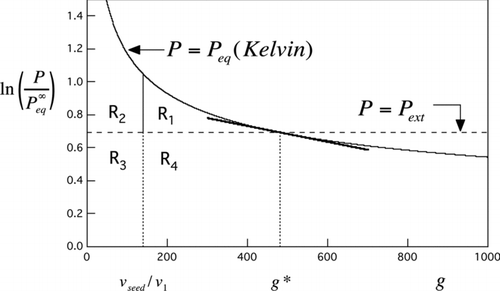
illustrates area constructions for both homogeneous and heterogeneous nucleation using water vapor at 200% relative humidity (RH) as an example. For the homogeneous case, the reduced barrier height is (Supplementary Information):
Several well-known, capillarity-based relations for the barrier height follow easily from the graphical construction when the vapor pressure is given by the Kelvin relation. Continuing with the homogeneous case, we obtain the following two equivalent results:
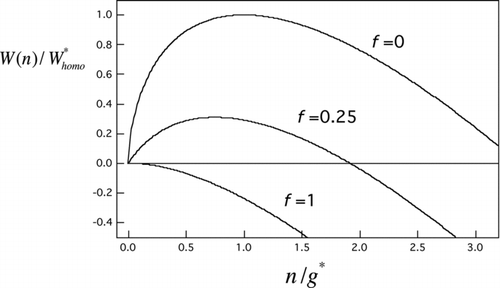
FIG 2 Scaled nucleation barrier profiles from EquationEquation (7) for several seed volume fractions (f=n seed/g*). Curves, top to bottom: homogeneous nucleation case (f=0), an intermediate heterogeneous nucleation case (f=0.25), and the Kelvin limit (f=1).
For use in the following section, we require the Zeldovich factor, which is a measure of barrier curvature at the critical size (Abraham Citation1974):
3. MFPT KINETICS AND ACTIVATION RATE
Consider a collection of condensate-free (n=0) seed particles, M, of initial vapor phase concentration [M]0=N(0), uniform diameter d seed, and zero contact angle for wetting by the working fluid. The subsequent uptake and exchange of molecules from the working fluid, present in the supersaturated vapor at concentration [F 1]=nv , is described by the following sequence of condensation/evaporation steps:
3.1. Model Assumptions
We use an exponential decay model (by Winkler et al. [Citation2008]):
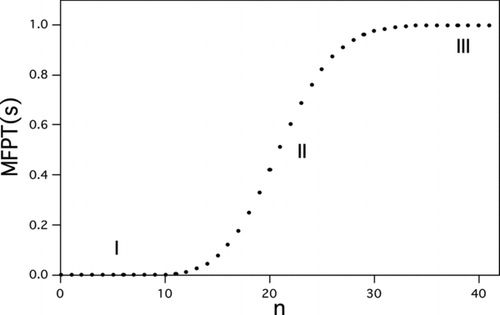
FIG 3 Typical behavior of the mean first passage time (MFPT) to reach a given cluster size as a function of that size. Here, n is the number of molecules condensed onto the seed. Region I, quasi-equilibrium between clusters of precritical size. Region II, inflection point at the critical size. Region III, rapid-growth regime. Calculations are for heterogeneous nucleation of l-menthol on a 1.5-nm-diameter seed. S ext=86.0, W*/kT=18.1, J 1=1 s−1.
3.2. Calculation of the MFPT
We classify un-activated (activated) particles as those belonging to size class ![]() and smaller (
and smaller (![]() and larger), where nmax=2n*. Our interest is primarily in the MFPT to reach
and larger), where nmax=2n*. Our interest is primarily in the MFPT to reach ![]() so defined, but a study for variable nmax, to show insensitivity to boundary placement at 2n* and verify other assumptions implicit in the exponential model, was also carried out. Let U be the domain of un-activated particles such that
so defined, but a study for variable nmax, to show insensitivity to boundary placement at 2n* and verify other assumptions implicit in the exponential model, was also carried out. Let U be the domain of un-activated particles such that ![]() for 0⩽n⩽nmax, and let PU
(t) be the probability that a seed that is condensate-free at t=0 remains in the un-activated domain at time t. Then, the fraction of particles leaving U at time t is −dPU
(t)/dt. By definition, the MFPT is the mean time it takes to leave U, which is (Hänggi et al. Citation1990):
for 0⩽n⩽nmax, and let PU
(t) be the probability that a seed that is condensate-free at t=0 remains in the un-activated domain at time t. Then, the fraction of particles leaving U at time t is −dPU
(t)/dt. By definition, the MFPT is the mean time it takes to leave U, which is (Hänggi et al. Citation1990):
Benchmark calculations are based on the following formula for the MFPT (Hänggi et al. Citation1990; Wedekind et al. Citation2007):
4. A SIMPLE BUT ACCURATE EXPRESSION FOR MFPT AND HETEROGENEOUS NUCLEATION RATE
illustrates a typical distribution of the MFPTs required to exceed any specified (seed plus condensate) particle size as a function of that size or, equivalently, as a function of the upper limit, nmax, in the double summation of EquationEquation (16). The steep inflection region centered at the critical size (region II) is indicative of a wide separation of time scales between the rapid quasi-equilibration of precritical particles (region I) and the significantly longer times required for barrier crossing and depletion of n, which occur on the order of τ=1/J 1. The figure also shows the MFPT to be insensitive to nmax sufficiently beyond the critical particle size (region III). Henceforth, we set nmax=2n*. Starting with EquationEquation (16), a simple but accurate expression can be derived for the MFPT and the per-particle heterogeneous nucleation rate. The result, with details of the derivation provided in the Supplementary Information, is:
4.1. Homogeneous Nucleation Rate
At high-enough saturation ratio, homogeneous nucleation of the vapor itself will compete with heterogeneous nucleation and interfere with particle detection, making the comparison of these two nucleation channels a necessary consideration. The homogeneous nucleation rate is (Abraham Citation1974)
FIG 4 Nucleation rates for menthol. Solid curve is the Kelvin limit. Dashed lines and curves are contours of constant nucleation rate. Horizontal lines: contours of constant homogeneous nucleation rate: top to bottom, J homo= 100, 1, and 0.01 cm−3s−1. Dashed curves give similar contours for the heterogeneous nucleation rate from the new approximate prefactor-exponent form: top to bottom, J hetero= 100, 1, and 0.01 cm−3s−1 for N=1 cm−3. Markers: results from the double-summation calculation for mean first passage time, J 1=1 cm−3s−1. These show excellent agreement with the approximate result (middle curve).
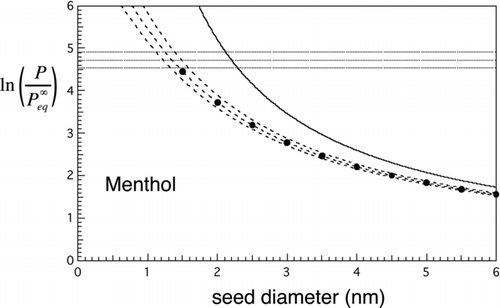
FIG 5 Nucleation rates for water. Solid curve is the Kelvin limit. Dashed lines and curves are contours of constant nucleation rate. Horizontal lines: contours of constant homogeneous nucleation rate: top to bottom, J homo=100, 1, and 0.01 cm−3s−1. Dashed curves give similar contours for the heterogeneous nucleation rate from the new approximate prefactor-exponent form: top to bottom, J hetero= 100, 1, and 0.01 cm−3s−1 for N=1 cm−3. Markers: results from the double-summation calculation for mean first passage time, J 1= 1 s−1. These show excellent agreement with the approximate result (middle curve).
4.2. Testing the New Rate Expression
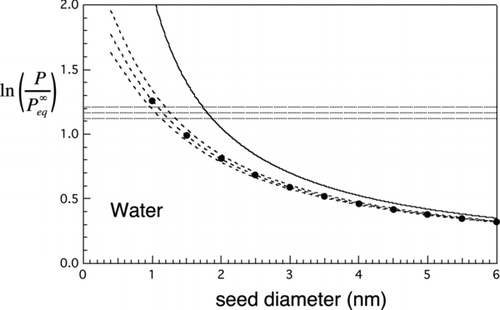
and show the Kelvin curve, together with the calculated homogeneous nucleation threshold range from EquationEquation (21) (here shown for rates within ±2 orders of magnitude of J homo=1 cm−3s−1) and heterogeneous nucleation threshold range from EquationEquation (18) (rates within ±2 orders of magnitude of J hetero=1 cm−3s−1, which numerically equals J 1(s−1) for N=1 cm−3). The filled circles are from the full double summation for the MFPT for τ=1 s (EquationEquation (16) with nmax=2n*) and should be compared with the approximate expression (middle curve) for J hetero=1. Agreement is excellent: to within about 5% in the case of menthol and 2% for water. The larger discrepancy for menthol is probably due to discretization error as the number of molecules in the critical nucleus is considerably less in the case of methanol than the case of water. Barrier heights where the unity nucleation rate thresholds intersect are 18.5 kT for menthol () and 18.3 kT for water (), i.e., much lower than for homogeneous nucleation, where typical barrier heights range between 50 and 70 kT (see Equation (26) below and parameters given in for calculation of the heterogeneous barrier height). Closer to the region where the seed diameter approaches the Kelvin diameter, e.g., for barrier heights lower than about 5 kT, the approximations used to derive the new analytic expression begin to fail and so the full double-summation formula for the MFPT should be used instead. The exponential decay model (EquationEquation (14)) will also fail in this regime as activation begins to take on less the character of a random barrier crossing process and more of deterministic growth. According to the 5 kT criterion, the simplified expression for heterogeneous nucleation rate can be used reliably for f⩽0.5 (or d seed/d Kelvin less than about 80%). This is the predominant range of interest anyway as the general goal is to achieve selective detection of the smallest particles, which is favored by being close to the heterogeneous nucleation threshold and well below the Kelvin limit. For f⩽0.5, the association factor is typically between 0.2 and 1, while 1/S ext typically exceeds 0.01. In the context of nucleation, such corrections are often regarded as small, but here, they are needed to achieve the few percentage level of accuracy with reference to the MFPT benchmark we have described.
TABLE 1 Parameters and scaling properties for the four working fluids included in and the theoretical minimum particle size (d min seed) that can be detected by each for N=1 cm−3 at the threshold conditions J homo=J hetero=1. Other properties include the critical saturation ratio for homogeneous nucleation, S cr; dimensionless corresponding states parameter, Ω/T; log vapor saturation ratio in unstable equilibrium with the minimum detectable particle size, h; molecular number concentration of vapor in equilibrium with bulk liquid, n eq v ; and the volume per molecule of bulk liquid working fluid, v 1. Note comparative constancies of homogeneous nucleation barrier height and f min=n min seed/g*. Data sources: l-menthol, Becker and Reiss (Citation1978); n-nonane, Rudek et al. (Citation1996); n-butanol, Magnusson et al. (Citation2003); water: Wölk and Strey (Citation2001)
4.3. Nucleation Theorems
Nucleation theorems give the relative sensitivity of nucleation rate to saturation ratio, temperature, or other constraints (Kashchiev Citation1982; McGraw and Wu Citation2003; Vehkamäki et al. Citation2007). The following relations in terms of the log saturation ratio follow immediately from the area construction () on application of the fundamental theorem of integral calculus to the areas R 1 and R 1+R 2:
5. FUNDAMENTAL LIMITS TO NEUTRAL PARTICLE DETECTION
5.1. Maximizing Detector Sensitivity
Avoiding interference from homogeneous nucleation requires that the homogeneous nucleation rate be less than or comparable to the activation rate: J homo/J hetero⩽1 or, from EquationEquation (13), J homo/J 1⩽N(cm−3). Under typical CPC measuring conditions, N is in the 10–1000 cm−3range. Nucleation thresholds are typically sharp, as illustrated for menthol and water in and , respectively, for N=1 cm−3. The figures show threshold bands, where the rates J homo and J hetero take on middle and extreme values of 1, 10−2, and 102, and characteristically small intersection regions, where the ratio J homo/J hetero ranges from 10−4 to 104. Operating a CPC just below the homogeneous nucleation threshold, J homo=1 cm−3s−1, which defines the critical saturation ratio S cr, avoids interference from homogeneous nucleation, while maximizing sensitivity for smallest particle detection. The smallest particles will be detected under conditions that are simultaneously close to the homogeneous and heterogeneous nucleation thresholds, while preserving the above inequalities. These conditions are used next to establish fundamental size and concentration limits to neutral particle detection.
5.2. Signal-to-Noise Ratio Perspective
Taking nucleation rates from Equations (19) and (21), the preceding criterion becomes
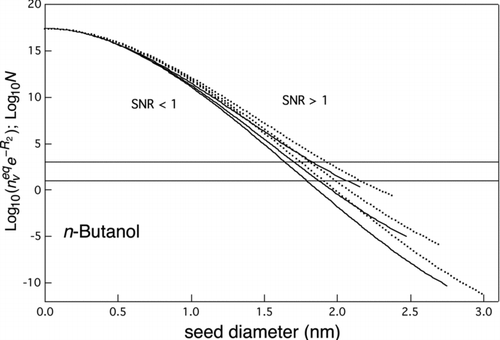
FIG 6 Curves of equal heterogeneous and homogeneous nucleation rates (SNR=1) for n-butanol. Logarithm of ![]()
5.3. Scaling and Minimum Detection Size
Because the working fluid enters primarily through its equilibrium vapor pressure and nondimensional homogeneous nucleation parameters, corresponding states scaling ideas previously developed to correlate the homogeneous nucleation thresholds of supersaturated vapors (McGraw Citation1981; Rasmussen and Babu Citation1984; Hale Citation1992) can be used here. The power of scaling is illustrated through its application to a selection of four widely different working fluids for which homogeneous nucleation measurements are available (; ). Homogeneous nucleation barrier heights for many substances tend to be in the 50−70 kT range bounded by the dashed hyperbolic curves (McGraw Citation1981), as illustrated for these four fluids in . Each of the fluid-characteristic points shown in the figure lies at the intersection of several important curves. To avoid crowding the figure, these are drawn only for nonane to illustrate the method. They include the curve of constant homogeneous nucleation barrier height (EquationEquation (5a), which if drawn would pass through the nonane point and lie within the hyperbolic dashed curves), the Kelvin curve (which depends on the scaling parameter Ω/T), and the horizontal and vertical lines marking ln S cr and g*, respectively. The parameters needed to construct similar sets of curves for each of the other working fluids are provided in the table.
FIG 7 Scaled nucleation rate. Dashed hyperbolic curves: contours of constant homogeneous nucleation barrier height, 50 kT (lower curve) and 70 kT (upper curve). The region between these curves provides a good indication of homogeneous nucleation threshold range for most substances. Markers show four candidate working fluids and are centered on the critical cluster size and critical saturation ratio (as indicated here for the case of nonane), which for each fluid gives J homo=1 cm−3s−1. Error bars show a four order of magnitude range in nucleation rate from J homo=0.01 cm−3s−1 to J homo=100 cm−3s−1. No error bar means that the height of the symbol itself exceeds this range. The solid curve is the Kelvin curve for nonane (Ω/T=2.40 at T=300 K). The horizontal and vertical dotted lines for nonane mark the logarithm of its critical saturation ratio ln(S cr) and g*, respectively. The area of the rectangle bounded by these lines and the axes is twice the reduced barrier height, W * homo/kT. The caret marks the N=1 cm−3 detection limit for nonane.
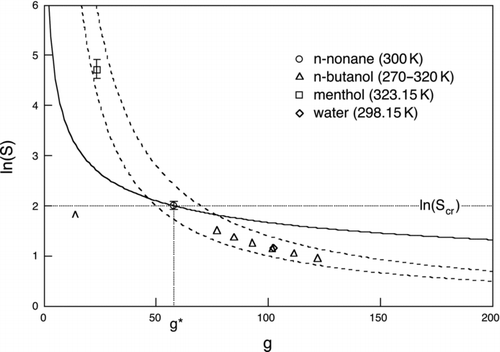
The maximum sensitivity condition for each working fluid lies close to the critical saturation ratio, indicated in for nonane by the horizontal dotted line. The threshold values in the first row of were obtained from EquationEquation (21) by adjusting S ext to have J homo=1. Thus, the minimum detectable size lies close to the ln(S cr) line, between 0 and g*, and close to the heterogeneous nucleation threshold. Its precise location is obtained by solving EquationEquation (26) (here with seed concentration N=1 cm−3) for the equality condition J homo/J hetero=1. The result, with n min seed≡f min g*, is marked by the caret in for nonane and provided for the other fluids in row 9 of . Near constancy of f min (row 7) for the different working fluids suggests its value as an important heterogeneous nucleation scaling parameter. Using molecular volumes, obtained from the bulk liquid density (row 10), to convert n min seed to a spherical mass-equivalent volume gives the minimum detectable seed particle diameters shown in the last row of the table. The entries for menthol and water match particle diameters at the intersection of the threshold rates, J homo=J hetero=1, shown in and , respectively. The smallest diameter, at 1.14 nm, is found for water even though its scaling parameters are very close to those of n-butanol at 300 K, which has the second highest minimum detection diameter, 1.96 nm. The n min seed values are close for water and n-butanol, so the difference lies predominately in the smaller molecular volume for water. Comparing water and menthol, we observe that the latter has the highest Ω/T (row 3), which gives it the smallest g* (row 4). Here again, water wins out for having the smaller detection diameter due to its factor-of-eight smaller molecular volume.
The scaling parameter Ω/T contains T implicitly in Ω and explicitly in 1/T. A useful approximate form for the temperature dependence of Ω/T has been obtained by Hale (Citation1992) for surface tensions approximated by a linear form, σ=σ0(T c−T), where T c is the critical temperature. Neglecting a small temperature dependence in density gives Ω/T≈ΩH(T c/T−1), with ΩH≡σ0 v 2/3 1/k. Temperature dependence is exhibited in for the case of n-butanol at 10° intervals, from 270 to 320 K, by the triangles positioned from left to right, respectively.
5.4. Nucleation and Growth as a Detection Tool
The preceding discussion examined the case that N≈1 cm−3 and applies to the detection of seed particles (or large molecular impurities) of volume n min seed v 1 present in the vapor at concentrations of order 1 cm−3. The question naturally arises as to whether or not it is possible to detect still smaller particles and even single neutral molecules this way. According to EquationEquation (26) and , the detection of molecule “impurities” comparable in size to the molecular volume of the working fluid requires their presence at the much higher concentration N≈n eq v . Intermediate sizes require intermediate seed concentrations n (). The efficiency of particle detection, equal to activation probability within the CPC, is defined as:
Evidence for the detection of critical nuclei containing just one organic molecule comes from laboratory measurements on the ternary p-toluic acid/sulfuric acid/water (Zhang et al. Citation2004) and cis-pinonic acid/sulfuric acid/water (Zhang et al. Citation2009) systems and their interpretation using the nucleation theorem (McGraw and Zhang Citation2008). In both cases, the concentration of the organic acid present in the vapor was of the order 1010cm−3—far in excess of unity, and comparable to the sulfuric acid vapor concentration. For a nucleation rate of 103cm−3s−1, this implies detection efficiency for the organic acid in the 10−8 range. Noise arises due to binary homogeneous nucleation in the background sulfuric acid/water vapor mixture. Analysis of ternary-to-binary nucleation rate ratios in the p-toluic acid/sulfuric acid/water system ( of McGraw and Zhang Citation2008) gives SNRs for detection of p-toluic acid in the 5–10 range.
In their investigations of nucleation and growth as a detection tool, Reiss et al. (Citation1977) concluded: “It is unlikely, however, that single neutral molecules can be detected [referring to detection using a diffusion cloud chamber], although the possibility remains for detecting individual polymer molecules of a substantial degree of polymerization” (p. 140). Elsewhere in their article, on page 29, the authors state: “Even though theory shows that one cannot detect a single impurity molecule, it shows that there may be cases in which a nucleus contains only a single [such] molecule. But this is not the same as having every impurity molecule serve as a nucleus.” Their findings are consistent with the results obtained here. The following section presents a preliminary analysis showing that the graphical method can be used to incorporate departures from the Kelvin relation due to interactions at the molecular scale.
6. INCORPORATING DEPARTURE FROM THE KELVIN RELATION
An important tool for direct testing of the Kelvin relation for small droplets became available with the ability to measure nucleation rates (as opposed to earlier measurements that yielded only nucleation threshold conditions). Strey et al. (Citation1994) performed such a test using homogeneous nucleation rate measurements in conjunction with the nucleation theorem to give a determination of the critical cluster size for n-butanol. The Kelvin relation sufficed to predict cluster sizes down to as few as 40 molecules, an equivalent radius of curvature of 1 nm. Similar studies for water showed agreement down to about 30 molecules or about 0.6-nm radius of curvature (Wölk and Strey Citation2001). One concludes from these studies that even though the Kelvin relation relies on macroscopic surface tension and density to predict the vapor pressures of small drops, it tends to work surprisingly well.
FIG 8 Area construction similar to but illustrating the effect of interactions that lower the equilibrium vapor pressure relative to the Kelvin curve (solid curve). The dotted curve, which only departs from Kelvin at the smallest cluster sizes, results in a lowering of the barrier height for homogeneous nucleation to R 1+R 2−κ. The dashed curve shows lowering of the heterogeneous barrier from R 1 to R 1−δ. Here, h is the length of the vertical line segment (Equation (S18)). Note that the abscissa (upper scale) has been shifted in the heterogeneous case to tally only the number of molecules of condensed working fluid. The lower scale, which runs out to g*, applies to the homogeneous case.
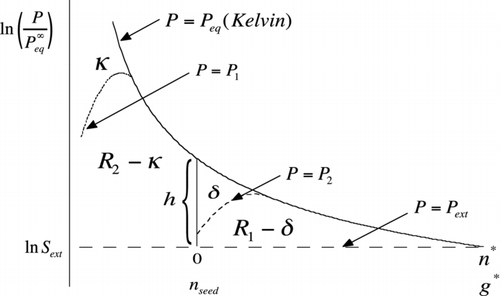
A seemingly common case in homogeneous nucleation occurs when the Kelvin relation works well for clusters of critical size but fails for smaller ones. This situation is depicted schematically in by the dotted vapor pressure curve [P=P 1(g)] for the case of attractive interactions that lower the vapor pressures of very small clusters relative to the Kelvin curve. The integrated area between P 1(g) and the dashed line at ln S ext equals the corrected reduced barrier height for homogeneous nucleation, which in this case is lower by κ from the prediction of the classical nucleation theory (CNT) based on the Kelvin curve:
6.1. Substrate–Working Fluid Interactions
Molecular-scale interactions between a particle surface and the working fluid can also result in departure from the Kelvin relation. Such interactions are not easily incorporated into macroscopic properties such as the contact angles and line tensions used by the classical nucleation theory. Evidence for strong surface effects that seem to defy a classical description is seen in recent measurements comparing nanometer-sized particles of Ag and NaCl. These substances show very different activation efficiencies and, in the case of NaCl, unusual temperature dependence (Schobesberger et al. Citation2010). While not complete without a detailed picture of the interactions in question, the graphical method provides a molecular framework for generalization of the classical nucleation theory based on deviations in vapor pressure (positive or negative) relative to the Kelvin curve. illustrates the case that departures from the classical homogeneous nucleation theory are due to interactions that take place within clusters of the pure working fluid that are smaller than the seed so that P 1(g)≈P eq(g) for g⩾n seed, but interactions between the seed and the working fluid can still cause departure from the classical heterogeneous nucleation theory for perfect wetting. The effect on vapor pressure is depicted by the dashed curve [P=P 2(g)] in for the case of attractive interactions, resulting in a vapor pressure lowering near the seed surface. Reduction in h, as suggested in the figure, might possibly be inferred through measurements of the relative sensitivity of heterogeneous nucleation rate to seed size using the nucleation theorem of EquationEquation (25). Note, however, that whenever the vapor pressure at n seed falls below P ext, h becomes negative. Familiar examples occur in the Thompson theory, for charged particles, and in the Kohler theory for soluble nuclei. In such cases, EquationEquation (25) predicts a relative sensitivity of zero as the particle undergoes spontaneous growth until achieving stable equilibrium at P ext. Considering only positive h, the integrated effect of vapor-pressure-lowering interactions is to cause a shift in the heterogeneous nucleation barrier height: W * hetero−W * hetero(CNT)=−δkT, where CNT, within parentheses, refers not only to the classical nucleation theory but also to perfect wetting. δ is the area indicated in :
The results in this section show qualitatively and quantitatively how molecular interactions that lower (elevate) vapor pressure cause enhancement (reduction) of the nucleation rate. For the ternary organic acid/sulfuric acid/water systems discussed in Section 5, recent quantum chemical calculations point to strong organic acid–sulfuric acid hydrogen bonding as responsible for the stabilization of the critical complex and enhancement of the nucleation rate seen in laboratory measurements (Zhao et al. Citation2009).
7. SUMMARY AND DISCUSSION
In this article, we presented theory and a graphical method for the analysis of homogeneous and heterogeneous nucleation barriers. The results reproduce the classical nucleation theory for the case that the droplet vapor pressure follows the Kelvin relation, while allowing interactions at the molecular scale that cause deviations in vapor pressure from the Kelvin result, and from the classical nucleation theory, to be formally included. Several nucleation theorems were shown to follow immediately from the graphical method, as does the Zeldovich factor, here related to the slope of the Kelvin curve at the critical nucleus size, that appears in expressions for homogeneous and heterogeneous nucleation rate.
Calculations based on MFPT kinetics were carried out and used as the benchmark to develop and test a new simplified expression for the MFPT and heterogeneous nucleation rate. Including (or not including in the case of heterogeneous nucleation) Courtney's 1/S correction and allowing for particle–vapor association at precritical levels of condensate yielded accuracies to within a few percentage points when compared with the MFPT results.
Criteria for guiding the selection of working fluids and operating conditions in order to optimize neutral particle detection were derived from a consideration of detection efficiency and a new metric for assessing heterogeneous nucleation—the signal-to-noise ratio. Corresponding states correlations, previously developed in the context of the homogeneous nucleation theory, were shown to be applicable to heterogeneous nucleation and used to identify key scaling parameters and obtain results in a universal (material-independent) form. Detectability at minimal-seed-to-molecular-volume ratio, v seed/v 1=n min seed, was shown to be favored for larger values of Ω/T, lower vapor concentration, n eq v , and molecular-level particle–working fluid interactions that lower vapor pressure relative to the Kelvin curve. In the latter case, to the extent such interactions (e.g., hydrogen bonding or antigen–antibody interactions) are favored and characteristically paired, highly selective methods for nanoparticle detection based on nucleation and growth should result. Future research should include extending the graphical method (or equivalent) to multi-component working fluids, more complete development of molecular-based approaches to the nucleation theory, and theory and experiment aimed at elucidating temperature dependence.
uast_a_687844_sup_25795420.zip
Download Zip (1.1 MB)Acknowledgments
This research was supported by the Atmospheric System Research (ASR) Program of the US Department of Energy. Special thanks to Ernie Lewis for valuable discussions and to an anonymous reviewer for a careful and thoughtful review, which greatly helped our presentation of this work.
[Supplementary materials are available for this article. Go to the publisher's online edition of Aerosol Science and Technology to view the free supplementary files.]
Related Research Data
REFERENCES
- Abraham , F. F. 1974 . Homogeneous Nucleation Theory , New York : Academic . Chapter 5
- Becker, , C. and Reiss , H. 1978 . Estimation of Thermophysical Properties of a Large Polar Molecule and Application to Homogeneous Nucleation of l-Menthol . J. Chem. Phys. , 68 : 3585 – 3594 .
- Courtney , W. G. 1961 . Remarks on Homogeneous Nucleation . J. Chem. Phys. , 35 : 2249 – 2250 .
- Fernandez de la Mora , J. 2011 . Heterogeneous Nucleation with Finite Activation Energy and Perfect Wetting: Capillary Theory versus Experiments with Nanometer Particles, and Extrapolations on the Smallest Detectable Nucleus . Aerosol Sci. Technol., , 45 : 543 – 554 .
- Fletcher , N. H. 1958 . Size Effect in Heterogeneous Nucleation . J. Chem. Phys. , 29 : 572 – 576 .
- Hale , B. N. 1992 . The Scaling of Nucleation Rates . Metallurgical Trans. , 23A : 1863 – 1868 .
- Hänggi , P. , Talkner , P. and Borkovec , M. 1990 . Reaction Rate Theory: Fifty Years after Kramers . Rev. Mod. Phys. , 62 : 251 – 341 .
- Iida , K. , Stolzenburg , M. R. and McMurry , P. H. 2009 . Effect of Working Fluid on Sub-2nm Particle Detection with a Laminar Flow Ultrafine Condensation Particle Counter . Aerosol Sci. Technol. , 43 : 81 – 96 .
- Jiang , J. , Zhao , J. , Chen , M. , Eisele , F. L. , Scheckman , J. Williams , B. J. 2011 . First Measurements of Neutral Atmospheric Cluster and 1–2 nm Particle Number Size Distributions during Nucleation Events . Aerosol Sci. Technol. , 45 ii–v
- Kashchiev , D. 1982 . On the Relation between Nucleation Work, Nucleus Size, and Nucleation Rate . J. Chem. Phys. , 78 : 5098 – 5102 .
- Katz , J. L. , Saltsburg , H. and Reiss , H. 1966 . Nucleation in Associated Vapors . J. Coll. Interface Sci. , 21 : 560 – 568 .
- Magnusson , L.-E. , Koropchak , J. A. , Anisimov , M. P. , Poznjakovskiy , V. M. and Fernandez de la Mora , J. 2003 . Correlations for Vapor Nucleating Critical Embryo Parameters . J. Phys. Chem. Ref. Data , 32 : 1387 – 1410 .
- McGraw , R. 1981 . A Corresponding States Correlation of the Homogeneous Nucleation Thresholds of Supercooled Vapors . J. Chem. Phys. , 75 : 5514 – 5521 .
- McGraw , R. 2001 . Dynamics of Barrier Crossing in Classical Nucleation Theory . J. Phys. Chem. B , 105 : 11838 – 11848 .
- McGraw , R. and Laaksonen , A. 1996 . Scaling Properties of the Critical Nucleus in Classical and Molecular-Based Theories of Vapor-Liquid Nucleation . Phys. Rev. Letts. , 76 : 2754 – 2757 .
- McGraw , R. and Lewis , E. R. 2009 . Deliquescence and Efflorescence of Small Particles . J. Chem. Phys. , 131 : 194705 – 194719 .
- McGraw , R. and Wu , D. T. 2003 . Kinetic Extensions of the Nucleation Theorem . J. Chem. Phys. , 118 : 9337 – 9347 .
- McGraw , R. and Zhang , R. 2008 . Multivariate Analysis of Homogeneous Nucleation Rate Measurements. Nucleation in the p-Toluic Acid/Sulfuric Acid/Water System . J. Chem. Phys. , 128 ( 6 ) : 064508 – 064517 .
- Rasmussen , D. H. and Babu , S. V. 1984 . A Corresponding States Correlation for Nucleation from the Vapor . Chem. Phys. Letts. , 108 : 449 – 451 .
- Reiss , H. , Marvin , D. C. and Heist , R. H. 1977 . The Use of Nucleation and Growth as a Tool in Chemical Physics . J. Coll. Interface Sci. , 38 : 125 – 141 .
- Rudek , M. M. , Fisk , J. A. , Chakarov , V. M. and Katz , J. L. 1996 . Condensation of a Supersaturated Vapor. XII. The Homogeneous Nucleation of the n-Alkanes . J. Chem. Phys. , 105 : 4707 – 4713 .
- Schobesberger , S. , Winkler , P. M. , Pinterich , T. , Vrtala , A. , Kulmala , M. and Wagner , P. E. 2010 . Experiments on the Temperature Dependence of Heterogeneous Nucleation on Nanometer-Sized HaCl and Ag Particles . Chem. Phys. Chem. , 11 : 3874 – 3882 .
- Sipilä , M. , Lehtipaloa , K. , Attouib , M. , Neitolaa , K. , Petäjäae , T. , Aaltoa , P. P. O'Dowd , C. D. 2009 . Laboratory Verification of PH-CPC's Ability to Monitor Atmospheric Sub-3 nm Clusters . Aerosol Sci. Technol. , 43 : 126 – 135 .
- Strey , R. , Wagner , P. E. and Viisanen , Y. 1994 . The Problem of Measuring Homogeneous Nucleation Rates and the Molecular Contents of Nuclei: Progress in the Form of Nucleation Pulse Measurements . J. Chem. Phys. , 98 : 7748 – 7758 .
- Vanhanen , J. , Mikkilä , J. , Lehtipalo , K. , Sipilä , M. , Manninen , H. E. Siivola , E. 2011 . Particle Size Magnifier for Nano-CN Detection . Aerosol Sci. Technol. , 45 : 533 – 542 .
- Vehkamäki , H. , Määttänen , A. , Lauri , A. , Napari , I. and Kulmala , M. 2007 . Technical Note: The Heterogeneous Zeldovich Factor . Atmos. Chem. Phys. , 7 : 309 – 313 .
- Vehkamäki , H. , Määttänen , A. , Lauri , A. , Napari , I. , Kulmala , M. Winkler , P. 2007 . Heterogeneous Multicomponent Nucleation Theorems for the Analysis of Nanoclusters . J. Chem. Phys. , 126 : 174707 – 174719 .
- Wedekind , J. , Strey , R. and Reguera , D. 2007 . New Method to Analyze Simulations of Activated Processes . J. Chem. Phys. , 126 : 134103 – 134115 .
- Winkler , P. M. , Steiner , G. , Vrtala , A. , Vehkamäki , H. , Noppel , M. Lehtinen , K. E. J. 2008 . Heterogeneous Nucleation Experiments Bridging the Scale from Molecular Ion Clusters to Nanoparticles . Science , 319 : 1374 – 1377 .
- Wölk , J. and Strey , R. 2001 . Homogeneous Nucleation of H2O and D2O in Comparison: The Isotope Effect . J. Phys. Chem. B , 105 : 11683 – 11701 .
- Zhang , R. , Suh , I. , Zhao , J. , Zhang , D. , Fortner , E. C. Tie , X. 2004 . Atmospheric New Particle Formation Enhanced by Organic Acids . Science , 304 : 1487 – 1490 .
- Zhang , R. , Wang , L. , Khalizov , A. F. , Zhao , J. , Zheng , J. McGraw , R. 2009 . Formation of Nanoparticles of Blue Haze Enhanced by anthropogenic Pollution . Proc. Natl. Acad. Sci. , 106 : 17650 – 17654 .
- Zhao , J. , Khalizov , A. , Zhang , R. and McGraw , R. 2009 . Hydrogen-Boding Interaction in Molecular Complexes and Clusters of Aerosol Nucleation Precursors . J. Phys. Chem. A , 113 : 680 – 689 .