Abstract
We carried out a set of experiments to compare three particle number concentration standards (NCSs) by calibrating the same condensation particle counter (CPC) unit (Model 3772, TSI Inc., Shoreview, MN, USA). The standards were, in the order of operation size range, the primary NCS of the National Institute of Advanced Industrial Science and Technology (AIST, Japan), the Single Charged Aerosol Reference (SCAR) (Finland), and the Inkjet Aerosol Generator (IAG) of AIST. The results obtained with the 3 standards were found to agree at all overlapping particle sizes within the uncertainty limits. The relative expanded uncertainties varied between 0.6% and 2.6%, depending on the size and standard, while the overall agreement between the standards was within 0.5%. The observed consistency of the results is an important step toward establishing internationally coherent particle NCSs. As a result, the CPC 3772 was successfully calibrated in a particularly wide size range, approximately from 10 nm to 10 μm. The results indicate that the CPC can be considered as a practical tool for calibrating particle number concentration up to 1 μm. In general, the particle number concentration can be measured up to 2.5 μm without a significant decrease of the detection efficiency. By attaching an appropriate size-classifying inlet, the CPC could be used even for measuring the total number concentration for particles smaller than 2.5 μm, in parallel with the PM2.5 mass measurement. Above this particle diameter, the detection efficiency gradually decreased and reached 50% at about 10 μm.
Copyright 2012 American Association for Aerosol Research
1. INTRODUCTION
Aerosol particles play an important role in many scientific and technology issues, such as global climate change (IPCC Citation2007), health effects of particulate emissions (CAFE Citation2001), and nanotechnology (NSF Citation2003). Aerosol particle measurement is widely applied, for example, in clean room technology and in studying the particulate emissions from traffic and industry. The phenomena under interest are found to be related to properties other than simple mass concentration. Therefore, other properties such as particle size, size distribution, and number concentration are measured. Several instruments, for example, optical and laser particle counters (OPC/LPC; Knollenberg and Luehr Citation1976), condensation particle counter (CPC; Agarwal and Sem Citation1980), scanning mobility particle sizer (SMPS; Wang and Flagan Citation1990), and electrical low pressure impactor (ELPI; Keskinen et al. Citation1992), can be used to measure these properties. With these instruments, particle size can be measured rather accurately, since the size response can be traceably calibrated against particle size reference materials, such as polystyrene latex (PSL) particles. The accuracy of the number concentration measurement is more ambiguous, because no internationally coherent number concentration standard (NCS) exists for calibration purposes. Number-based limits are applied, for instance in clean rooms of production facilities, and since September 2011 also in the regulations on the vehicle Particulate Matter emission (ISO Citation14644-1 1999; European Commission Citation2008).
In order to cover the particle size range of several orders of magnitude, NCSs with different operation principles are needed. According to Ehara and Sakurai (Citation2010), 3 conceivable types of NCSs for airborne particles can be identified: the generator, the reference material, and the measurement instrument. In the generator approach, the particle number concentration output can be derived from the operation parameters. Examples of the generator-type standard are the Combustion Aerosol Standard (CAST; Barthazy et al. Citation2007), and the Inkjet Aerosol Generator (IAG; Iida et al. Citation2010). In Iida's work, an OPC was successfully calibrated with the IAG from 200 nm up to 10 μm. The IAG offers an alternative for the impractical reference mass measurement, and is more than suitable for field test due to portable nature of the instrument. The IAG of National Institute of Advanced Industrial Science and Technology (AIST) can be made traceable to SI-units by calibrating the frequency of inkjet pulses and flow rate at the exit of the IAG. In addition, the relation between the actual particle output rate through the exit of the IAG and the frequency of inkjet pulses has been evaluated carefully, which makes the IAG an accurate calibration standard. In the reference material type of standard, a constant and known number concentration is conserved in a vessel. This is difficult over time owing to particle losses.
At the moment, the most widely applied type of NCS is the measurement instrument approach. In this approach, an instrument with well-characterized detection efficiency, usually a Faraday cup aerosol electrometer (FCAE), in combination with singly charged monodisperse particles that are extracted from a polydisperse distribution with a differential mobility analyzer (DMA; Liu et al. Citation1975), is used as a number concentration reference. This approach is commonly used in measuring the counting efficiency curves of various CPCs especially near the cut-off size and it is used as a primary NCS between 10 nm and 200 nm at AIST, Japan, and also in some other National Metrology Institutes (NMIs) (Fletcher et al. Citation2009; Schlatter Citation2009; Sakurai and Ehara Citation2011). This method suffers from the effect of the multiple-charged particles, which can be partly taken into account by applying corrections such as presented by Hoppel (Citation1978) and Kauppinen and Hillamo (Citation1989). Because of this effect, NCSs using this method are usually limited to particle sizes smaller than 100 nm. At AIST, the fraction of multiple-charged particles is controlled to be negligibly small, which is realized by having aerosols of a narrow size distribution before the DMA classification. In the only validated NCS of Finland, called the Single Charged Aerosol Reference (SCAR), the FCAE is also used as a number concentration reference, but a different approach is used for generating singly charged particles from 10 to 500 nm (Yli-Ojanperä et al. Citation2010; Högström et al. Citation2011). With this method, no correction for multiple-charged particles is needed.
To establish an internationally coherent NCS, standards using different approaches and originating from different countries need to be compared on a regular basis, and the results need to be consistent within the uncertainty limits. A typical way to perform a comparison between national standards is to circulate the same calibrator (e.g., CPC or OPC) in the participating NMIs and compare the results (i.e., a round-robin comparison). For most of the national standards, this is the only possible alternative owing to the immobile nature of the devices.
In February 2011, the SCAR was transported to AIST, Japan, and a comparison between SCAR and the primary NCS of AIST was carried out. The comparison was made by calibrating the same individual CPC 3772 (TSI Inc., Shoreview, MN, USA), which is a secondary reference CPC of AIST and is only used for calibration purposes. All of the measurements were made using the very same facility, within 1 month. This approach, compared to the round-robin method, guaranteed the best achievable circumstances for detecting true differences between the standards, by ruling out the possibility that the response of the same individual CPC unit had changed between the measurements due to transportation or a difference in the environmental condition. A comparison, where the whole standard is taken to another country, is very exceptional from the metrological point of view. Later on, the IAG of AIST was also used for calibrating the same CPC. Altogether, the calibration results covered the particle size range from about 10 nm up to 10 μm. All 3 calibration setups and the comparison of the CPC calibration results with the 3 overlapping standards are presented in this article together with an uncertainty analysis, with which the equivalence of the standards is discussed.
2. EXPERIMENTAL
2.1. Overview of the Measurements at AIST
During the experiments, the detection efficiency of the same CPC 3772 (TSI Inc., Shoreview, MN, USA) unit as a function of particle size was measured using 3 NCSs. The CPC 3772 is a laminar continuous flow type and alcohol-based CPC. The nominal flow rate is 1 L min−1 and no sheath flow is used. It operates only on a single particle counting mode and measures concentrations up to 104 particles cm−3. While it can operate with its internal coincidence correction on or off, the correction was always turned on during the measurements in this study. According to manufacturer's specifications, the nominal cut-off size for the CPC is 10 nm. Before the experiments with the SCAR, the detection efficiency of the CPC was studied thoroughly with the AIST primary NCS. These studies included the effect of the calibration aerosol material and also the concentration dependence of the detection efficiency. The measured particle sizes were 10 nm for sucrose, 12, 16, 25, 37, and 66 nm for di-octyl sebacate (DOS), 12, 15, 18, and 25 nm for NaCl, and 50, 100, 200, and 300 nm for PSL. Most of these measurements were made at 3 different concentrations: 3200, 5600, and 10,000 particles cm−3.
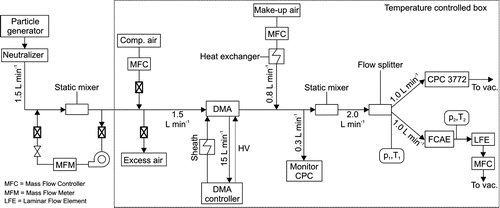
FIG. 1 Measurement setup used with the AIST primary NCS in CPC calibration.
As already stated in Section 1, the AIST primary NCS and the SCAR use an FCAE as a particle number concentration reference. At AIST, the monodisperse particle size is derived from the operation parameters of the DMA, which is regularly calibrated against PSL size reference materials, whereas in the SCAR the mode size of a separate SMPS particle size distribution measurement is used as the particle size of a calibration. In order to minimize the effects of limited accuracy of the particle size measurement of the SCAR and the material dependency of the CPC to the results, the main focus in the measurements with the SCAR was in particle sizes larger than 30 nm where the size and material dependence of the detection efficiency is small for the CPC 3772. The measured particle sizes were 12 nm for NaCl and 31, 40, 59, 85, 140, 215, 350, 530, 615, 700, 800, 900, and 1000 nm for DOS. For best obtainable signal-to-noise ratio for the FCAE, concentrations between 7000 and 9000 particles cm−3 were used. With the IAG the measured particle sizes were 210, 430, and 670 nm and 1.0, 1.7, 2.6, 4.2, 6.6, and 11 μm. The number concentration of 6 particles cm−3 was used for all particle sizes. The material of particles generated with the IAG was NaCl at 430 nm and above, and non-volatile residue of ultrapure water at 210 nm.
2.2. Measurements with AIST Primary NCS
shows the measurement setup used in calibration measurements with the AIST primary NCS (Wang et al. Citation2010).
With this setup, particles (sucrose, DOS, NaCl, and PSL) were generated with a TSI 3480 Electrospray Aerosol Generator (EAG) equipped with an Am-241 neutralizer (not shown in the figure), followed by another Am-241 neutralizer. The output particle size distribution was measured before the calibration measurement with an SMPS consisting of a DMA connected to a TSI 3080 controller and a TSI 3025 CPC (“Monitor CPC” in the figure). The DMA was a TSI 3081 for sizes above 30 nm, while it was a TSI 3085 in the size range from 10 nm to 30 nm. The particle number concentration can be adjusted either by changing the amount of recirculation flow close to the EAG or by changing the amount of compressed air entering to the system before the DMA, which also changes the excess flow rate. In each calibration measurement, the DMA was used to extract monodisperse particles and the particle number concentration was adjusted based on the reading of the monitor CPC. After the DMA, make-up air was added to compensate the difference between the total flow rate of the FCAE and CPCs and the aerosol flow rate of the DMA. A static mixer guaranteed the homogeneity of the particle flow before the flow splitter. The CPC 3772 and the AIST home-built Faraday cup (FCAE in ) sampled the aerosol simultaneously downstream the flow splitter at a nominal volumetric flow rate of the CPC (1 L min−1). The volumetric flow rate of the FCAE was controlled with a mass flow controller (Model MC-4000 by Lintec) and measured with a Laminar Flow Element (Model DF-240BA by Cosmo Instruments) combined with a temperature and pressure transmitter (Model PTU220 by Vaisala). The electric current from the FCAE was measured using a Keithley 6430 sub-femtoamp remote sourcemeter. Most of the measurement system, including the CPC 3772 and the FCAE, was placed in a temperature-controlled box. Among other things, this minimizes the zero drift of the electrometer related to temperature changes.
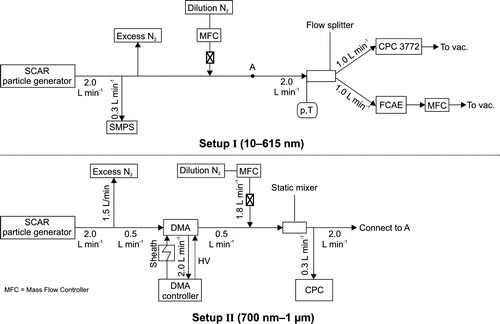
FIG. 2 Measurement setups used with the SCAR in CPC calibration.
A measurement routine that has been used in AIST in CPC calibration was used to acquire CPC and FCAE readings for both AIST primary NCS and SCAR. A more thorough description can be found in Sakurai and Ehara (Citation2011). While the CPC and FCAE recorded concentration and current, the DMA voltage was toggled on/off every 60 s. Consequently, the particle concentration input for the CPC and the FCAE varied between zero (DMA voltage off) and the actual calibration number concentration (DMA voltage on) every 60 s. This was repeated for 10 cycles resulting in a total measurement time of 21 min: 11 off periods and 10 on periods. Because it takes some time for the instruments to stabilize after the DMA voltage was toggled, only one value for each of the 60 s periods was obtained as an average of the data from the last 30 s. The actual particle concentration was then calculated by subtracting the average value of the two neighboring off periods from the on period concentration. After completing the preceding measurement routine, the places of the FCAE and the CPC were switched and the routine was repeated, which completed the measurements for a single particle size. This was made in order to evaluate and correct for the effect of concentration bias between different output ports of the flow splitter. The number concentration is calculated as:
Before the measurements with the SCAR in Section 2.3, the setup in was used to check the agreement between the FCAE of AIST primary NCS and that of SCAR at number concentrations equal or higher than 10,000 particles cm−3. The FCAEs were found to agree within 1%.
2.3. Measurements with SCAR
shows the measurement setups used in calibration measurements with the SCAR.
The operation of the SCAR was introduced by Yli-Ojanperä et al. (Citation2010). In the SCAR, the following units are used in the numbered order to establish a traceable number concentration: (1) generation of the primary nanoaerosol with a tube furnace from NaCl (geometric mean diameter of 10–12 nm). (2) Bipolar charging of the primary nanoaerosol with a radioactive neutralizer (Am-241 in this study). (3) Classification of the primary nanoaerosol. In this unit, monodisperse, singly charged particles of sizes between 10 nm and 12 nm are selected from the primary nanoaerosol with a DMA. These particles act as condensation nuclei in the fourth unit. (4) Condensational growth of the size-classified primary nanoaerosol with DOS without changing the charge of the particles. The units from one to four form the particle generator of the SCAR () producing singly charged particles. (5) Traceable determination of the output particle number concentration with FCAE. In addition to DOS particles, monodisperse NaCl output aerosol can also be obtained from the SCAR by bypassing the growth unit.
In , setup I shows the normal configuration of the SCAR. Measurements at particle sizes from 12 nm up to 615 nm were performed with this setup. During the CPC 3772 and FCAE measurement, the output particle size distribution just downstream of the particle generator was measured simultaneously with an SMPS consisting of a TSI 3081 DMA connected to a TSI 3080 controller and a TSI 3775 CPC. The output flow rate of the particle generator was kept constant at 2 L min−1. The particle number concentration was controlled by changing the flow rate of the dilution nitrogen, and thereby changing the fraction of the 2 L min−1 aerosol flow escaping to the excess port. The CPC 3772 and a home-built FCAE (FCAE in ) sampled the aerosol simultaneously downstream the flow splitter at the nominal volumetric flow rate of the CPC (1 L min−1). The volumetric flow rate of the FCAE was controlled with a mass flow controller (Model F-201CV-10K-RAD-33-V EL-FLOW by Bronkhorst). In order to convert the mass flow rate to volumetric flow rate at the inlet of the FCAE, both pressure (Model PTB 330, Vaisala) and temperature (Model H2081 NPT thermistor probe with stainless steel sheath, US Sensors) were measured before the flow splitter. The electric current from the FCAE was measured using a Keithley 6430 sub-femtoamp remote sourcemeter.
Prior to the measurements at AIST, the operation of the SCAR was verified only up to about 600 nm. At particle sizes larger than 600 nm, homogeneous nucleation of DOS was suspected to have a noticeable influence on the average charge of the output particles. To ensure singly charged, monodisperse particles for the calibration at particle sizes from 700 nm up to 1 μm, a DMA operated at 0.5/2.0 polydisperse/sheath flow rates was connected to the output of the SCAR (setup II in ). In this setup, the particle size distribution was measured before and after the detection efficiency measurement using the same DMA and CPC shown in setup II as an SMPS.
With both setups, the measurement routine described in Section 2.2 was used to acquire CPC and FCAE readings. With the setup I in , the particle concentration input for the CPC and the FCAE was altered between zero and the actual calibration concentration by toggling the flow rate of the dilution nitrogen between 2 values. A setting of the dilution flow rate higher than 2 L min−1 was used to assure zero concentration for the devices, and a smaller flow-rate setting was used to feed particles at a desired calibration concentration. With the setup II, the DMA voltage was toggled on/off in order to control the concentration input.
2.4. Measurements with IAG
An IAG was used to generate monodisperse aerosol particles of a mobility-equivalent size, ranging from 0.21 to 10 μm, at a known generation rate. AIST's IAG is not equipped with a flow rate source. Since its flow rate is determined by the flow rate of the instrument (e.g., a CPC) that is to be calibrated with the IAG, AIST's IAG is not a number concentration source by itself. Calibration of a CPC with the IAG is usually done based on the rate (i.e., particles per unit time), by comparing the count rate measured by the CPC with the generation rate of the IAG, when the CPC has a capability of exporting the count rate. In this study, however, the evaluation of the CPC was done based on the concentration, by separately measuring flow rates to convert the measured generation and count rates to the corresponding concentrations, so that calibration results by the IAG can be directly compared with those by the other NCSs (Section 3.2).
Inside the IAG, an inkjet device aerosolizes either a solution consisting of sodium chloride (NaCl) and ultrapure water or ultrapure water only. The inkjet generates monodisperse liquid droplets at a constant rate. The rate was fixed at 100 s−1 in this study, which resulted in 6 particles cm−3 at the flow rate of 1 L min−1. The water content of the droplets evaporates, and the non-volatile content forms solid particles. The mobility-equivalent particle diameter of the ultrapure water residue was determined by SMPS measurements, and the mobility-equivalent diameter of the generated NaCl particles is evaluated as a function of their mass concentration in the solution by separate experiments. schematically shows the experimental setup used with the IAG in calibrating the CPC 3772.
FIG. 3 Experimental setup used with the IAG in CPC calibration.
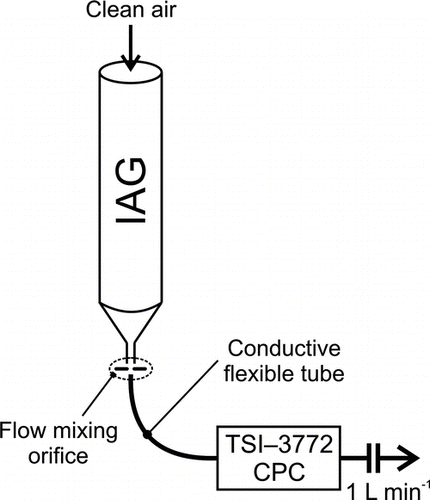
The sampling line consists of a flow mixing orifice and a flexible conductive tube. Aerosolized particles exiting from the IAG are gently mixed with the “Clean air” carrier gas as they flow through the orifice attached to the IAG exit. This mixing is essential for achieving homogeneity of particle concentration across the cross section of the aerosol flow. The operating flow Reynolds number at 1 L min−1 was 780 in this study. The flexible tube was 37-cm long and of 5-mm inner diameter. The tube was long and bent by 90° because the IAG was oriented vertically, as it is designed to operate, while the inlet of the CPC stuck out sideways. The radius of the bend was approximately 21 cm and because of the bend, particle losses in the tube may be significant especially for large particles. Evaluation of particle losses and other effects were performed in separate experiments, which are described in the Supplementary Information. After passing through the orifice and the flexible conductive tube the particles were detected by the CPC.
3. EVALUATION OF THE CPC DETECTION EFFICIENCY AND ITS UNCERTAINTY
3.1. SCAR and AIST Primary NCS
The following procedure for calculating the CPC detection efficiency and evaluating its uncertainty is applicable to measurements made with SCAR and the primary NCS of AIST. It does not take into account the uncertainty in particle size. In general, the detection efficiency is defined as a ratio of the number concentration measured by the CPC to that measured by the FCAE:
The standard uncertainty of the detection efficiency can be derived by the law of propagation of the uncertainty as
For the FCAE, the number concentration was calculated with EquationEquation (1). The standard uncertainty for the FCAE number concentration can be expressed as:
FIG. 4 Calibration results for the same CPC 3772 (TSI Inc., Shoreview, MN, USA) made with the three different number concentration standards. The abscissa is the mobility-equivalent particle diameter. Results with similar symbol are obtained with the same standard.
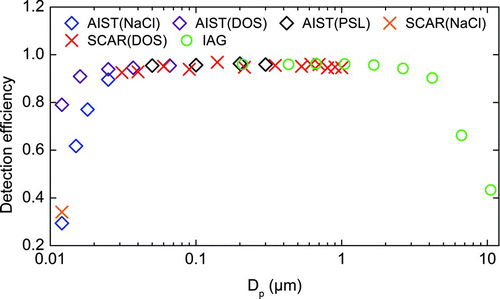
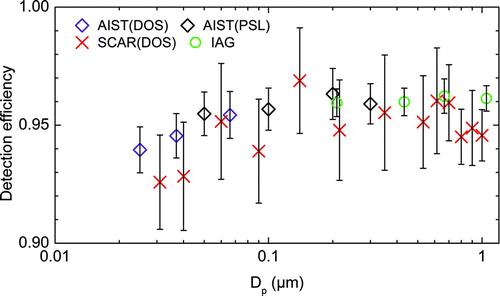
FIG. 5 Close view of the calibration results obtained with the three different number concentration standards together with the related expanded uncertainties (k = 2). The abscissa is the mobility-equivalent particle diameter.
3.2. IAG
For the IAG, as stated in Section 2.4, the ratio of the count rate by the CPC (f CPC) to the IAG's generation rate (f IAG) is usually used for evaluation of the CPC detection efficiency. In this study, however, the efficiency was calculated as the ratio of the concentration measured by the CPC to the concentration generated by the IAG, so that it can be directly compared with efficiencies determined by the SCAR and the AIST primary NCS. The concentration measured by the CPC, that is, C CPC in Section 3.1, can be reproduced by dividing the count rate measured by the CPC to the flow rate that is used for calculation of concentration in the CPC (q CPC), which is 1 L min−1 for the 3772 CPC. The concentration of the aerosol that the IAG generates can be calculated by dividing the IAG generation rate by the flow rate though the IAG (q IAG). While the flow rate through the IAG was not measured directly during the study, the flow rate can be estimated accurately since it is equal to the inlet flow rate of the CPC, which was measured many times during the study. The average and standard uncertainty of the inlet flow rate of the CPC were 0.993 L min−1 and 0.002 L min−1, respectively. The concentration-based apparent efficiency of the IAG–CPC system, ηIAG, is therefore calculated as:
The relative standard uncertainty for the detection efficiency can be derived from Equations Equation(16) and Equation(17) as:
4. RESULTS
Following the procedures presented in the Section 2, a set of CPC calibrations was made with the three standards for a particle size ranging from 10 nm to 11 μm. This practically covered the whole measurement range of the instrument. shows all the results from the CPC 3772 calibration for the IAG and SCAR, and results obtained using 3200 particles cm−3 for the primary NCS of AIST.
Before interpreting the results in , it should be stated that this particular CPC 3772 unit was found to agree with the manufacturer's 10 nm cut-off size specification. The test was made with the AIST primary NCS using 10 nm sucrose particles and resulted in the detection efficiency of 0.43.
Regarding the comparison between the 3 NCSs, sufficient overlap in particle size was achieved between the SCAR and 2 other NCSs. The results obtained with the AIST primary NCS for the smallest particle sizes, clearly indicate the well-known material dependence of the CPC lower detection limit (Wang et al. Citation2010). Compared to other particle sizes, the results for 12 nm (NaCl) obtained with the two standards have a slightly larger deviation, which is presumably caused by a small difference in the particle size between the standards. Even a small change in particle size close to cut-off size of a CPC would cause major change in the detection efficiency. The plateau efficiency for this individual CPC unit calibrated in this study is about 0.96 (). For the largest particle sizes the results obtained with the IAG show that a 50% upper cut-off size is about 9.3 μm.
According to the results, this particular CPC could even be used for measuring the total number concentration for particles below 2.5 μm aside the PM2.5 filter-based mass measurement with a carefully designed measurement setup. This suggests that the number concentration data for particles below 2.5 μm could be collected as a part of environmental monitoring. The information could be used for epidemiological studies and eventually even be taken into account for future legislation.
In order to compare the three standards reliably, a particle size range where the CPC detection efficiency is practically unaffected by the size and material is selected for further analysis from the data presented in . According to this criterion, data for NaCl are omitted for the AIST primary NCS and SCAR, and other results in the particle size range from 25 nm up to 1 μm are accepted. Results are shown in together with the expanded uncertainties (k = 2) calculated according to Section 3.
In , the results for individual particle sizes obtained with the three standards agree within the uncertainty limits. In order to find out whether some separable systematic effect causes difference to the results, the average detection efficiencies were calculated for each of the standards. reveals that the CPC detection efficiency value increased slightly with size up to 0.2 μm, and is practically constant for larger sizes up to 1 μm. Therefore, two sets of average values were calculated for making comparisons, that is, one for particle sizes below 0.4 μm (calculated only for the SCAR and the primary NCS of AIST) and the other for particle sizes equal or larger than 0.2 μm. The expanded standard uncertainties for the average detection efficiency values were calculated as experimental standard deviation of the mean. Before calculating the average values, it should be noted that the average number concentrations in the calibrations were very different: 7850 particles cm−3 for the SCAR, 3200 particles cm−3 for the primary NCS of AIST, and 6 particles cm−3 for the IAG. Therefore, the average values presented below are corrected for the concentration dependence of the CPC efficiency, which is presented in the Supplementary Information of this article.
TABLE 1 Typical values for the component uncertainties contributing to the overall standard uncertainty of the CPC detection efficiency calculated from the data in Figure 5. Results apply to following conditions: FCAE flow rate, 1 L min−1; number concentration, 8500 and 3200 particles cm−3 for the SCAR and the primary NCS of AIST
For particle sizes below 0.4 μm we obtained: 0.948 ± 0.012 for the SCAR and 0.953 ± 0.006 for the AIST primary NCS. For particle sizes equal or larger than 0.2 μm we obtained: 0.955 ± 0.005 for the SCAR, 0.961 ± 0.005 for the AIST primary NCS, and 0.960 ± 0.002 for the IAG. Since both sets of the average values obtained with all of the three standards agree within the uncertainty limits, as a conclusion, no separable systematic difference exists between the three standards. The fact that standards having different origin and/or operation principles are consistent is a strong justification for the use of the standards. The comparison reported in this study is the first one that has been carried out by using primary NCSs of different countries, and the second in line conducted on a metrological level. In the first comparison, secondary standards (e.g., CPCs) originating from different countries were compared and the results were found to agree within 5% (k = 2). In this study, the three standards were found to agree within 0.5% (k = 2), which is a major improvement in the field.
In the calibration measurements made in this work, the relative expanded uncertainty values for the detection efficiency were between 1.1% and 2.6% for the SCAR, between 0.8% and 1.1% for the AIST primary NCS. For the IAG the respective values (sub-micrometer particles) were between 0.6% and 0.8%. In order to find out the main reasons that caused the larger uncertainties for the SCAR compared to the AIST primary NCS, the individual uncertainty components were compared between the two standards. Reading from top to bottom, shows how the overall uncertainty for the detection efficiency is formed step by step from the individual uncertainty components for the two standards.
The terminology follows the uncertainty evaluation presented in Section 3. The uncertainty components shown in the leftmost column are rather straightforward except for the first component from the top. The first uncertainty component includes all the type B uncertainties for the FCAE number concentration (see EquationEquation (13)), that is, the uncertainty of the calibration factors of the sensors, the uncertainty of the detection efficiency of the FCAE, and the uncertainty of the average charge of the particles. The last two terms under the square root are practically equal for the SCAR and the primary NCS of AIST and therefore the first component in presents the theoretical minimum achievable uncertainty for the FCAE number concentration. According to the results, some improvement in the performance of the SCAR can be achieved by more accurate sensor calibrations, but clearly this is not the dominant uncertainty component.
By looking at the whole table, two sources of uncertainty rise above others: the uncertainty of the offset corrected current (u(ΔI)/ΔI) and the uncertainty of the bias between the sampling ports (u(β b /β a )). The former is not related to the performance of the FCAE itself but is related to how the electrometer is configured to measure the electric current. In the SCAR 1 value from the electrometer was read and stored per second. Owing to software issues that have been solved afterwards, only 20 ms integration time was used for the electrometer. This means that 98% of the time that could have been used for averaging was missed. With the primary NCS of AIST, one value from the electrometer was read and stored per 2.4 s. Each of the stored values was an average of 10 successive current measurements made using 200 ms integration time. As a consequence, the total effective measurement time was 2 out of 2.4 seconds and only about 17% of the time was missed. By using more time efficient settings for the electrometer used with the SCAR, the uncertainty of the offset corrected current can be expected to decrease remarkably and will be used in future studies with the SCAR.
In , the uncertainties for the setup II with the SCAR are smaller in general than the results for the setup I due to two reasons: for the setup II no correction term (δΔIi in EquationEquation (8)) was needed to the measured current, and a mixer was installed after the DMA in setup II. By adding a mixer just before the flow splitter to both setups (I and II), the uncertainty related to the bias is expected to decrease closer to the corresponding value typical for the AIST primary NCS.
5. CONCLUSION
A comparison between three particle NCSs was carried out by calibrating the same individual CPC (Model 3772, TSI Inc., Shoreview, MN) with each standard. The applied standards were: the primary NCS of AIST, the SCAR, and the IAG of AIST. The results obtained with the three standards were found to agree at all overlapping particle sizes within the uncertainty limits. The determined relative expanded uncertainties (k = 2) for the detection efficiency were between 0.8% and 1.1% for the primary NCS of AIST and between 1.1% and 2.6% for the SCAR. For the IAG the respective uncertainties for sub-micrometer particles were between 0.6% and 0.8%. The overall agreement between the different standards was within 0.5%. The reported comparison is the first one that has been carried out by using primary NCSs of different countries.
As a result of the above study, a CPC 3772 was successfully calibrated in a particularly wide size range, approximately between 10 nm and 10 μm. In the lower size end, the CPC was found to agree with the manufacturer's 10 nm cut-off size specification. According to the results obtained with the IAG, the CPC showed cut-off behavior at upper size end as well. At about 10 μm the detection efficiency dropped down below 50%. The CPC detection efficiency was nearly constant up to 2.5 μm which indicates that with carefully designed measurement setup the CPC could be used reliably even for measuring the total number concentration up to 2.5 μm in parallel with the PM2.5 mass measurement. As an important consequence of this study, a CPC can be considered as a useful secondary calibration tool for particle number concentration in an exceptionally wide particle size range if the CPC is proved via calibration to have a detection efficiency of nearly unity with little size dependence in the size range.
uast_a_701023_sup_26767345.zip
Download Zip (187.9 KB)Acknowledgments
Publication of this article does not imply recommendation or endorsement of any commercial products by the National Institute of Advanced Industrial Science and Technology (AIST).The work related to the SCAR was supported by the project “MESTAN—Traceable measurement of nanoparticles” funded by Tekes—the Finnish Funding Agency for Technology and Innovation, Dekati Ltd., Ecocat Oy, and Gasmet Technologies Oy, and also by the Cluster for Energy and Environment (CLEEN Ltd., MMEA, WP 4.5.1). The authors truly acknowledge Mr. Richard Högström and Dr. Martti Heinonen from Mikes—Centre for Metrology and Accreditation (Finland) for providing traceable, high-quality instrumentation for the measurements. The work with the Inkjet Aerosol Generator in this study was supported by the Environment Research and Technology Development Fund (RF-1001) of the Ministry of the Environment, Japan. The authors would like to thank Ms. Emiko Ohnuma for her assistance in carrying out the measurements.
[Supplementary materials are available for this article. Go to the publisher's online edition of Aerosol Science and Technology to view the free supplementary files.]
Notes
Note that the derivation and uncertainty evaluation of the CPC detection efficiency from 10-repetition measurements in regular CPC calibrations at AIST (Wang et al. Citation2010) differ from the procedure presented in Section 3. In the regular calibration at AIST, the ratios of the CPC concentration to the FCAE concentration for each repetition were averaged to calculate the mean CPC efficiency. If the particle generation operated in a stable manner during the 10 repetitions, the two methods would result in very similar efficiency and uncertainty values. The method applied in this article has the advantage of revealing differences in evaluated uncertainties between SCAR and the AIST primary NCS, which will be discussed in Section 4.
Related Research Data
REFERENCES
- Agarwal , J. K. and Sem , G. J. 1980 . Continuous Flow, Single-Particle Counting Condensation Nucleus Counter . J. Aerosol Sci. , 11 : 343 – 357 .
- Barthazy , E. , Stetzer , O. , Derungs , C. , Wahlen , S. and Lohmann , U. 2007 . “ Characterization of a Propane Soot Generator ” . In Nucleation and Atmospheric Aerosols, 17th International Conference, Galway, Ireland , Edited by: O’Dowd , C. D. and Wagner , P. E. 834 – 839 . Berlin : Springer .
- CAFE (Clean Air For Europe) . 2001 . The Clean Air for Europe Programme: Towards a Thematic Strategy for Air Quality. European Commission . Available online at http://eur-lex.europa.eu/LexUriServ.do?uri=CELEX:52001DC0245:EN:NOT
- Ehara , K. and Sakurai , H. 2010 . Metrology of Airborne and Liquid-Borne Nanoparticles: Current Status and Future Needs . Metrologia , 47 : 83 – 90 .
- European Commission . 2008 . Regulation No. 692. Implementing and Amending Regulation (EC) No. 715/2007 of the European Parliament and of the Council on Type-Approval of Motor Vehicles with Respect to Emissions from Light Passenger and Commercial Vehicles (Euro 5 and Euro 6) and on Access to Vehicle Repair and Maintenance Information . Offic. J. Eur. Union , L : 199/1
- Fletcher , R. A. , Mulholland , G. W. , Winchester , M. R. , King , R. L. and Klinedinst , D. B. 2009 . Calibration of a Condensation Particle Counter Using a NIST Traceable Method . Aerosol Sci. Technol. , 43 : 425 – 441 .
- Gormley , P. G. and Kennedy , M. 1949 . Diffusion from a Stream Flowing Through a Cylindrical Tube . Proc. R. Irish Acad. A , 52 : 163 – 169 .
- Högström , R. , Yli-Ojanperä , J. , Rostedt , A. , Iisakka , I. , Mäkelä , J. M. Heinonen , M. 2011 . Validating the Single Charged Aerosol Reference (SCAR) as a Traceable Particle Number Concentration Standard for 10 to 500 nm Aerosol Particles . Metrologia , 48 : 426 – 436 .
- Hoppel , W. A. 1978 . Determination of the Aerosol Size Distribution from the Mobility Distribution of the Charged Fraction of Aerosols . J. Aerosol Sci. , 9 : 41 – 54 .
- Iida , K. , Sakurai , H. , Saito , K. and Ehara , K. An Inkjet Aerosol Generator for Calibrating Particle Counters . Abstract book of International Aerosol Conference 2010 Helsinki , Poster Number P1E59, http://www.atm.helsinki.fi/IAC2010/abstracts/abstbook.html
- Iida , K. , Sakurai , H. , Saito , K. and Ehara , K. Characterization of Inkjet Aerosol Generator . in preparation
- IPCC (The Intergovernmental Panel on Climate Change) . 2007 . Intergovernmental Panel on Climate Change Fourth Assessment Report: Climate Change 2007 (AR4). The Physical Science Basis. Solomon, S., D. Qin, M. Manning, Z. Chen, M. Marquis, K. B. Averyt, M. Tignor, and H. L. Miller, eds. Cambridge University Press, Cambridge, UK, and New York .
- ISO 14644-1 . 1999 . Cleanrooms and Associated Controlled Environments—Part 1: Classification of Air Cleanliness . International Organization for Standardization, Geneva, Switzerland.
- Kauppinen , E. I. and Hillamo , R. E. 1989 . Modification of the University of Washington Mark-5 in-stack Impactor . J. Aerosol Sci. , 20 : 813 – 827 .
- Keskinen , J. , Pietarinen , K. and Lehtimäki , M. 1992 . Electrical Low Pressure Impactor . J. Aerosol Sci. , 23 : 353 – 360 .
- Knollenberg , R. G. and Luehr , R. 1976 . “ Open Cavity Laser “Active” Scattering Particle Spectroscopy from 0.05 to 5 Microns ” . In Fine Particles-Aerosol Generation, Measurement, Sampling, and Analysis , Edited by: Liu , B. Y. H. 669 – 696 . London : Academic Press .
- Liu , B. Y. H. , Pui , D. Y. H. , Hogan , A. W. and Rich , T. A. 1975 . Calibration of the Pollak Counter with Monodisperse Aerosols . J. Appl. Meteorol. , 14 : 46 – 51 .
- NSF . June 27–28, 2003 . Workshop Report on “Emerging Issues in Nanoparticle Aerosol Science and Technology (NAST)” , Los Angeles : University of California .
- Sakurai , H. and Ehara , K. 2011 . Evaluation of Uncertainties in Femtoampere Current Measurement for the Number Concentration Standard of Aerosol Nanoparticles . Meas. Sci. Technol. , 22 : 024009
- Schlatter , J. 2009 . Final Report of EURAMET Project 1027 (http://www.euramet.org)
- Takegawa , N. and Sakurai , H. 2011 . Laboratory Evaluation of a TSI Condensation Particle Counter (model 3771) under Airborne Measurement Conditions . Aerosol Sci. Technol. , 45 : 272 – 283 .
- Wang , S. C. and Flagan , R. C. 1990 . Scanning Electrical Mobility Spectrometer . Aerosol Sci. Technol. , 13 : 230 – 240 .
- Wang , X. , Caldow , R. , Sem , G. J. , Hama , N. and Sakurai , H. 2010 . Evaluation of a Condensation Particle Counter for Vehicle Emission Measurement: Experimental Procedure and Effects of Calibration Aerosol Material . J. Aerosol Sci. , 41 : 306 – 318 .
- Yli-Ojanperä , J. , Mäkelä , J. M. , Marjamäki , M. , Rostedt , A. and Keskinen , J. 2010 . Towards Traceable Particle Number Concentration Standard: Single Charged Aerosol Reference (SCAR) . J. Aerosol Sci. , 41 : 719 – 728 .