Abstract
Air pollution emissions from major ports around the world contribute to airborne particulate matter (PM) exposure in surrounding communities. The Port of Oakland is one of three major shipping ports in California that collectively account for 39% of all the goods movement in the United States. The current study is the first to perform relatively complete chemical speciation on the real-world reduction in primary PM emissions from heavy-duty trucks at a major shipping port during the implementation of a retrofit and replacement program. Measurements of fine PM composition at the Port were analyzed by using positive matrix factorization (PMF) to identify five dominant PM sources: shipping, port truck traffic, distant on-road traffic, background sea spray, and road dust. Changes to port truck traffic-related PM concentration on days with similar meteorological conditions during and after implementation of the controls were used as a direct indication of emissions reductions. Primary PM mass emissions from port trucks decreased by 75% due to the control program, which meets the targets inherent in the Emission Reduction Plan for Ports and Goods Movement in California. Contributions of PM components attributed to port truck activities decreased by amounts ranging from 66% to 87% (elemental carbon (EC) = 66%, organic carbon (OC) = 78%, Na = 82%, Ba = 84%, Fe = 87%). These reductions include contributions from both tailpipe emissions and brake/tire wear. Prior to implementation of the control program, port trucks accounted for approximately 56% of the ambient EC concentrations in the vicinity of the Port while ships accounted for approximately 12% of the EC concentrations. After implementation of the control program, port trucks and ships accounted for approximately 23% and 29% of the ambient EC concentrations at the Port, respectively. The current study provides an example of how emissions control programs at other major shipping ports in the United States could lower overall emissions.
Copyright 2013 American Association for Aerosol Research
INTRODUCTION
The ambient concentration of airborne particulate matter (PM) mass with aerodynamic diameter smaller than 2.5 μm (PM2.5) has been correlated with acute and chronic mortality (Dockery et al. Citation1993). Recent studies have attempted to correlate PM trace component concentrations with health effects to find significant associations with respiratory illness, cardiovascular and cardiopulmonary disease, and lung cancer (Samet et al. Citation2000; Brunekreef and Holgate Citation2002; Pope et al. Citation2002; Pope and Dockery Citation2006). Goods movement through shipping ports represents one of the most concentrated industrial sources of PM2.5 adjacent to major population centers in the United States and across the world (Wu et al. Citation2009). Reductions in PM emissions from shipping ports are critical for improved global public health.
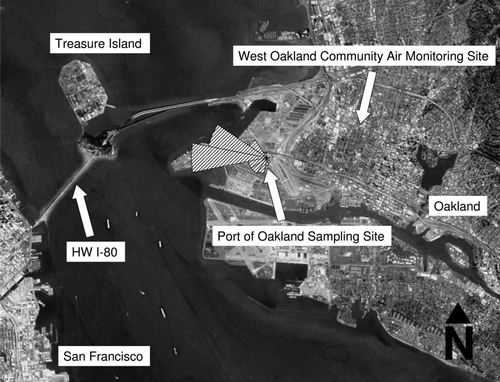
FIG. 1 Map of the Port of Oakland with wind rose including the locations for the sampling site and the West Oakland community air-monitoring site. The airfield located to the south of the sampling site is the former Alameda Naval Air Station (now closed).
The state of California approved an Emission Reduction Plan for Ports and Goods Movement in 2006 with the goal to reduce emissions associated with domestic and international goods movement to 2001 levels by the year 2010. The ultimate objective of this plan was to reduce the health effects caused by goods movement PM emission by 85% by the year 2020 (CARB Citation2006a). California has three major ports in the cities of Los Angeles, Long Beach, and Oakland that collectively accounted for 99% of the goods movement through the state and 39% of the goods movement through the United States in 2010 by container port traffic measured in twenty-foot equivalent units (TEUs) (AAPA Citation2009). The Port of Oakland implemented an air quality improvement program called the Comprehensive Truck Management Plan (CTMP) beginning in October 2009 as a step toward compliance with the statewide Emission Reduction Plan including the Drayage Truck Rule. The first phase of CTMP required the Licensed Motor Carriers (LMCs) to execute a Secure Truck Enrollment Program (STEP) agreement with the Port of Oakland and the second phase, initiated in January 2010, required the LMCs to enter truck information into the Port Registry database (Port Registry Compliance) by April 2010. The activities at the Port were regulated or terminated for those who did not comply and for those who did not meet the modern emissions standards through a truck retrofit or replacement program. The two-phase implementation (Phases 1 and 2) helped satisfy the core goals of the Port of Oakland including increased port security and decreased emissions from the heavy-duty diesel vehicles (HDDVs) (Port Citation2009).
The objective of the present study is to report the real-world reductions in HDDV trace PM component emissions observed after Phase 2 of the CTMP at the Port of Oakland. Daily measurements of ambient PM composition during a 3-month period were analyzed by using positive matrix factorization (PMF) to identify source contributions from HDDVs at the Port, shipping traffic at the Port, regional traffic, and background marine sources. The changes in the Port HDDV emissions rate of trace PM components (elemental carbon [EC], organic carbon [OC], Na, S, V, Ba, Fe, and Pb) were calculated as was the estimated reduction in truck-related PM exposure in the surrounding areas. The additional reductions needed to meet the goals of the statewide Emission Reduction Plan were then estimated.
METHODS
Airborne PM samples were collected at the Port of Oakland at N37°48'20”, W122°18'43” as shown in . Sixty samples were collected over 24-h periods starting at 4 PM on weekdays between 8 March 2010 and 28 May 2010. The Reference Ambient Air Sampler (RAAS) used to collect samples included two AIHL-design cyclones operated at 30 L min−1 yielding a cut size of 1.8 μm particle aerodynamic diameter (John and Reischl Citation1980). Each cyclone was followed by three sampling trains yielding a total of six samples collected in parallel. Three samples were collected on a Teflon filter (Teflo R2PJ047; Pall Corp., Port Washington, NY, USA) while the other three samples were collected on a quartz filter (QAO47; Pall Corp., Port Washington, NY, USA) followed by a backup quartz filter (quartz behind quartz).
Teflon filters were weighed before and after sample collection by using a Cahn28 microbalance. Teflon filters were then cut in half with one side analyzed for water-soluble cations and anions by using ion chromatography, and the other side analyzed for elements by using inductively coupled plasma mass spectrometry (ICP-MS) (Herner et al. Citation2005; Citation2006). Quartz filters were analyzed for OC and EC by using a thermal—optical method following the National Institute for Occupational Safety and Health (NIOSH) temperature protocol (Birch and Cary Citation1996; NIOSH Citation1996).
Field blanks were analyzed alongside all samples to estimate background contamination levels, which were then subtracted from primary filter results. OC field blanks were estimated as the OC concentration on the quartz behind quartz filter to simultaneously account for background contamination and adsorption artifacts.
Colocated filters were compared as a quality control check before data analysis. Table S1 in the online supplemental information section summarizes a regression analysis between PM mass and analytes measured on colocated filters by using microbalance, ion chromatography (IC), and ICP-MS. Least-squares regression slopes ranged between 0.86 (Se) and 1.06 (Ga) with most values close to 1.0. The correlation coefficient (R 2) ranged between 0.85 (Mn) and 0.99 (Pb). The results of the colocated analysis are consistent with previous ambient experiments suggesting that the measurements are robust enough to support further data analysis (Ham et al. Citation2010). Mass closure calculations were also performed by comparing the mass measured from gravimetric analysis to the sum of masses from IC, ICP-MS, and ECOC analyzer (where OM/OC ratio = 1.8). The sum of the reconstructed mass was generally within 5% of the gravimetric measurements.
The wind rose in illustrates the average wind direction and speed during the days when samples were collected in the present study. The dominant wind direction was from the west with daily average wind speeds ranging from 4 to 20 mph. Major sources of PM1.8 to the west of the sampling site include ships, major highway traffic (I-80), and background marine aerosol. A wind field analysis indicates that sources located east of the sampling site did not contribute significantly to measured PM concentrations during the current study.
RESULTS
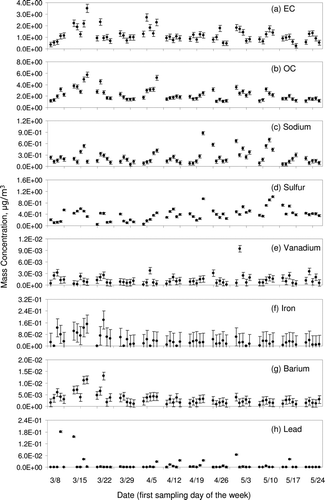
The time series for several of the key species found in airborne particles at the Port of Oakland are shown in . In the present study, Na is primarily associated with sea spray, S and V are primarily associated with shipping, Fe and Ba are primarily associated with traffic, and Pb is primarily associated with road dust. Although Cu and Zn are commonly used as tracers for brake wear, measured concentrations of these species did not reach minimum detection limits and/or they failed to pass colocated QA/QC checks, which prevented these species from advancing into the analysis dataset. Similarly, Si and Ti, common tracers for soil dust, failed QA/QC checks and were rejected from further analysis. Figure S1 represents the time series of all species that were not utilized. Fe and Ba have similar patterns but otherwise it is difficult to discern relationships between different PM components without a more sophisticated statistical analysis (see following sections). Mass closure calculations revealed 5% daily PM mass unaccounted for in the analysis dataset. Missing mass resulted from exclusion of chemical species that did not pass the QA/QC that includes certain trace metals and ions such as nitrates that were present in low concentrations. The original deadline for implementation of Phase 2 of the CTMP landed between the end of March and the middle of April. However, the California Air Resources Board (CARB) delayed enforcement of the Drayage Truck Rule leading to a gradual adoption of new technology throughout the month of April 2010 (Jones and Leong Citation2012). Concentrations of EC, OC, Fe, Ba, and Pb generally decreased over this time period while Na and S concentrations generally increased. Some of this time trend results from changes in meteorology. Wind direction was relatively constant throughout the study although the average wind speed during the months of April and May was approximately 1.5 mph faster than during March at the nearby Oakland International Airport. Increased wind speed will dilute emissions from port trucks and ships, which are close to the sampling site, making it difficult to quantify emissions changes associated with the adoption of cleaner technology. The full time series shown in was used for factor identification in the PMF analysis, but the comparison between emissions during and after the implementation of CTMP Phase 2 was limited to periods with wind speeds ranging from 5 to 11 mph and wind direction from the west and from the west north west (WNW). Seven representative days were identified during Phase 2 with average wind speed 8 ± 2.9 mph and direction 283 ± 16°. Seventeen representative days were selected after Phase 2 with average wind speed and direction of 8 ± 1.4 mph and 279 ± 14°. The ambient concentrations measured on the days that fall into these time periods can be interpreted as changes to nearby emissions since meteorological conditions are essentially constant. Planetary boundary layer (PBL) changes were also considered for this intercomparison to understand the ventilation rate during the comparison days. Port truck concentrations were generally not correlated with the ventilation rate in the current study because sample collection occurred close to the emissions point, providing insufficient time for complete mixing up to the height of the atmospheric inversion layer. Further discussion is provided in the following sections.
FIG. 2 Time series for key source-identifying species measured at the Port of Oakland: (a) EC, (b) OC, (c) Na: signature for sea spray, (d) S and (e) V: signature for shipping, (f) Fe and (g) Ba: signature for traffic, and (h) Pb: signature for road dust. Deadline for CTMP Phase 2 ended early April.
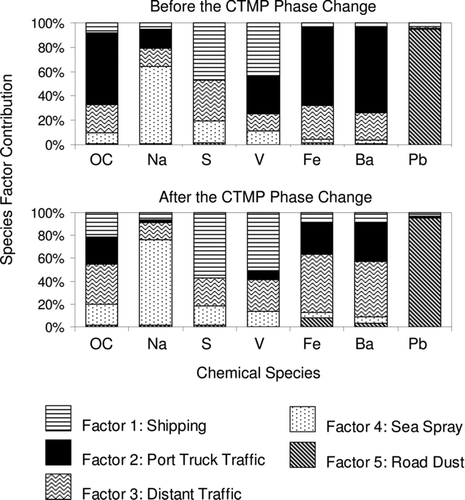
summarizes the factor profiles produced by analyzing the full PM1.8 dataset obtained from the Port of Oakland by using PMF version 3.0. The analysis was performed by using the uncertainties of individual species obtained from a study comparing the accuracy and precision of ICP-MS and X-ray fluorescence (XRF) analysis techniques. Each PMF factor is composed of chemical species that have similar time patterns at the sampling site (Chueinta et al. Citation2000). Tentative source names were assigned to factors based on known chemical signatures measured during source tests. All factors include contributions from the regional background aerosol that essentially has the signature of sea spray (Na, Mg, Cl, and Br) that has undergone various degrees of chemical aging. Factor 4 (sea spray) illustrates the fresh sea spray chemical signature where Cl has not yet been lost to gas—particle conversion processes (Gard et al. Citation1998). Aged sea spray exhibits various degrees of Cl replacement by nitrate (NO3 −; not reported). Note that Factor 4 has minor amounts of OC but essentially no EC consistent with other measurements of marine background aerosol (Middlebrook et al. Citation1998).
FIG. 3 Five-factor profiles obtained from analyzing PM1.8 samples retrieved at the Port of Oakland by using PMF modeling: shipping (Factor 1), port truck traffic (Factor 2), distant traffic (Factor 3), sea salt (Factor 4), and road dust (Factor 5). All factors include a mixed signal due to turbulent mixing caused by the ocean breeze.
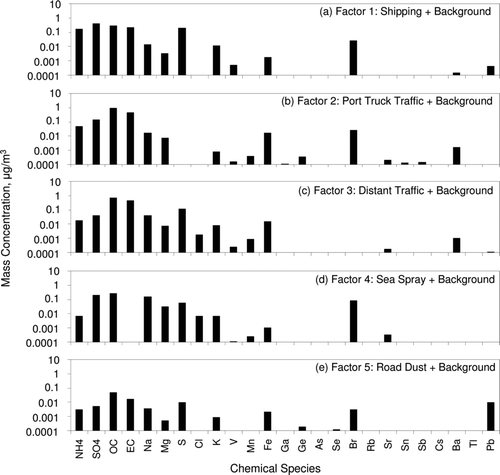
Factor 1 accounts for the majority of the S and V in airborne particles, identifying it as ship emissions. Recent changes to the ship fuels used at the Port of Oakland have emphasized cleaner distillate fuel ahead of traditional marine fuel, but even these new clean ship fuels have residual traces of S and V that make them the dominant regional sources for these elements.
Factor 2 accounts for the majority of the EC, Fe, and Ba at the sampling site, identifying it as a mixture of mobile-source tailpipe exhaust and brake wear. Factor 2 is the only factor with a chemical profile that does not contain S, strongly suggesting that this source did not emit significant quantities of S and that it was close enough to the collection device so that condensation of S from other sources did not have sufficient time to occur. These features of the chemical profile, combined with the dominant wind direction from the WNW and the identification of on-road traffic as a separate factor (see following discussion) makes it highly probable that Factor 2 represents truck traffic transporting containers in and out of the Port of Oakland. Factor 2 will be the focus of significant analysis in later sections of the manuscript.
Factor 3 has a similar chemical profile to Factor 2 with two notable exceptions: Factor 3 contains higher concentrations of S and Cl. This identifies Factor 2 as a traffic source that had sufficient time for condensation of S and that was heavily mixed with background sea spray prior to sample collection. The map shown in illustrates that the most likely source for particles associated with Factor 3 was “distant traffic” on Interstate 80 that connects San Francisco to the rest of the Bay Area. The concentration ratio of Na/Mg is 5.67 in Factor 3 and 5.34 in Factor 4 confirming that the combination of a distant traffic source is traveling over a body of salt water prior to reaching the sampling site.
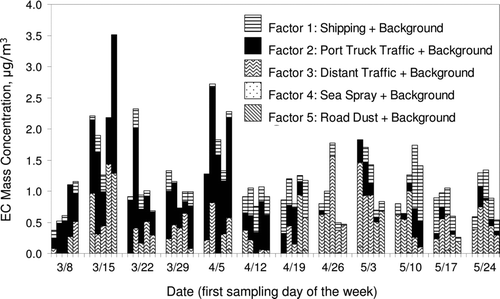
FIG. 4 Factor contributions to the time series of EC measured from 24-h PM1.8 samples over the course of the field campaign (8 March 2010 to 28 May 2010).
Factor 5 contained the highest measured concentrations of Pb along with more modest contributions to Fe. This combination identifies Factor 5 as the tail of a paved road dust signal extending into the PM1.8 size fraction. Pb is widely used as weights to balance automobile tires. When the weights fall off they are ground into road dust by the highway traffic, producing a road dust signature (Lough et al. Citation2005). The road dust signal was very intermittent, occurring mostly in periods of either low wind speed or high wind speed.
illustrates the source contributions to the EC time series at the Port of Oakland. Port truck traffic makes a significant contribution to EC concentrations prior to ∼15 April with much lower contributions after that date. Phase 2 of the CTMP mandated the completion of the Port Registry entry by all LMCs by the beginning of April 2010. Only trucks registered by LMCs in compliance with the Port Registry were allowed to enter the port facilities. It is likely that Phase 2 helped achieve compliance with the new Drayage Truck Rule by ensuring that drayage trucks with engine models predating 1994 were prohibited entrance to the Port and engine models dating between 1994 and 2003 had CARB-verified level 3 diesel particle filters (DPFs) properly installed despite the deadline extension of drayage truck regulation to May 2010 (Port Citation2009; Jones and Leong Citation2012). The effects of the CTMP Phase 2 and the approaching deadlines became evident within a few weeks after the target implementation date when port truck traffic contributions to EC concentrations decreased strongly.
compares source (factor) contributions to EC concentrations at the Port of Oakland during and after the implementation of the CTMP Phase 2. Source signatures are taken to be factors as illustrated in and . The analysis is limited to days with wind speed between 5 and 11 mph and wind direction from the west and WNW, so that meteorological conditions are relatively constant for the comparison during and after implementation of CTMP Phase 2. Total ventilation (V) (m2 sec−1) around the Port was calculated as the product of the wind speed and the height of the temperature inversion measured at the nearby Oakland International Airport. PM concentrations associated with the “distant traffic” source were generally correlated in time with inverse ventilation rate (1/V) (Figure S2) indicating that this source was well mixed in the PBL prior to reaching the sampling site. Port truck emissions were not correlated with inverse ventilation (1/V) because the emissions were essentially colocated with the PM monitors. Wind speed is therefore the dominant factor controlling dilution of port truck emissions in the present study, and the comparison between days with similar wind speed essentially provides a method to study changes in emissions rates from port trucks.
FIG. 5 EC factor contribution during and after the CTMP implementation phase change.
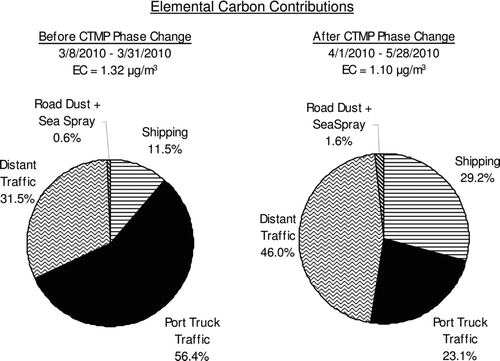
On days with similar meteorological conditions, ambient EC concentrations decreased from 1.32 ± 0.25 μg m−3 to 1.10 ± 0.13 μg m−3 after adoption of the CTMP Phase 2, but the source apportionment results indicate that adoption of cleaner diesel engines at the Port of Oakland reduced EC emissions from port trucks by 66 ± 14% (0.56 × 1.32 vs. 0.23 × 1.10). This compares with an estimated decrease of 49 ± 15% based on direct measurements from combined truck plumes in November 2009 versus June 2010 (Dallmann et al. Citation2011). The more modest reductions in total ambient EC concentrations are driven by the reductions associated with CTMP Phase 2 and a simultaneous increase in EC concentrations associated with distant traffic sources (I-80) and with ship emissions. Increased ship emissions are dominated by a single cluster of days following 10 May 2011, which corresponds to random fluctuations in the arrival of ships at upwind docks. An average ship remains docked at the Port for 17 h making it difficult to infer statistically significant results in ship emissions from the limited number of sample days in the current study (Jones and Leong Citation2012). In contrast, more than 100,000 vehicles travel along the I-80 corridor between San Francisco and the greater Bay Area each day with a standard deviation of approximately 10% making it highly unlikely that the increased EC concentrations associated with this source detected after implementation of the CTMP Phase 2 represents a change in activity patterns (Caltrans Citation2012). As discussed above, the concentration of EC from “distant traffic” sources was generally correlated with the inverse of the ventilation rate (1/V) (Figure S2) indicating that the height of the atmospheric temperature inversion affected PM concentrations measured from this source at the Port of Oakland. The increase in “distant traffic” EC at the Port of Oakland in the latter portion of the study period reflects a trend of reduced ventilation for the region, concentrating the distant traffic emissions close to the ground. Statistically significant changes in emissions rates from ships and/or distant traffic sources were not detected in the current study.
and summarize the contribution of individual sources to the trace species contained in airborne particles at the Port of Oakland during and after the adoption of CTMP Phase 2. Port truck contributions to ambient concentrations of OC, Na, V, Fe, and Ba decreased after the implementation of CTMP Phase 2 by amounts ranging from 66 ± 14% (EC) to 87 ± 7% (Fe). Emissions of primary OC from port trucks were more than three times higher than emissions of EC prior to implementation of the CTMP Phase 2. OC emissions from port trucks decreased by 78 ± 11% due to the adoption of cleaner technology contributing strongly to a 45 ± 22% reduction in ambient OC concentrations at the Port. Likewise, reductions of >80% in Fe and Ba emissions from port trucks contributed strongly to reductions >70% in ambient PM1.8 concentrations for these elements. The result suggests that the CTMP may reduce population exposure to a range of trace components emitted from HDDVs around the Port of Oakland.
FIG. 6 Factor contributions to the key source-identifying species measured at the Port of Oakland sampling site.
DISCUSSION
The enforcement of CTMP Phase 2 at the Port of Oakland decreased fine primary PM emissions (EC + OC) from heavy-duty trucks by 75 ± 12%. The Emission Reduction Plan for Ports and Goods Movement in California created by CARB called for a 68% reduction in fine PM emissions from port trucks between 2000 and 2010 (assuming a truck emissions control factor of 1–0.68 = 0.32 multiplied by a typical increase in truck vehicle miles traveled (VMT) proportional to container handling = 6,697,735/4,333,309 leading to an overall decrease in truck emissions inventory totals at Bay Area = 0.1/0.2 tons day−1) (CARB Citation2006b). The Port of Oakland appears to have fulfilled the 2010 goals for HDDV measures under the Emission Reduction Plan, which puts them on track to contribute to the estimated 32% average reduction in mortality caused by primary diesel PM associated with Goods Movement in California by the year 2020 (CARB Citation2006a). A further 48% reduction in emissions from 2010 levels will be needed to fully realize the 2020 goal of reduced mortality. Future proposed measures include adoption of trucks with newer and cleaner engines, continued use of CARB-verified level 3 DPFs, and the expansion of the enforcement zone for clean Drayage trucks to include the majority of the South Coast Air Basin. Note that the majority of the avoided mortality is projected to occur in the immediate vicinity of the ports or along major truck routes leading to and from the ports. A follow-up study should be conducted at the end of the Emission Reduction Plan to determine the overall reduction in PM emissions related to the goods movement and the reduction in ambient PM concentrations in surrounding communities.
TABLE 1 Species concentration of during and after CTMP phase change where N is the sample size
uast_a_720049_sup_28101006.zip
Download Zip (96.4 KB)Acknowledgments
This work was funded by the University of California's Multi-Campus Research Program in Sustainable Transportation. The authors thank Jeff Jones and Tim Leong at the Port of Oakland for data describing the retrofit of port trucks and the activity at the Port of Oakland as a function of time. The authors thank Benjamin Bow, Elizabeth Flores, and Nhung T. Nguyen for their help with laboratory procedures.
[Supplementary materials are available for this article. Go to the publisher's online edition of Aerosol Science and Technology to view the free supplementary files.]
REFERENCES
- AAPA . 2009 . North American Container Traffic (1990–2010). , Alexandria, Virginia : American Association of Port Authorities .
- Birch , M. E., and Cary , R. A. 1996 . Elemental Carbon-Based Method for Monitoring Occupational Exposures to Particulate Diesel Exhaust . Aerosol. Sci. Tech., , 25 : 221 – 241 .
- Brunekreef , B. , and Holgate , S. T. 2002 . Air Pollution and Health . Lancet, , 360 : 1233 – 1242 .
- Caltrans . 2012 . UC Berkeley, PATH , California , Sacramento : Caltrans, State of California . http://pems.dot.ca.gov/
- CARB . 2006a . Emission Reduction Plan for Ports and Goods Movement in California Sacramento , CA : California Air Resources Board, .
- CARB . 2006b . Appendix A: Quantification of the Health Impacts and Economic Valuation of Air Pollution from Ports and Goods Movement in California Sacramento, CA : California Air Resources Board, .
- Chueinta , W. , Hopke , P. K., and Paatero , P. 2000 . Investigation of Sources of Atmospheric Aerosol at Urban and Suburban Residential Areas in Thailand by Positive Matrix Factorization . Atmos. Environ., , 34 : 3319 – 3329 .
- Dallmann , T. R. , Harley , R. A., and Kirchstetter , T. W. 2011 . Effects of Diesel Particle Filter Retrofits and Accelerated Fleet Turnover on Drayage Truck Emissions at the Port of Oakland . Environ. Sci. Technol., , 45 : 10773 – 10779 .
- Dockery , D. W. , Pope , C. A. , Xu , X. P. , Spengler , J. D. , Ware , J. H. Fay , M. E. 1993 . An Association Between Air-Pollution and Mortality in 6 United-States Cities . N. Engl. J. Med., , 329 : 1753 – 1759 .
- Gard , E. E. , Kleeman , M. J. , Gross , D. S. , Hughes , L. S. , Allen , J. O. Morrical , B. D. 1998 . Direct Observation of Heterogeneous Chemistry in the Atmosphere . Science, , 279 : 1184 – 1187 .
- Ham , W. A. , Herner , J. D. , Green , P. G., and Kleeman , M. J. 2010 . Size Distribution of Health-Relevant Trace Elements in Airborne Particulate Matter During a Severe Winter Stagnation Event: Implications for Epidemiology and Inhalation Exposure Studies . Aerosol. Sci. Technol., , 44 : 753 – 765 .
- Herner , J. D. , Aw , J. , Gao , O. , Chang , D. P., and Kleeman , M. J. 2005 . Size and Composition Distribution of Airborne Particulate Matter in Northern California: I-Particulate Mass, Carbon, and Water-Soluble Ions . J. Air Waste Manage., , 55 : 30 – 51 .
- Herner , J. D. , Green , P. G., and Kleeman , M. J. 2006 . Measuring the Trace Elemental Composition of Size-Resolved Airborne Particles . Environ. Sci. Technol., , 40 : 1925 – 1933 .
- John , W. , and Reischl , G. 1980 . A Cyclone for Size-Selective Sampling of Ambient Air . JAPCA J. Air Waste. Manage., , 30 : 872 – 876 .
- Jones , J. , and Leong , T. 2012 . Personal communication, February 2012
- Lough , G. C. , Schauer , J. J. , Park , J. S. , Shafer , M. M. , Deminter , J. T., and Weinstein , J. P. 2005 . Emissions of Metals Associated with Motor Vehicle Roadways . Environ. Sci. Technol., , 39 : 826 – 836 .
- Middlebrook , A. M. , Murphy , D. M., and Thomson , D. S. 1998 . Observations of Organic Material in Individual Marine Particles at Cape Grim During the First Aerosol Characterization Experiment (ACE 1) . J. Geophys. Res. Atmos., , 103 : 16475 – 16483 .
- NIOSH . 1996 . NIOSH Manual of Analytical Methods , Cincinnati , OH : National Institute for Occupational Safety and Health .
- Pope , C. A. , Burnett , R. T. , Thun , M. J. , Calle , E. E. , Krewski , D. Ito , K. , . 2002 . Lung Cancer, Cardiopulmonary Mortality, and Long-Term Exposure to Fine Particulate Air Pollution . J. Am. Med. Assoc., , 287 : 1132 – 1141 .
- Pope , C. A., and Dockery , D. W. 2006 . Health Effects of Fine Particulate Air Pollution: Lines that Connect . J. Air Waste Manage., , 56 : 709 – 742 .
- Port . 2009 . Maritime Comprehensive Truck Management Program, Port of Oakland. Oakland , CA
- Samet , J. M. , Dominici , F. , Curriero , F. C. , Coursac , I. , and Zeger , S. L. 2000 . Fine Particulate Air Pollution and Mortality in 20 US Cities, 1987–1994 . N. Engl. J. Med., , 343 : 1742 – 1749 .
- Wu , J. , Houston , D. , Lurmann , F. , Ong , P. , and Winer , A. 2009 . Exposure of PM2.5 and EC from Diesel and Gasoline Vehicles in Communities Near the Ports of Los Angeles and Long Beach, California . Atmos. Environ., , 43 : 1962 – 1971 .