Abstract
The hygroscopic behavior of atmospheric aerosols complicates modeling and measurements of aerosol properties adding significant uncertainty to our best estimates of the direct effect aerosols exert on the radiative balance of the atmosphere. Airborne measurements of aerosol hygroscopicity are particularly challenging but critically needed. This motivated the development of a new system designed to measure the dependence of the aerosol light scattering coefficient (σ sp) on relative humidity (RH), known as f(RH), in real-time on an aerial platform.
The new instrument has several advantages over existing systems. It consists of three integrating nephelometers and humidity conditioners for simultaneous measurement of the σ sp at three different RHs. The humidity is directly controlled in exchanger cells without significant temperature disturbances and without particle dilution, heating, or loss of volatile compounds. The single-wavelength nephelometers are illuminated by LED-based light sources thereby minimizing heating of the sample stream. The flexible design of the RH conditioners, consisting of a number of specially designed exchanger cells (driers or humidifiers), enables us to measure f(RH) under hydration or dehydration conditions (always starting with the aerosol in a known state) with a simple system reconfiguration. These exchanger cells have been characterized for losses of particles using latex spheres and laboratory generated ammonium sulfate aerosols. The performance of this instrument has been assessed aboard DOE's G-1 research aircraft during test flights over California, Oregon, and Washington.
Copyright 2013 American Association for Aerosol Research
1 INTRODUCTION
The effects of atmospheric aerosols on the Earth's radiation budget have been studied, for almost four decades (Chylek and Coakley Citation1974; Twomey Citation1974) and the state of our knowledge has been documented by the IPCC in a series of Assessment Reports (AR). AR4 was published in 2007 (IPCC: Climate Change Citation2007) and AR5 is expected to be published in 2013.
A major complication in modeling and measurements of aerosols arises due to the hygroscopic behavior of the aerosols which adds significant uncertainty to our best estimates of the direct effect aerosols exert on the radiative balance of the atmosphere (Intergovernmental Panel on Climate Change [IPCC]: Climate Change Citation2007). The influence of the hygroscopicity on radiative forcing is not limited to aerosol scattering, but also includes changes in aerosol absorption and angular scattering properties (Markowicz et al. Citation2003; Andrews et al. Citation2006; Brem et al. Citation2012). In addition, aerosol hygroscopic properties are key inputs to optical closure studies, necessary to bring together various remote and in-situ measurements of physiochemical and/or optical properties of aerosols (Collins et al. Citation2000; Schmid et al. Citation2003, Citation2006). Such self-consistent data sets form the basis to test and improve the representation of optical properties in climate models. It should also be noted that aerosols, and their associated f(RH), affect visibility or visual air quality, a problem recognized and addressed in the 1977 Clean Air Act and subsequent legislation. These resulted in major efforts by the Interagency Monitoring of Protected Visual Environments (IMPROVE) program and extensive visibility related f(RH) studies are referenced in their program reports (e.g., http://vista.cira.colostate.edu/improve/Default.htm or Malm and Day Citation2001).
In general, the hygroscopic behavior of “simple” aerosols, especially those composed of inorganic salts, is reasonably well understood (Tang Citation1997; Seinfeld and Pandis Citation2006). In contrast, atmospheric aerosols are complicated mixtures of various (literally, hundreds) of components, organic/inorganic and soluble/insolute compounds (Rudich et al. Citation2007). Modeling and laboratory experiments inherently deal with a simplified subset of naturally occurring aerosols and conditions, hence the need for continued experimental field studies.
Aerosol water uptake and subsequent changes in aerosol properties have been studied in three categories: (1) change in size (Chan and Chan Citation2005), (2) light scattering enhancement (Covert et al. Citation1972; Fierz-Schmidhauser et al. Citation2010), and (3) change in physical and chemical properties, such as refractive index (Wang and Rood Citation2008). The current state of f(RH) studies pertaining to climate research is summarized nicely in Yan et al. (Citation2009).
There is some noteworthy confusion in terminology in the current literature: the term “humidity (or hygroscopic) growth function” has been applied to mean not only aerosol size change, but also to scattering enhancement (Hegg et al. Citation2002; Sheridan et al. Citation2002). We use the term “humidity growth function” to describe aerosol size change only. Here, we present a new instrument for scattering enhancement studies, and we therefore limit our discussion to only this topic.
The impact of humidity on aerosol light scattering has been traditionally studied with the help of humidigraphs or humidographs (Covert et al. Citation1972; Carrico et al. Citation2003; Hegg et al. Citation2008; Fierz-Schmidhauser et al. Citation2010) where one or several nephelometers combined with a humidity conditioning system measures the dependence of the aerosol scattering coefficient σ sp on relative humidity (RH). Several groups have extensively deployed humidigraphs on airborne platforms in numerous field campaigns; two central groups are noted here: the University of Washington (Hegg et al. Citation2008) and NOAA (Sheridan et al. Citation2012). Airborne measurements are usually performed with “fixed” humidity systems, where two or three nephelometers measure aerosol scattering at fixed RH levels (Hegg et al. Citation2002). Another common type of humidigraph is the dual nephelometer scanning system, where one nephelometer samples at a constant RH (usually below 40% or at ambient), while the humidity level in the second nephelometer is scanned through an expanded range, typically 40 to 85% (Andrews et al. Citation2006). Scanning humidigraph systems are not practical for airborne applications due to long scan times (normally tens of minutes), however, they can be used for offline analysis of airborne collected samples (Kotchenruther and Hobbs Citation1998).
For practical purposes, the dependence of aerosol light scattering on RH is represented in the form of a humidity enhancement function (or factor) ![]() , where RHdry is some low value (usually 10–45%), where σ
sp
(RHdry) is representative of “dry” scattering (e.g., the World Meteorological Organization recommends RH levels of 40% or below, WMO/GAW Citation2003). Other common way to parameterize the dependence of aerosol scattering on RH is through an aerosol hygroscopic exponent γ, defined in semi-empirical model σ
sp
(RH) = σ
sp
(RHdry)(1 − RH/100)− γ (Hegg et al. Citation1996; Kotchenruther and Hobbs Citation1998; following Kasten Citation1969).
, where RHdry is some low value (usually 10–45%), where σ
sp
(RHdry) is representative of “dry” scattering (e.g., the World Meteorological Organization recommends RH levels of 40% or below, WMO/GAW Citation2003). Other common way to parameterize the dependence of aerosol scattering on RH is through an aerosol hygroscopic exponent γ, defined in semi-empirical model σ
sp
(RH) = σ
sp
(RHdry)(1 − RH/100)− γ (Hegg et al. Citation1996; Kotchenruther and Hobbs Citation1998; following Kasten Citation1969).
At the moment, the hygroscopicity of aerosols can be measured only in situ and no remote, ground or space based, profiling technique has been developed. Airborne measurements of f(RH) are particularly challenging but critically needed as the hygroscopicity of aerosols aloft can be quite different from the hygroscopicity of aerosols measured at the surface. This motivated the development of a new instrument designed to measure f(RH) in real-time at a rapid rate (<10 s) on an aerial platform. In this article, we present the design and results for such a new humidigraph instrument developed for the DOE Atmospheric Radiation Measurement (ARM) Aerial Facility (AAF).
2. INSTRUMENTATION AND SYSTEM DESIGN
The AAF humidigraph or f(RH) instrument consists of three integrating nephelometers and three humidity conditioners with multiple humidity exchange cells. The instrument can be arranged in three basic configurations, as presented in :
FIG. 1 Schematic representation of three layouts of the f(RH) instrument: (a) efflorescence experiment, standard configuration; (b) deliquescence experiment; and (c) “parallel” configuration.
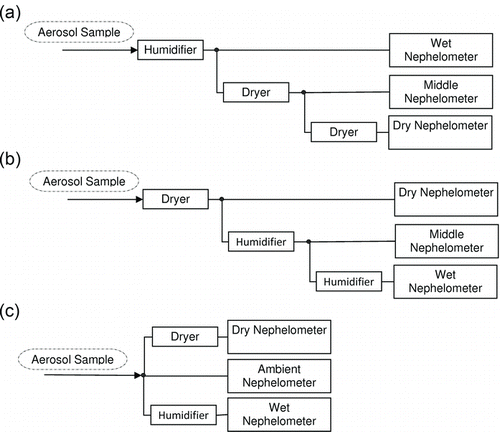
| a. | Efflorescence (dehydration) experiment: the default configuration. The sample is humidified above the deliquescence RH of most common atmospheric aerosol constituents, for example, ammonium sulfate or sodium chloride (Cziczo et al. Citation1997) and then dried in two steps. After each humidity exchanger, a portion of the aerosol sample is diverted to a designated nephelometer such that the instrument is measuring aerosol scattering at three consecutively decreasing RH levels. The scattering enhancement function can be assessed from these coupled measurements as discussed below. The evolution of the sample humidity and aerosol scattering as the air sample propagates through the system is schematically depicted in . FIG. 2 Idealized evolution of sample humidity (RH and mixing ratio), temperature, and aerosol light scattering in the humidigraph instrument configured for an efflorescence experiment. (a) Illustrates how a change in RH drives a change in scattering. (b) Represents the idealized evolution of sample temperature (T), relative humidity (RH), mixing ratio (MR), and scattering (σ sp ) as the sample propagates through the humidigraph. The aerosol sample enters the f(RH) instrument at some RH level (blue dot on (a) and “Ambient-Inlet” section on (b)), and upon passing though humidity exchangers, it is subjected to three humidity levels where a part of the sample is diverted to a corresponding nephelometer for light scattering measurements (blue circles on (a) and blue ×'s on (b)). The red dotted line on panel (a) depicts a model fit of f(RH). Note that the RH level at the humidigraph entry point may be quite different from ambient RH due to temperature and pressure changes in the aircraft inlet and inlet lines. 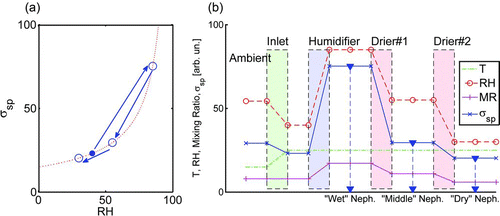 | ||||
| b. | Deliquescence (hydration) experiment. The sample is dried below the efflorescence RH of most common atmospheric aerosol constituents, and then it is humidified in two steps. After each humidity exchanger, a portion of aerosol sample is diverted to a nephelometer so that the instrument is measuring aerosol scattering at three consecutively increasing RH levels. | ||||
| c. | Parallel mode, with the sample split into three streams with one passed through a humidifier to the “wet” nephelometer, the second passed directly to the “ambient” nephelometer, and the third passed through a drier to the “dry” nephelometer. This is the simplest configuration and the format used in several airborne instruments (Hegg et al. Citation2002). This configuration seems to be suitable for ground deployments, where the temperature and RH of the sample can be, albeit with certain difficulty, preserved in the “ambient” branch; however, it is not ideal for airborne deployments where the sample conditions experience inevitable changes in the aircraft inlet and inlet lines. | ||||
These three configurations cover three practical ways to measure the dependence of aerosol scattering on RH with a “fixed” humidity system: the first two allow a means of measuring aerosol optical properties independent of its ambient “wetness” state; both bring the sample to a known the initial state (“wet” or “dry”) and provide an approximation of f(RH) for the sample. The third configuration is designed to observe the results on scattering if RH is changed (both increased and decreased) and provide an f(RH) estimation for the sample in its initial “ambient” state. A strength of this new instrument is that the configuration can be selected based on the platform, scientific needs, and anticipated local conditions.
Optical measurements, performed after each humidity conditioner, provide a set of three scattering coefficients at three different RHs. These scattering coefficients can be fit to a well-known semi-empirical models with either two (Hegg et al. Citation1996) or three parameters (Kotchenruther and Hobbs Citation1998):
Both equations share a similar physical interpretation: the first parameter, A or k, represents scattering at a dry condition. When the fitting parameters (A, B, and C or k and γ) are determined, f(RH) can be estimated from either equation. The advantage of Equation (1b) is its simplicity: it is a single-value parameterization of hygroscopicity (γ); however, at higher humidity it leads to infinite scattering and has been found to perform poorly in some conditions (Kotchenruther and Hobbs Citation1998).
Historically, when f(RH) was measured with just two single RH (a “wet” and a “dry”) nephelometers, it was reported in the form of a single-point approximation (or scattering factor) ![]() with the hidden assumption that σ
sp
(RHdry)≈σ
sp
(0). It should be noted that different authors used various reference RHs, ranging from 10 to 45% for the “dry” value, and 62 to 90% for the “wet” value (Kotchenruther and Hobbs Citation1998; Sheridan et al. Citation2002; Howell et al. Citation2006; Fierz-Schmidhauser et al. Citation2010), which makes direct comparison of the results difficult and/or confusing. The scattering factor F can also be assessed from the two or three parameter fit (Equation (1)); here, we will base our assessment of F on the most frequently used “dry” and “wet” RH values of 40 and 85% respectively, and the three parameter model:
with the hidden assumption that σ
sp
(RHdry)≈σ
sp
(0). It should be noted that different authors used various reference RHs, ranging from 10 to 45% for the “dry” value, and 62 to 90% for the “wet” value (Kotchenruther and Hobbs Citation1998; Sheridan et al. Citation2002; Howell et al. Citation2006; Fierz-Schmidhauser et al. Citation2010), which makes direct comparison of the results difficult and/or confusing. The scattering factor F can also be assessed from the two or three parameter fit (Equation (1)); here, we will base our assessment of F on the most frequently used “dry” and “wet” RH values of 40 and 85% respectively, and the three parameter model:
A humidigraph system based on measurements at three RH values allows more relaxed requirements on RH. Exact RH values are not crucial so long as they are reasonably stable and separated far enough to provide a solid base for the parameter fit (i.e., spaced to allow for interpretation of the idealized curve in ).
The AAF f(RH) instrument utilizes three 525-nm single-wavelength integrating nephelometers (Aurora 100, Ecotech). The nephelometers are operated at a flow rate of 5 lpm. In-cavity pressure, temperature, and humidity sensors provide aerosol state data. All three nephelometers are checked/calibrated with “zero” air and a span gas (CO2 and/or SF6). The zero check is performed at the start and end of each flight. The span checks are run at least once a week depending on the performance of the nephelometers and stability of the zero runs. Three point checks (zero air, CO2 and SF6) are used to obtain the highest possible precision and accuracy of the measurements. Based on the three point calibration checks, a separate offset and factor corrections are applied in each of these nephelometers. Note that the Aurora nephelometers utilize a LED light source with improved angular intensity and integration characteristics (Müller et al. Citation2011). LED-based light sources do not increase the sample temperature and thus do not affect the RH of the sample air, which has been a common problem in humidigraph systems using nephelometers with incandescent light sources (Fierz-Schmidhauser et al. Citation2010).
A key element of the current f(RH) instrument is the set of humidity exchanger cells. The cell design is based on Nafion membrane technology (Perma Pure LLC). Nafion, a Teflon based ionic polymer, is selectively and highly permeable to water. Water transfer through the Nafion membrane occurs as absorption on the high humidity side, transport though ionic channels, and evaporation on the low humidity side (details on Nafion can be found elsewhere; Ye and LeVan Citation2003, Mauritz and Moore Citation2004).
All the humidity exchanger cells share the same design, they are fully interchangeable, and can function in humidifier or drier capacity. The sample aerosol is passed through a 1.5-cm ID Nafion tube enclosed in an outer stainless steel jacket. In the humidifier mode, the space inside the jacket is filled with pure water. The water is circulated at a controlled flow rate by a small pump between the cell and an overfill bottle to keep the water temperature stable and counteract evaporative cooling that takes place on the inner side of the Nafion tube. When the cell is used in the drier mode a sheath flow of dry air passes through the jacket in a direction counter to the sample flow. The water vapor pressure difference across the Nafion walls drives water vapor out of the sample into the sheath flow.
The humidity exchangers consist of two cells with a total of 96 cm of “exposed” Nafion tube which is sufficient to increase the sample humidity from ∼0 to 85% for temperatures below 32°C and a flow rate of 15 lpm (the maximum sample flow in the instrument). In the dryer mode, the two-cell exchanger is capable of lowering the humidity of the sample from 85 to ∼55% (or from 60 to 30%). If required, the instrument can be equipped with additional cells to enhance performance of a humidity exchanger although this heretofore has not been necessary.
FIG. 3 MABL and CABL, San Francisco, CA, area. MABL fight leg (below 400-m ASL) is marked by the red rectangle; averaged scattering factor is F = 2.85 ± 0.05. Blue rectangle marks descent through the CABL from 700-m ASL; F = 2.31 ± 0.11.
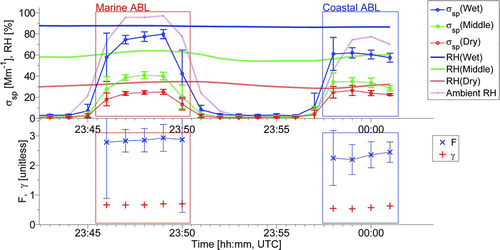
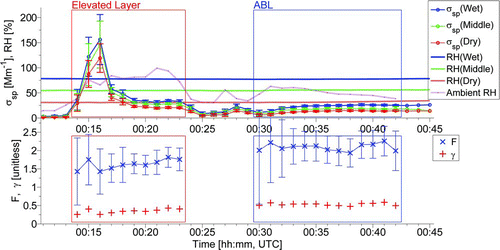
FIG. 4 Elevated aerosol layer over southern Washington state at an altitude of 2.6-km ASL (red rectangle); averaged scattering factor is F = 1.62 ± 0.13. The blue rectangle marks descent through ABL from 1.9-km ASL; F = 2.09 ± 0.01.
It is expected that some particle loss may occur in the exchanger cells via sedimentation and diffusion. The Nafion tube inside a cell is prevented from collapsing by a rigid stainless steel structure (a wire-mesh tube or a coil with supporting rods), which along with a stainless steel outer jacket helps minimize electrostatic deposition and particle loss on the dielectric Nafion surface. We have estimated the effect of this loss on light scattering in a series of experiments with monodisperse and polydisperse distributions of laboratory aerosols (polystyrene latex spheres and ammonium sulfate, respectively). The highest loss rate after a humidity exchanger, ∼3%, was found for the maximum sample flow of 15 lpm after the first exchanger in deliquescence or efflorescence configuration. The loss rate after subsequent exchangers was smaller due to lower flow rates (10 and 5 lmp), within the errors of the measurement, and thus was not quantified further (see details in the online supplemental information).
The humidity exchange cells and subsequent tubing provide exposure time of 6–9 s which is sufficient for most aerosol particles to achieve humidity equilibrium with surrounding air (Chuang Citation2003; Chan and Chan Citation2005); additional exchangers or line sections could be used to increase exposure time.
This new f(RH) instrument has two distinct features which have not been commonly implemented in earlier designs: (1) “pre-conditioning” of the sample to the highest or lowest humidity level to ensure that the experiment is following a known branch (deliquescence or efflorescence); and (2) direct control of the RH via water vapor transfer to/from the sample, rather than through sample temperature manipulation or dilution, which helps to preserve volatile components. Losses of nitrates and other volatiles due to sample heating may result in substantial underestimation of the aerosol scattering, estimated as high as 20–40% (Dougle and ten Brink Citation1996; Bergin et al. Citation1997; ten Brink et al. Citation2000).
3. OBSERVATIONS
Initial test flights with the new f(RH) instrument were performed aboard the AAF G-1 research aircraft during August, 2011 in a diverse set of altitude and ambient conditions over Washington, Oregon, and California.
As a limited illustration of instrument performance, we present data obtained in two test fights, one over California (San Francisco area) and the other in southern Washington state. The G-1 research aircraft simultaneously carried a suite of meteorological, radiation, and aerosol instrumentation, including a passive cavity aerosol spectrometer probe (PCASP, Droplet Measurement Technologies) used as ancillary data.
The f(RH) instrument was configured in the aforementioned efflorescence mode shown in . The data were processed in the following sequence:
| • | Introduce time shifts to compensate for the variable residence time in the humidity exchanger cells and lines and for delays with respect to the exterior probes. To establish appropriate time shifts, we have chosen several sections of time series that contain a characteristic signature of an event (e.g., penetration of an aerosol layer or a cloud, burst of turbulence, etc.). The time shifts were defined by the maximum of the cross-covariance function calculated for each nephelometer and an exterior probe (e.g., PCASP). | ||||
| • | Average the data over a common time base (typically 1 min); | ||||
| • | Apply the most recent calibration corrections to the scattering; | ||||
| • | Apply correction for nonideal angular illumination and truncation in the nephelometers (so-called “truncation correction”; Anderson and Ogren Citation1998 and Müller et al. Citation2011); | ||||
| • | Adjust light scattering values for particle loss in the humidity cells (described previously); | ||||
| • | Flag and remove cases where relation | ||||
| • | Fit data in semi-empirical model Equation (1b) to obtain the γ parameter, and to EquationEquation (1a) to obtain the f(RH) function, and calculate the scattering factor F according to EquationEquation (2); currently, an uncertainty of 1-min values of F and γ parameters are estimated by simple mean square root of relative errors of all values involved (so called “variance addition rule”; NASA handbook Citation2010). | ||||
Note that the truncation correction depends on the aerosol size distribution, which depends on RH. As an approximation, we used the aerosol size distribution measured by the PCASP to obtain a volume mean diameter (VMD) which we assumed was dry, since the PCASP probe was operated with the inlet heater switched on, and this was extrapolated to estimate VMD at the other RH levels used in the f(RH) instrument. The scattering in general is proportional to VMD2, hence correction to VMD should be proportional to the square root of the ratio of scattering at two RH levels. The truncation correction coefficient is found from the humidity corrected VMD using the empirical relation for the Aurora nephelometers given by Müller et al. (Citation2011). It should also be noted that the truncation correction has only a minor impact on f(RH) since f(RH) depends on a relative change of scattering with humidity rather than on an absolute value of σ sp .
3.1. Observation in the Marine and Coastal Atmospheric Boundary Layers
presents a time series of data collected in a test flight in the Marine Atmospheric Boundary Layer (MABL) several kilometers off the California coast and in the Coastal Atmospheric Boundary Layer (CABL) about 30 km inland from the shore in the San Francisco Bay area. The figure shows time traces of the three σ sp and RH values in the f(RH) instrument along with ambient RH; vertical bars on σ sp depict one standard deviation of 1 min averaged values. The lower panel shows time traces of F and γ parameters; the vertical bars on F present uncertainty of 1-min estimates. The performance of the humidity control deserves a comment: in spite of significant changes in ambient temperature and RH, the RH variation in the nephelomenters is within 6%. A red rectangle marks the flight leg over ocean below 400-m ASL, well within the MABL. For this leg, the average γ parameter is 0.68 ± 0.02 and the scattering factor is F = 2.85 ± 0.05, which is at the upper end of reported values for aerosol scattering factors measured over ocean: 1.1 to 3.2 (Hegg et al. Citation1996; McInnes et al. Citation1998; Sheridan et al. Citation2002; Carrico et al. Citation2003). A blue rectangle in marks the descent though the CABL from its top around 700-m ASL. Values of F = 2.31 ± 0.11 and γ = 0.57 ± 0.04 are higher than usually reported for in-land sites, but agree well with F values reported for polluted marine aerosol (Carrico et al. Citation2003). It should be noted that the value of the scattering factor F strongly depends on the reference RH used to calculate or measure it and on other sampling parameters (e.g., size selection with an upstream impactor), so a direct comparison of F values obtained under different conditions could be misleading. Statistics of 1-min data is presented in the online supplemental information, Table S2.
3.2. Observations of an Elevated Aerosol Layer and in the Continental Atmospheric Boundary Layer
An elevated aerosol layer was observed over the southern part of Washington state at an altitude of 2.6-km ASL. , similar to , presents time traces of the main parameters of interest. The flight leg through the layer is marked with a red rectangle in . The layer had an apparent thickness of about 250 m and a horizontal extent of more than 90 km. The horizontal structure exhibited aerosol scattering varying from single digits to well above 100 Mm−1 and then reducing to values of several tens of Mm−1. The layer was also characterized by an increase in RH from 15 to 65–95%, which may suggest that the aerosol layer was a remnant from an evaporated cloud. A relatively low scattering factor F = 1.62 ± 0.13 and a γ parameter of 0.35 ± 0.06 were observed within the layer. These values are smaller than the scattering factor F = 2.09 ± 0.1 and γ = 0.53 ± 0.03 measured on approach and landing in the semi-arid location in southeast Washington. The blue rectangle in marks the descent though the ABL from its top at 1.9-km ASL. Statistics of 1-min data is presented in the online supplemental information, Table S2.
4. CONCLUSIONS
We present here a new airborne humidigraph instrument designed for the DOE ARM AAF. This humidigraph continuously measures aerosol light scattering in controlled humidity environments with three integrating nephelometers. Measurements of the light scattering at the three distinct RH levels allows estimation of the scattering enhancement function f(RH) and aerosol light scattering at any RH. Humidity is directly controlled with exchanger cells, without particle dilution, and without temperature disturbances or loss of volatile components. Residence time of 6–9 s in the exchangers and following lines is sufficient for most aerosols to attain an equilibrium state. Both efflorescence and deliquescence experiments can be performed with a simple system reconfiguration. The first humidity exchanger cell works as a “preconditioner” to ensure that the sample aerosol is in a known state, high or low humidity, according to the chosen scenario. Instrument tests performed in a series of flights of the AAF G-1 research aircraft showed that the instrument can sustain the required humidity levels under a diverse set of conditions and altitudes. Data obtained in the test flights in marine, coastal, and continental ABL are consistent with literature values.
Future work includes efforts to (1) increase the accuracy of light scattering measurements for reliable determination of f(RH) under the low aerosol loading typical of the free troposphere or pristine locations; (2) implement a correction for nonideal angular illumination and truncation in the nephelometers that does not rely on other sensors data (e.g., aerosol size distribution); and (3) improve humidification performance and stability with active control of the water temperature and circulation rate in the humidifier cells.
Supplemental File.zip
Download Zip (77 KB)Acknowledgments
The authors would like to thank Nels Laulainen (PNNL), David Covert (UW), and Patrick Sheridan (NOAA) for extensive technical discussions; the flight and ground crew of the G-1 research aircraft for support and flight execution. We also would like to acknowledge the thorough and thought-provoking reviews of two anonymous reviewers, which have significantly improved this article. Financial support for the design and development of this instrument was provided by the American Recovery and Reinvestment Act through the US Department of Energy's Atmospheric Radiation Measurement Program.
[Supplementary materials are available for this article. Go to the publisher's online edition of Aerosol Science and Technology to view the free supplementary files.]
REFERENCES
- Anderson , T. L. and Ogren , J. A. 1998 . Determining Aerosol Radiative Properties Using the TSI 3563 Integrating Nephelometer . Aerosol Sci. Technol. , 29( ( 1 ) : 57 – 69 .
- Andrews , E. , Sheridan , P. J. , Fiebig , M. , McComiskey , A. , Ogren , J. A. Arnott , P. 2006 . Comparison of Methods for Deriving Aerosol Asymmetry Parameter . J. Geophys. Res. , 111 : D05S04 doi: 10.1029/2004JD005734
- Bergin , M. H. , Ogren , J. A. , Schwartz , S. E. and McInnnes , L. M. 1997 . Evaporation of Ammonium Nitrate in a Heated Nephelometer; Implications for Field Measurements . Environ. Sci. Technol. , 31 : 2878 – 2883 .
- Brem , B. T. , Mena Gonzalez , F. C. , Meyers , S. R. , Bond , T. C. and Rood , M. J. 2012 . Laboratory-Measured Optical Properties of Inorganic and Organic Aerosols at Relative Humidities up to 95% . Aerosol Sci. Technol. , 46 : 178 – 190 .
- Carrico , C. M. , Kus , P. , Rood , M. J. , Quinn , P. K. and Bates , T. S. 2003 . Mixtures of Pollution, Dust, Sea Salt, and Volcanic Aerosol During ACE-Asia: Radiative Properties as a Function of Relative Humidity . J. Geophys. Res. , 108 ( D23 ) : 8650 doi: 10.1029/2003JD003405
- Chan , M. N. and Chan , C. K. 2005 . Mass Transfer Effects in Hygroscopic Measurements of Aerosol Particles . Atmos. Chem. Phys. , 5 : 2703 – 2712 . doi: 10.5194/acp-5-2703-2005
- Chuang , P. Y. 2003 . Measurement of the Timescale of Hygroscopic Growth for Atmospheric Aerosols . J. Geophys. Res. , 108 ( D9 ) : 4282 doi: 10.1029/2002JD002757
- Chylek , P. and Coakley , J. A. Jr . 1974 . Aerosol and Climate . Science , 183 : 75 – 77 .
- Collins , D. R. , Jonsson , H. H. , Seinfeld , J. H. , Flagan , R. C. , Gassó , S. Hegg , D. A. 2000 . In Situ Aerosol Size Distributions and Clear Column Radiative Closure During ACE-2 . Tellus , B 52 : 498 – 525 .
- Covert , D. S. , Charlson , R. J. and Ahlquist , N. C. 1972 . A Study of the Relationship of Chemical Composition and Humidity to Light Scattering by Aerosol . J. Appl. Meteor , 11 : 968 – 976 .
- Cziczo , D. J. , Nowak , J. B. , Hu , J. H. and Abbatt , J. P. D. 1997 . Infrared Spectroscopy of Model Tropospheric Aerosols as a Function of Relative Humidity: Observations of Deliquescence and Crystallization . J. Geophys. Res. , 102 ( 18 ) : 843
- Dougle , P. G. and ten Brink , H. M. 1996 . Evaporative Losses of Ammonium Nitrate in Nephelometry and Impactor Measurements . J. of Aerosol Sci. , 27 ( Suppl. 1 ) : S511 – S512 .
- Fierz-Schmidhauser , R. , Zieger , P. , Wehrle , G. , Jefferson , A. , Ogren , J. A. Baltensperger , U. 2010 . Measurement of Relative Humidity Dependent Light Scattering of Aerosols . Atmos. Meas. Tech. , 3 : 39 – 50 .
- Hegg , D. A. , Covert , D. S. , Crahan , K. and Jonssen , H. 2002 . The Dependence of Aerosol Light-Scattering on RH Over the Pacific Ocean . Geophys. Res. Lett. , 29 ( 8 ) : 1219 doi: 10.1029/2001GL014495
- Hegg , D. A. , Covert , D. S. and Jonssond , H. H. 2008 . Measurements of Size-Resolved Hygroscopicity in the California Coastal Zone . Atmos. Chem. Phys. , 8 : 7193 – 7203 .
- Hegg , D. A. , Covert , D. S. , Rood , M. J. and Hobbs , P. V. 1996 . Measurements of Aerosol Optical Properties in Marine Air . J. Geophys. Res. , 101 ( D8 ) : 12, 893 – 12, 903 .
- Howell , S. G. , Clarke , A. D. , Shinozuka , Y. , Kapustin , V. , McNaughton , C. S. Huebert , B. J. 2006 . Influence of Relative Humidity Upon Pollution and Dust During ACE-Asia: Size Distributions and Implications for Optical Properties . J. Geophys. Res. , 111 : D06205 doi: 10.1029/2004JD005759
- IPCC: Climate Change . 2007 . “ Contribution of Working Group I to the Fourth Assessment Report of the Intergovernmental Panel on Climate Change ” . In The Physical Science Basis , Edited by: Solomon , S. Cambridge, UK, and New York : Cambridge Univ. Press .
- Kasten , F. 1969 . Visibility in the Phase of Pre-Condensation . Tellus , 21 : 631 – 635 .
- Kotchenruther , R. and Hobbs , P. V. 1998 . Humidification Factors of Aerosols from Biomass Burning in Brazil . J. Geophys. Res. , 103 : 32,081 – 32,090 .
- Malm , W. C. and Day , D. E. 2001 . Estimates of Aerosol Species Scattering Characteristics as a Function of Relative Humidity . Atmospheric Environment , 35 : 2845 – 2860 .
- Markowicz , K. M. , Flatau , P. J. , Quinn , P. K. , Carrico , C. M. , Flatau , M. K. Vogelmann , A. M. 2003 . Influence of Relative Humidity on Aerosol Radiative Forcing: An ACE-Asia Experiment Perspective . J. Geophys. Res. , 108 ( D23 ) : 8662 doi: 10.1029/2002JD003066
- Mauritz , K. A. and Moore , R. B. 2004 . State of Understanding of Nafion . Chem. Rev. , 104 : 4535 – 4585 . , 2004
- McInnes , L. , Bergin , M. , Orgen , J. and Schwartz , S. 1998 . Apportionment of Light Scattering and Hygroscopic Growth to Aerosol Composition . Geophys. Res. Lett. , 26 ( 4 ) : 513 – 516 . doi: 10.1029/98GL00127
- Müller , T. , Laborde , M. , Kassell , G. and Wiedensohler , A. 2011 . Design and Performance of a Three-Wavelength LED-Based Total Scatter and Backscatter Integrating Nephelometer . Atmos. Meas. Tech. , 4 : 1291 – 1303 . doi: 10.5194/amt-4–1291-2011
- NASA handbook . 2010 . 20546 Washington , DC : National Aeronautics and Space Administration . Measurement Uncertainty Analysis Principles and Methods. NASA Measurement Quality Assurance Handbook – ANNEX 3, NASA-HDBK-8739.19–3
- Rudich , Y. , Donahue , N. M. and Mentel , T. F. 2007 . Aging of Organic Aerosol: Bridging the Gap Between Laboratory and Field Studies . Ann. Rev. Phys. Chem. , 58 : 321 – 352 .
- Schmid , B. , Ferrare , R. , Flynn , C. , Elleman , R. , Covert , D. Strawa , A. 2006 . How Well Do State-of-the-Art Techniques Measuring the Vertical Profile of Tropospheric Aerosol Extinction Compare? . J. Geophys. Res. , 111 : D05S07 doi: 10.1029/2005JD005837
- Schmid , B. , Hegg , D. A. , Wang , J. , Bates , D. , Redemann , J. Russell , P. B. 2003 . Column Closure Studies of Lower Tropospheric Aerosol and Water Vapor During ACE-Asia Using Airborne Sunphotometer, Airborne in-situ and Ship-Based Lidar Measurements . J. Geophys. Res. , 108 ( D23 ) : 8656 doi: 10.1029/2002JD003361
- Seinfeld , J. H. and Pandis , S. N. 2006 . Atmospheric Chemistry and Physics–from Air Pollution to Climate Change , New York : John Wiley & Sons . 2nd ed.
- Sheridan , P. J. , Andrews , E. , Ogren , J. A. , Tackett , J. L. and Winker , D. M. 2012 . Vertical Profiles of Aerosol Optical Properties Over Central Illinois and Comparison with Surface and Satellite Measurements . Atmos. Chem. Phys. Discuss. , 12 : 17187 – 17244 . doi: 10.5194/acpd-12–17187-2012
- Sheridan , P. J. , Jefferson , A. and Ogren , J. A. 2002 . Spatial Variability of Submicrometer Aerosol Radiative Properties Over the Indian Ocean During INDOEX . J. Geophys. Res. , 107 : 8011 doi: 10.1029/2000JD000166
- Tang , I. N. 1997 . Thermodynamic and Optical Properties of Mixed-Salt Aerosols of Atmospheric Importance . J. Geophys. Res. , 102 ( D2 ) : 1883 – 1893 . doi: 10.1029/96JD03085
- ten Brink , H. M. , Khlystov , A. , Kos , G. P. A. , Tuch , T. , Roth , C. and Kreyling , W. 2000 . A High-Flow Humidograph for Testing the Water Uptake by Ambient Aerosol . Atmos. Environ. , 34 : 4291 – 4300 .
- Twomey , S. A. 1974 . Pollution and the Planetary Albedo . Atmos. Environ. , 8 : 1251 – 1256 .
- Wang , W. and Rood , M. J. 2008 . Real Refractive Index: Dependence on Relative Humidity and Solute Composition with Relevancy to Atmospheric Aerosol Particles . J. Geophys. Res. , 113 : D23305 doi: 10.1029/2008JD010165
- WMO/GAW . 2003 . Aerosol Measurement Procedures Guidelines and Recommendations , Geneva , , Switzerland : World Meteorological Organization Global Atmosphere Watch .
- Yan , P. , Pan , X. , Tang , J. , Zhou , X. , Zhang , R. and Zeng , L. 2009 . Hygroscopic Growth of Aerosol Scattering Coefficient: A Comparative Analysis between Urban and Suburban Sites at Winter in Beijing . Particuology , 7 : 52 – 60 . ISSN 1674–2001, 10.1016/j.partic.2008.11.009
- Ye , X. H. and LeVan , M. D. 2003 . Water Transport Properties of Nafion Membranes. Part I. Single-Tube Membrane Module for Air Drying . J. Membr. Sci. , 221 ( 1–2 ) : 147 – 161 .