Abstract
The Institute for Clean Energy Technology (ICET) at Mississippi State University (MSU) has developed testing capabilities for evaluating the American Society of Mechanical Engineers (ASME) Code on Nuclear Air and Gas Treatment (AG-1) section FK radial flow HEPA filters. These high efficiency particulate air (HEPA) filters are typically used at sites within the DOE complex to control particulate matter emissions. The goal of this testing was to provide information related to the performance of radial flow HEPA filters that use dimple pleat separators. Prior to this testing, insufficient data were available to determine the lifecycle performance of these filters. Two different types of dimple pleated radial flow HEPA filters were tested: a safe change design and a remote change design. Filters were tested at both ambient and elevated conditions of temperature and relative humidity. The challenge aerosols were Alumina (Al(OH)3), Carbon black, and Arizona road dust. The performance of these filters at ambient conditions was determined by the filters’ mass loading capacity and filtering efficiency. Elevated condition performance was evaluated by the filters’ resistance to elevated temperature and relative humidity. The results indicated that the challenge aerosol had a large impact on the total loading capacity of the filters. Testing at elevated conditions of temperature and relative humidity revealed an issue with the strength of the dimple pleats. The dimples softened when challenged with elevated conditions, which led to filter failure due to a cascading reduction in free flow area and increase in differential pressure.
Copyright 2013 American Association for Aerosol Research
INTRODUCTION
Containment ventilation systems typically require the use of high efficiency particulate air (HEPA) filters. These systems are used in processes involving the management or treatment of radioactive materials. Facilities within the U.S. Department of Energy (DOE) complex are particularly likely to make use of HEPA filters in processing hazardous waste exhaust gases prior to release into the environment.
Radial Flow HEPA Filter for Nuclear Applications
The DOE Nuclear Air Cleaning Handbook (DOE Citation2003) designates that all air filtration systems for waste treatment facilities, such as filtration systems within the DOE Complex, must comply with the American Society of Mechanical Engineers (ASME) Code on Nuclear Air and Gas Treatment (ASME Citation2009). This standard is comprised of multiple sections designating design and testing criteria for air and gas treatment for nuclear applications. The AG-1 standard outlines very specific qualification procedures. For a filter to be used within the DOE complex, it must be qualified and pass certification at a filter test facility (FTF). The qualification procedures can be found in the AG-1 standard.
The primary filter of choice within the DOE complex has historically been the AG-1 Section FC axial flow unit. The most common are the square, deep pleated, axial flow filters with metal separators. These axial flow filters are proficient at providing good filtering efficiencies and dust loading capacities, but they present other issues with handling and disposal. Radial units provide benefits in remote handling, ease of sealing, disposal, compaction, reduction of sharp edges, and retention of particulates during handling (Steward Citation1987). Radial flow filters have been studied in the UK (Loughborough Citation1990; Kuile and Doig Citation1998). Section FK was added to AG-1 to address special types of HEPA filters. One of the special HEPA filters discussed in Section FK was the radial flow circular filter. Some European loading data for these types of filters are available from Loughborough (Citation1990).
In the month of May, 1999, the Defense Nuclear Facilities Safety Board (DNFSB) released Technical Report 23 entitled HEPA Filters Used in the Department of Energy's Hazardous Facilities (DNFSB Citation1999). This report expressed concerns for the potential vulnerability of HEPA filters used in vital safety systems. This document addressed that not every filter was tested at an FTF to ensure it met specifications. Another issue was the decommissioning of FTF facilities. The other main points addressed in this document were the need for a Qualified Products List (QPL) test laboratory, and the problems associated with filter wetting, aging, radiation induced degradation, and by-pass leakage consideration. Later that same year, the DOE initiated a response to the DNFSB's Recommendation 20002 (DNFSB Citation2000) by implementing measures with regard to 100% quality assurance testing of HEPA filters and a review of vital safety systems in general. The DOE's actions in this matter were also timely with regard to concerns being voiced by citizen groups over the performance of HEPA filters and how their functional status is monitored. Of particular concern are the threats to HEPA filter performance posed by water and smoke. DOE Standard 1066, titled Fire Protection Design Criteria (DOE Citation1999), explains the measures and considerations to limit or prevent damage due to fire and smoke. Upset conditions, such as those during a fire, need to be evaluated and the performance of the HEPA filter quantified.
Current Testing
Testing activities on radial flow HEPA filters were performed at the Institute for Clean Energy Technology (ICET) at Mississippi State University (MSU) to evaluate lifetime performance of AG-1 Section FK representative radial flow HEPA filters under ambient and elevated conditions. This testing occurred from 2010 to 2011. These filters are only representative AG-1 units. This document examines two filter designs, remote change and safe change, under two different challenge conditions, ambient and elevated. Testing under elevated conditions has been studied in Joubert et al. (Citation2010) and Miguel (Citation2003), and under supersaturated conditions in Ricketts et al. (Citation1987, Citation1989).
The ambient condition testing consisted of evaluating nine filters. Three filters were challenged by each of three aerosols. The ambient conditions consisted of 15.6–26.7°C (60–80°F) and 40–60% relative humidity (RH). These filters were loaded with aerosol until the filter reached a differential pressure of 12.5 kPa (50 in. w.c.) or ruptured.
Elevated condition testing began with the evaluation of three filters challenged with an aerosol up to 1 kPa (4 in. w.c) of differential pressure across the filter under ambient conditions. The aerosol challenge was then discontinued and the performance of the filters was examined under elevated temperature, 54.4°C (130°F) for a period of 1 h. Following the increase in temperature, water spray was added to incrementally increase the RH to 95% or greater.
Test Stand
Numerous filter test stands have been described in literature; however, most only examine a limited range of filter performance parameters. This test stand is designed to assess the performance of a filter over a complete loading lifecycle. To fully examine a filter from a safety perspective, lifecycle loading data is required—particularly the effect of challenge aerosol particle size, challenge with elevated temperature, or challenge with high levels of RH. Test stands have been constructed to study flat sheet media (Lee and Liu Citation1982; Endo et al. Citation1998; Lee et al. Citation2001), pleated media filters (Loughborough Citation1990; Fabbro et al. Citation2002), and humidity effects on the loading capacity (Gupta et al. Citation1993). The majority of test stands only examine flat sheet media or axial flow filters and rarely examine radial flow filters.
This test stand utilizes a fan capable of producing differential pressures of 12.5 kPa (50 in. w.c.) at volumetric air flow rates up to 113.3 m3/min (4000 CFM). The radial flow filter housing is capable of testing two filters at 113.3 m3/min (4000 CFM) or one filter at 56.63 m3/min (2000 CFM). Currently, only one filter is being tested at a time. A blind is used in place of a second filter in the housing. Further information pertaining to the design, construction, and characterization activities for the test stand used during this testing is available from Giffin et al. (Citation2012). Pictures of the test stand can be found in the online supplemental material.
Testing Parameters
A total of nine radial flow filters are tested at 56.63 m3/min (2000 SCFM) under ambient conditions. Six tests are performed on the remote change filter design, two tests with each of the three challenge aerosols. The safe change design filters are tested once with each of the challenge aerosols. The elevated conditions testing activities evaluate the filter performance of three filters: two remote change and one safe change. The initial phase is loading the filter, using powdered Al(OH)3, to the filter's change-out differential pressure of 1 kPa (4 in. w.c.). The second phase is to challenge the filter without an aerosol under conditions at elevated temperature, 54.4°C (130°F), for a period of 1 h, and then incrementally increase the RH up to 95%. Test matrices are available in the online supplemental material.
Test Filter Designs
Both filter designs were constructed of non-woven Boron silicate microfiber. The filter packs for both filters are approximately 7.62 cm (3 in.) deep. The two filter designs differ in the location of sealing surface. Remote change radial flow filters are designed to be remotely installed into a housing vertically using a crane. This remote installation is facilitated by a grab ring located around the circumference of the filter annulus and a gel seal gasket on the underside of the filter end cap. The safe change radial flow filter is designed for bag-in/bag-out horizontal installation into its housing. The safe change also utilizes a gel seal, but the sealing surface is located on the face of the filter end cap. The filters were also modified by replacing the gel seal with a neoprene gasket to allow for the filters’ initial and final mass to be obtained accurately. displays the filter pack design parameters. Pictures of the test filters are available in the online supplemental material.
Table 1 TABLE 1 Filter pack design parameters for the safe change and remote change filter types
Test Aerosols
Three different challenge aerosols were used to represent loading by differently sized particles. All aerosols are dry powders generated using a powder feeder and compressed air critical orifice nozzle. The first aerosol is Carbon black, provided by CANCARB Limited of Medicine Hat, Alberta, Canada. This powder has a mass median diameter (MMD) of 1.2 to 2.0 μm and represents loading by soot. Loughborough (Citation1990) at the AEA Harwell Laboratory in the UK has conducted tests using this aerosol. The next aerosol is Alumina, Al(OH)3 (Almatis Spacerite S-11), purchased from Brenntag Specialties, Inc., in South Planfield, NJ. This aerosol has an MMD of 0.8 μm and is used to represent loading by small particles. Al(OH)3 has previously been used in filter loading tests by Endo et al. (Citation1998)and Lee et al. (Citation2001). The final aerosol used is Arizona Road Dust (A1 Ultrafine, ISO 12103-1) purchased from Powder Technology, Inc., of Burnsville, MN. This test dust is used to represent loading by large particles as it has an MMD of 5.0 μm. The particle size distributions (PSD) of the three challenge aerosols are presented in .
Aerosol Measurement Instrumentation
The primary aerosol measurement instruments used on the large-scale test stand are the aerodynamic particle spectrometer (APS), scanning mobility particle sizer (SMPS), and a laser aerosol spectrometer (LAS). The APS, SMPS, and LAS are products of TSI, Inc., of Shoreview, MN. The APS is a time of flight measurement device that measures the aerodynamic diameter and light-scattering intensity of aerosol particles as described by Chen et al. (Citation1985) and Peters et al. (Citation1993). The SMPS consists of a TSI Model 3080 electrostatic classifier (EC), a TSI Model 3081 differential mobility analyzer (DMA), and a TSI Model 3775 condensation particle counter (CPC). The LAS operates based on the principle that the degree of light scattering is dependent on the size of the aerosol particle. More information on the above instruments is available in Baron and Willeke (Citation2005).
RESULTS
Ambient Condition Testing Results
The filter data discussed below were obtained from the evaluation of both remote change and safe change filters designed to meet AG-1 Section FK qualification requirements. These filters were manufactured by Flanders, Inc. (Washington, NC). All filters were inspected at the Air Techniques International (ATI) FTF in Baltimore, MD, to verify production quality, initial pressure drop, and filtering efficiency. In-testing images can be found in the online supplemental material.
Mass Loading Curves
Mass loading curves display the mass loading (grams) versus differential pressure (kPa) across the filter. Mass loading curves are critical to evaluating filter performance because they give an indication of not only how much material a filter can hold, but also the variability in the differential pressure increase at different stages of loading. shows the mass loading for all nine filters tested under ambient conditions. The plot illustrates a change in slope as the filters load. The effects of the challenge aerosol PSD can also be observed. It can be inferred from that an increase in the MMD of the challenge aerosol will lead to an increase in the total mass loading on the filter.
illustrates that the depth loading of the smaller MMD aerosols result in a filter loading more quickly. Conversely, the surface loading of the Arizona road dust, which has a much larger MMD, resulted in a longer loading time. These loading curves show changes in the rate of differential pressure increase above 2 kPa (8 in. w.c.). This change in loading rate is representative of a change in the filter pack geometry. Current testing has shown that ruptures of the test filters typically occur at 7.5 kPa (30 in. w.c.) of differential pressure.
Filtering Efficiency and Differential Pressure Curves
Another important aspect of filter performance is filtering efficiency. The filtering efficiency and differential pressure as a function of time for a test filter are displayed in . The filtering efficiency reported here is the particle count efficiency for all particle sizes that measure approximately 0.09–7.5 μm. As illustrated in , the filtering efficiency was always above the HEPA requirement and quickly approached greater than 99.9999%.
The filtering efficiency curve presented in is for a remote change filter challenged with Carbon black. All filters tested exhibited similar curves and stayed well above the 99.97% filtering efficiency limit for HEPA filters until the filter ruptured. The inset picture for shows the lowest filtering efficiency of 99.9997. The lowest filtering efficiency value is the filtering efficiency for the last sample collected immediately prior to filter rupture. The negative slope of this curve shows that the filter begins to leak prior to rupture. This leak is observed in the filtering efficiency curves for all filters and is a good indicator that the filter is approaching the point of rupture.
The differential pressure curve appears to be linear for an initial portion of the test, but as the testing continues the curve shifts to a more exponential nature. This is contributed to the dimple pleat separators. As the pressure increases, the dimples are overwhelmed and begin to flatten out. This creates a cascading effect of reduction in free flow area and increase in pressure drop. The filters of both designs that began to leak at a lower differential pressure than others would usually rupture at a higher differential pressure. The ruptures at a lower pressure were much less catastrophic than those at a higher differential pressure.
Penetration Curves
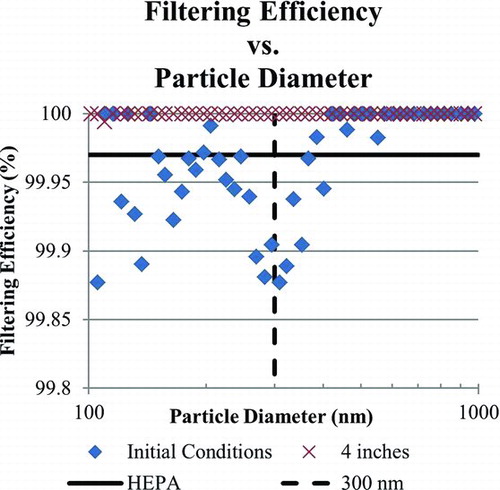
The total filtering efficiency as the filter is loaded has already been discussed, but it is useful to examine the penetration curve at different intervals throughout the loading process. The filtering efficiency versus particle diameter, or penetration curve, is a direct comparison of the upstream PSD and downstream PSD to see how well the filter performs at filtering differently sized particles. The penetration curve is also useful in locating the most penetrating particle size (MPPS). presents the penetration curve for two instances during loading: initially as the beginning of testing, and at 1 kPa (4 in. w.c.) of differential pressure across the filter. In this figure, the MPPS is displayed initially at approximately 300 nm. The figure displays a large discrepancy in the PSD initially and at 1 kPa (4 in. w.c.). By the time the differential pressure across the filter has reached 1 kPa (4 in. w.c.), virtually zero particles are measured downstream, as shown in and .
Elevated Temperature Results
Test Filters
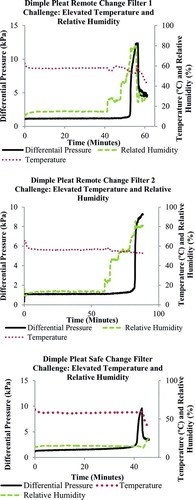
The elevated condition results focus on the testing parameters: differential pressure, temperature, and RH versus time. These parameters are examined only for the period of time at which the filter is being challenged with elevated conditions of temperature and RH. The two remote change filter tests, illustrated in , both reacted very similarly to challenge at elevated conditions. Only after the RH reached around 80% did the filters fail. The safe change test filter ruptured during the elevated temperature portion of the test. This test displayed the inferior performance of the safe change design when challenged with elevated conditions.
Elevated Condition Rupture Influences
Despite the results of testing the filters at elevated conditions, the particular cause(s) leading to the filter rupture were unknown. Aspects to consider are elevated flow rate, elevated temperature, and elevated RH. First, the test team evaluated the effect of the higher temperature on the flow rate of the system. The test stand is designed to operate according to standard flow (standard cubic feet per minute, or SCFM in English units). Standard flow remains the same independent of temperature, while the corresponding actual flow (actual cubic feet per minute, or ACFM in English units) rises with increasing temperature. To confirm this, pitot traverses were performed. The traverses revealed the flow was varying from 7 m3/min (250 CFM) to 14 m3/min (500 CFM) more than the set point of 56.6 m3/min (2000 CFM) at some traverse sampling locations when the burner was operating. Using an average, the actual volumetric flow rate when the burner was operating was 66.5 m3/min (2350 ACFM).
Following the pitot traverses, a second filter was tested. This filter was preloaded to the change-out differential pressure of 1 kPa (4 in. w.c.) with Al(OH)3 at the rated standard flow rate, at ambient temperature and RH. Using this preloaded filter, the flow rate was set to levels higher than 56.6 m3/min (2000 CFM) to simulate the elevated actual flow when the filter is exposed to high temperature. illustrates how the differential pressure of the filter increased as the volumetric air flow rate was increased first to 65.1 m3/min (2300 CFM), then to 70.8 m3/min (2500 CFM), and back to 56.6 m3/min (2000 CFM). shows that the greater the flow rate deviates from 56.6 m3/min (2000) CFM, the steeper is the slope or increase in differential pressure curve. This effect is likely due to the weakness in the dimples. The dimples are not rigid enough to prevent flattening out when the force of the airflow rises above that which is present during rated flow when loaded to 1 kPa (4 in. w.c.) with a challenge aerosol.
The next aspect to investigate was the influence of elevated temperature and RH on the slope of the differential pressure curve. To determine the effect of elevated temperature and RH, the test stand was operated at an actual (not standard) flow of 56.6 m3/min (2000 ACFM). Performing the test in using actual flow would remove any influence from elevated flow rate. A filter loaded to 1 kPa (4 in. w.c.) of differential pressure with Al(OH)3 was used. This test was conducted by first challenging the filter at the actual rated flow at an elevated temperature of 54.4°C (130°F) for 1 h. Next, the RH was incrementally increased to a maximum of 50%. The results of this test are presented in .
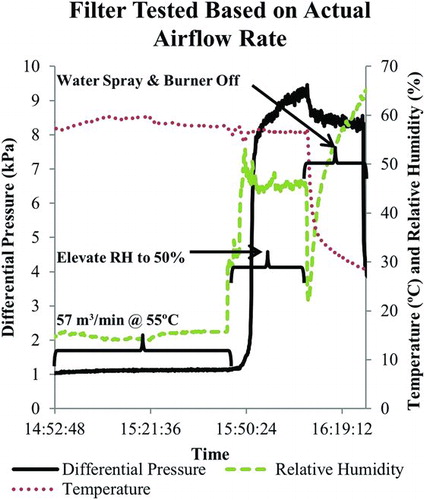
During the challenge with only elevated temperature, the filter showed very little change in differential pressure, approximately 0.125 kPa (0.5 in. w.c.). When the water spray was initiated, the filter ruptured quickly after the humidity reached 50%. This test indicates that elevated temperature alone has little effect on the slope of the differential pressure across the filter, yet the increase in RH has a greater effect on the slope of the differential pressure. The corresponding increase in differential pressure with the increase in RH is concurrent with the literature (Joubert et al. Citation2010) and particularly with supersaturated airstreams (Ricketts et al. Citation1989). The tests performed indicate that all factors (actual versus standard flow, elevated temperature, and elevated RH) have an effect on the filter service life, but the greatest detriment to filter life is the influence of elevated RH.
CONCLUSIONS
The test team collected a large quantity of data for all the filters tested. The information collected presents several issues: the slope differential in the mass loading curves, safe versus remote change filter designs, the challenge aerosol loading differences, the filtering efficiency performance, and the effect of elevated conditions on filter performance.
The mass loading curves present the initial differences in the challenge aerosols and filter pack designs. As shown in , the remote change filters had a higher loading capacity than the safe change designs. The challenge MMD had a large impact on the total mass loading of the filters tested. The PSD for Al(OH)3 and Carbon black had a very similar MMD, and thus the effects of plugging by small particles was similar. The Arizona road dust had a larger MMD, which led to a higher total mass loading.
The initial filtering efficiency for both designs well exceeded HEPA requirements. Once the filter loaded for an initial short period of time, the filter showed almost zero particles downstream. Determining the MPPS is easily obtained for the test filter due to the low particle concentration downstream; typically, once the filter loads, only particles near the MPPS penetrate the filter.
During ambient condition testing, the filters ruptured only when loaded with a large quantity of challenge aerosol. Significant variability in the rupture differential pressure was observed. While most filters would rupture around 7.5 kPa (30 in. w.c.), some would hold until 10 kPa (40 in. w.c.). While it can be assumed that the different filter designs made an impact on rupture differential pressure, the precise cause is unknown. The suspected cause for the quick rise to rupture once the differential pressure across the filter is around 2.5 kPa (10 in. w.c.) is the dimple pleat separators.
When the filters were tested under elevated conditions, other issues presented themselves. The challenge temperature and RH had a large effect on the performance of the filter. Another important issue is whether a control system operates according to actual (ACFM) flow or standard (SCFM) flow, as it has been shown to affect the filter performance. Performance differences in the two designs were also discovered, with the remote change version performing better than the safe change version.
Elevated humidity appears to be the most detrimental challenge parameter to a filter's performance. In the remote change filter design tests, the filters only began to fail after the water spray was initiated to elevate the RH of the airstream. The remote change filters typically failed at an RH greater than 50%. This failure is believed to be caused in part by the dimple pleats of the media. As the pleats absorb moisture they begin to lose rigidity, leading to a failure in keeping the filter pleats separated. When the filter pleats began to collapse, there was a cascading reduction in free flow area and an increase in differential pressure. A physical separator, such as a string separator, could possibly be incorporated in the design of the filter, which could lead to a longer filter service life in both ambient and elevated conditions by having a more linear differential pressure curve.
Supplemental Material.zip
Download Zip (752.8 KB)[Supplemental materials are available for this article. Go to the publisher's online edition of Aerosol Science and Technology to view the free supplemental files.]
We acknowledge the support of this work under DOE Cooperative Agreement DE-FC01-06EW07040.
REFERENCES
- ASMEASME-AG-1 Code on Nuclear Air and Gas Treatment American Society of Mechanical Engineers (ASME) New York 2009
- BaronP.A.WillekeK.Aerosol Measurement: Principles, Techniques, and Applications. 2nd ed. Wiley New York 2005
- ChenB.T.ChengY.S.YehH.C.198548997
- DNFSBHEPA Filters Used in the Department of Energy's Hazardous Facilities (DNFSB/TECH-23-1999) Defense Nuclear Facilities Safety Board Washington DC1999 http://www.dnfsb.gov/sites/default/files/Board%20Activities/Reports/Technical%20Reports/TECH-23_0.pdf
- DNFSBDefense Nuclear Facilities Safety Board Recommendation 2000-2 to the Secretary of Energy (DNFSB/Rec-2000-02) Defense Nuclear Facilities Safety Board Washington DC 2000 http://www.dnfsb.gov/sites/default/files/Board%20Activities/Recommendations/rec_2000-2_222.pdf
- DOEFire Protection Design Criteria (DOE-STD-1066–99) U.S. Department of Energy (DOE) Washington DC 1999
- DOENuclear Air Cleaning Handbook (DOE-HDBK-1169-2003) U.S. Department of Energy (DOE) Washington DC 2003
- EndoY.ChenDPuiD.Y. H1998352):191195
- FabbroL.D.LabordeJ.C.MerlinP.RicciardiL.20023913440
- GiffinP.K.ParsonM.S.UnzR.J.WaggonerC.A.201283055105
- GuptaA.NovickV.J.BiswasP.MonsonP.R.19931994107
- JoubertA.LabordeJ.C.BouillouxL.Calle-ChazeletS.ThomasD.20104410651076
- KuileW.DoigR. 1998 Paper presented at the 25th DOE/NRC Nuclear Air Cleaning and Treatment Conference, August 3–6, in Minneapolis, MN.
- LeeJ.K.KimS.C.LiuB.Y. H.200135805814
- LeeK.W.LiuB.Y. H.198213546
- LoughboroughD.1990 Paper presented at the 21st DOE/NRC Nuclear Air Cleaning Conference, August 13–16, in San Diego, CA.
- MiguelA.F.200334783799
- PetersT.M.CheinH.M.LundgrenD.A.KeadyP.B.199319396405
- RickettsC.I.RuedingerV.WilhelmJ.G.1987319345 Paper presented at the 19th DOE/NRC Nuclear Air Cleaning and Treatment Conference, August 18–21, in Seattle, WA,
- RickettsC.I.RuedingerV.WilhelmJ.G.1989668691 Paper presented at the 20th DOE/NRC Nuclear Air Cleaning Conference, August 22–25, in Boston, MA,
- StewardB.L.1987908919 NT-87-01-4