Abstract
A compact aerosol particle mass analyzer (APM) of which the size of the classifier was significantly reduced than that of the first commercial model (Kanomax Model 3600) was developed. Firstly, requirements for desired performance in classifying particle mass were set forth. Secondly, a theoretical framework for the design parameters of an APM that satisfies the requirements was formulated. Thirdly, the design parameters were determined that satisfies the requirements while reducing the instrument size. The requirements include the condition that the classification range covers from 0.001 to 1000 fg (approximately 12 to 1200 nm in size for spherical particles having the density of 1 g/cm3), and the condition that both the classification resolution and particle penetration in this mass range are higher than certain specified values. A prototype having the design parameters determined according to this theoretical framework was constructed, and its performance was evaluated experimentally. The external dimensions of the electrodes of the compact APM are approximately 140 mm in length and 60 mm in diameter. It was confirmed that the performance of the compact APM operated at the aerosol flow rate of 0.3 L/min was comparable to that of the Model 3600 APM operated at 1 L/min. Because of the reduced size and of the resultant improved portability, it is expected that the compact APM is readily applicable to field measurements.
Copyright 2013 American Association for Aerosol Research
1. INTRODUCTION
The aerosol particle mass analyzer (APM) classifies aerosol particles according to their mass-to-charge ratio (Ehara et al. Citation1996). When the number of charges on a particle is known, the APM can determine the particle mass. The APM has been used, often in combination with a differential mobility analyzer (DMA), for evaluation of various particle properties such as “effective” density (McMurry et al. Citation2002; Geller et al. Citation2006; Malloy et al. Citation2009; Liu et al. Citation2012), morphology through estimation of the mass-mobility exponent (Park et al. Citation2003a; Ku et al. Citation2006; Kim et al. Citation2009; Nakao et al. Citation2011; Scheckman and McMurry Citation2011; Torvela et al. Citation2011; Eggersdorfer et al. Citation2012; Guha et al. Citation2012; Ku and Evans Citation2012), the mixing ratio of internally-mixed particles (Sakurai et al. Citation2003; Park et al. Citation2008; Khalizov et al. Citation2009; Ma and Zachariah Citation2009), material density (Park et al. Citation2004; Kuwata et al. Citation2012), particulate mass concentration (Park et al. Citation2003b; Saito et al. Citation2008), mass (Kuwata et al. Citation2009; Lall et al. Citation2009), volume (Lall et al. Citation2008), and porosity (Lee et al. Citation2011). The APM can also be used as a generator of particles having a specified mass (Malik et al. Citation2011; Moteki et al. Citation2011; Laborde et al. Citation2012; Beranek et al. Citation2012). A variant of the APM called the Couette Particle Mass Analyzer (CPMA) has been developed (Olfert and Collings Citation2005; Olfert et al. Citation2006), and used for similar purposes (Olfert et al. Citation2007; Cross et al. Citation2010).
In our previous article (Tajima et al. Citation2011), we reported the appropriate mass range and desired operating conditions for the first commercial instrument, Model 3600 APM (Kanomax Japan Inc.), from the viewpoint of maximizing the mass classification performance. This model of APM is, however, significantly large in size, and hence it is not very suitable for field measurements. In the present study, we have developed an APM that is significantly compact and more suitable for use in field measurements compared to the Model 3600 APM.
In Section 2, starting with laying out a set of requirements for mass classification performance, we derive constraint formulas for the design parameters of the APM. We then determine a combination of the design parameters realizing an APM which is significantly smaller in size than and yet comparable in performance to the Model 3600 APM. In Section 3, we present experimentally evaluated performance of a prototype APM that was constructed according to the determined set of design parameters. The performance in terms of the accuracy and resolution in classifying particle mass and of the particle penetration through the APM is compared with that of the Model 3600 APM.
2. THEORETICAL CONSIDERATIONS
2.1. Design and Operation Parameters
The APM operates by balancing the electrostatic and centrifugal forces acting on charged particles introduced in rotating cylindrical electrodes. In the theoretical analysis that follows, we assume for simplicity that particles carry a single elementary charge. A brief discussion about the effect of multiply charged particles on mass distribution spectra obtained with the APM is given in the online supplemental information. Under the assumption of single charge, we may consider that the APM classifies particles according to the mass.
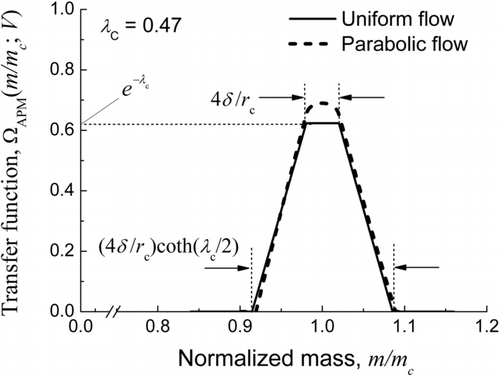
The performance of mass classification by the APM is characterized by the transfer function, which is defined as the ratio of the number flux of particles with a specified mass m at the outlet of the APM to that at the inlet when the APM is operated at a constant voltage V and angular velocity ω of the electrodes. The APM transfer function derived theoretically under the assumption that the velocity profile of the aerosol flow through the electrode gap is either uniform or parabolic is shown in . The center of the mass band of the transfer function m c (to be more strict, the particle mass at which the centrifugal force acting on a particle at the radial distance rc balances with the electrostatic force) is given by
FIG. 1 Theoretical APM transfer functions when the velocity profile of the aerosol flow is assumed uniform (solid line) and parabolic (dashed line). The transfer functions for λc = 0.47 are shown in this figure. (Reproduced from Weingartner et al. (Citation2011) with permission of John Wiley & Sons, Inc.)
The trajectories of particles having a mass m and a mechanical mobility B through the electrode gap, and hence the shape of the transfer function, are determined solely by the non-dimensional quantity termed the classification performance parameter
Because the uniform flow model for the aerosol velocity profile allows us an analytical expression for the theoretical transfer function, we adopt this model in the following analysis. Later in Section 2.5, we will confirm that the result obtained in this model is also valid for the parabolic flow model. Let the resolution, R, be defined as the ratio of m c to the full base length of the transfer function band, Δm. As indicates, R is given by
Let us define the particle penetration, T, as the maximum height of the transfer function, which is given by
The parameters that determine m c, R, and T can be categorized into the following two groupsFootnote 1 .
Operation parameters: ω and V
Design parameters: r c, δ, L, and Q
The parameters in the first group are those which can be selected at each operation from within certain limits; the limits are formally represented by
We chose the values of these limits as
The value of V hi was chosen to avoid dielectric breakdown between the APM electrodes, and the value of V lo was set roughly at 10 times the resolution of a readily available digital-to-analog converter to be used for controlling the electrode voltage. The value of ω hi was roughly the maximum capacity of a relatively compact motor typically used to rotate the electrodes. Finally, the value of ω lo was determined from the requirement that the relative precision of the motor in controlling the rotational velocity of the electrodes be better than 3%, as the rotational velocity fluctuates unacceptably when the electrode is rotated even slower.
Determining the second group parameters is the target of the present study. The two parameters, L and Q, can be reduced to a single parameter l = L/Q, because L and Q appear only in the combined form L/Q in λc.
2.2. Performance Requirements
We set forth the following formal requirements that need to be satisfied by a compact APM.
Requirement A: The variable range of m c covers entirely a specified range (m lo, m hi).
Requirement B: For any m c in (m lo, m hi), there exists an operating condition under which R is larger than or equal to a specified value R lo.
Requirement C: For any m c in (m lo, m hi), there exists an operating condition under which T is larger than or equal to a specified value T lo.
Here, it is understood in Requirements B and C that there must be an operating condition such that these two requirements are simultaneously satisfied. The actual values of m lo, m hi, R lo, and T lo are chosen so that the performance of the compact APM is comparable to that of the Model 3600 APM; namely,
The mass interval in EquationEquation (11) corresponds approximately to the size interval of (12 nm, 1.2 μm) for spherical particles having the density of 1.0 g/cm3.
Because the three requirements above do not result in a unique combination of design parameter values, it is desirable to introduce additionally a performance measure that can further narrow the range of the desired parameter values. Such a measure could be the product RT, or a product of certain powers of R and T. It would be, however, significantly complicated, though not impossible, to optimize such a quantity while satisfying the Requirements A to C, because these quantities depend not only on the design parameters but also on the operation parameters. Instead, we simply use δ/r c as such an additional performance measure. Equations Equation(5) and Equation(6) indicate that if there are multiple combinations of the design parameters that realize the same value of T, a smaller value of δ/r c will lead to a larger value of R, which rationalizes the use of δ/r c.
2.3. Constraints on Design Parameters
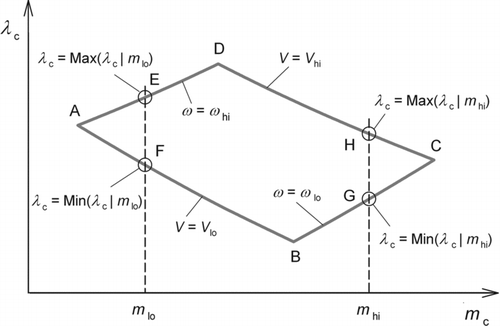
In this section, a theoretical framework is developed to derive possible combinations of the design parameters that satisfy the above three requirements. First we note that, for fixed design parameters, the values of m c and λc are fully determined from ω and V. shows typical contours of m c and of λc in the (ω, V) plane. The rectangle in shows the operation region specified by Inequalities Equation(7) and (8). We can select any two parameters out of the four parameters, m c, λc, ω, and V, as independent variables, and regard the remaining parameters as functions of the independent variables. Here, we choose (m c, λc) as independent variables. The operation region in the (m c, λc) plane appears a distorted parallelogram as shown in .
FIG. 2 Typical contours of m c (solid curves) and λc (dashed curves) in the (ω, V) plane. The rectangle ABCD indicates the operation region.
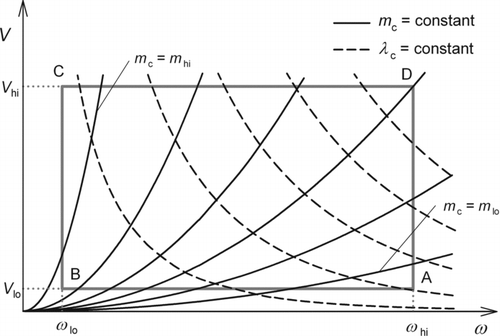
FIG. 3 Schematic illustration of the operation region in the (m c, λc) plane with both axes represented in logarithmic scale. The distorted parallelogram ABCD corresponds to the rectangle ABCD in Figure 2.
Let Min(m c) and Max(m c) denote the minimum and maximum values of m c in the operation region. Requirement A can be written as
Similarly, since Max(m c) =m c(C) = eV hi/(2r cδω2 lo); Inequality (14) is rewritten as
The symbols [RA1] and [RA2] are to indicate that these are conditions derived from Requirement A.
In order to the Requirements B and C to be satisfied, there must exist in the operation region some value of λc such that the inequalities
As seen in , for a given m c, λc spans across a range from Min (λc|m c) to Max (λc|m c) under the constraints of Equation(7) and (8), such as from points F to E in the figure. Here, Max (|m c) and Min (|m c) indicate, respectively, the conditional maximum and minimum for a given m c. For a given m c, if the inequality
Now we rewrite the conditions Equation(15″) and Equation(16″) into inequalities in terms of the design parameters. For Inequality Equation(15″), as shows, if Inequality Equation(15″) holds both at m c = m hi and at m c = m lo, it automatically holds at any m c within (m lo, m hi). Hence, we have
Since Max (λc|m
lo) occurs at point E in , we have Max (λc|m
lo) = λc(E) = 8πm
lo
B(m
lo)ω
hi
2
r
cδl, while λlo can be approximated as ![]() from our assumption δ/r
c ≪ 1. Hence Inequality (15″-1) is rewritten as
from our assumption δ/r
c ≪ 1. Hence Inequality (15″-1) is rewritten as
Similarly, noting that Max(λc|m hi) = λc(H) = 4πeV hi B(m hi)l, we can rewrite Inequality (15″-2) as
The symbols [RB1] and [RB2] indicate that these are conditions derived from Requirement B. In the same manner, Inequality Equation(16″) can be rewritten into
Finally, Inequality (18) can be rewritten from EquationEquation (17) as
The symbol [RBC] indicates that this condition is related to the simultaneousness of Requirements B and C.
In summary, the design parameters must satisfy [RA1], [RA2], [RB1], [RB2], [RC1], [RC2], and [RBC], in order for Requirements A, B, and C to be fulfilled.
2.4. Optimum Design
Substituting the limit values given in Equations Equation(9)–(12) into the conditions [RA1] to [RBC], we have
| |||||
| |||||
[RB1] r 2 c l ≥ 8.390 s, | |||||
[RB2] r c l/δ ≥ 0.1894 s/mm2, | |||||
[RC1] l ≤ 0.4320 s/mm2, | |||||
[RC2] r c δ l ≤ 6.371 s, | |||||
[RBC] δ/r c ≤ 0.4091. | |||||
The condition [RBC] need not be considered, because it is automatically satisfied under the assumption δ/r c ≪ 1. We additionally assume here that practically appropriate values of L and Q are, respectively, in the ranges of 40–200 mm and of 0.3–1.0 L/min. The corresponding range of l is then 0.003–0.040 s/mm2. The condition [RC1] is automatically satisfied, if l is in this range. In addition, the condition [RC2] is automatically satisfied, if [RA2] is satisfied and l is in this range. From these arguments, the conditions we have to consider are now reduced to [RA1], [RA2], [RB1], and [RB2]. It may be worth pointing out here that the conditions [RA1] and [RA2] were derived from the requirement on m c, while the conditions [RB1] and [RB2] were from the requirement on R.
The regions in the (r c, δ) plane that satisfy the conditions [RA1] to [RB2] for fixed values of l are shown in . As l increases, the lower boundary of r c decreases. If we adopt Q = 0.3 L/min which is an aerosol flow rate often employed for relatively small flow rate condensation particle counters (CPCs) and optical particle counters (OPCs), and if we choose L = 100 mm as a reasonably short electrode length, we have l = 0.02 s/mm2. Considering that a small r c is desirable in realizing a compact APM, and that a small value of our performance measure, δ/r c, is desirable, we chose the final combination of the design parameter values as l = 0.02 s/mm2 (L = 100 mm, Q = 0.3 L/min), r c = 24.5 mm, and δ = 0.5 mm. With this value of δ, the maximum electric field strength that may occur in the electrode gap, V hi/(2δ), is 2×10⁶ V/m, which is smaller than the commonly accepted threshold value of the dielectric breakdown of air, 3×10⁶ V/m (Lide [CRC Handbook of Chemistry and Physics], 2008). The chosen combination of the design parameter values is marked by a cross in . In this choice, the value of the performance measure, δ/r c, is 0.0204, which is comparable to the value, 0.0196, for the value for the Model 3600 APM. Note that this value of δ/r c is consistent with δ/r c ≪ 1 assumed in the above analysis.
FIG. 4 Regions in the (r c, δ) plane satisfying the conditions [RA1], [RA2], [RB1], and [RB2] for (a) l = 0.003 s/mm2, (b) 0.01 s/mm2, (c) 0.02 s/mm2, and (d) 0.04 s/mm2. The hatched areas indicate the regions in which all four conditions are satisfied. The crossmark in panel (c) represents the combination of the design parameters finally selected. Note that [RA1] and [RA2] represent the requirements, derived from Inequalities Equation(13) and (14) respectively, on the minimum and maximum particle masses that can be classified by the APM, while [RB1] and [RB2] the requirements, both derived from Inequality Equation(15), that the resolution at m c = m lo and m c = m hi, respectively, be larger than R lo (= 0.5).
![FIG. 4 Regions in the (r c, δ) plane satisfying the conditions [RA1], [RA2], [RB1], and [RB2] for (a) l = 0.003 s/mm2, (b) 0.01 s/mm2, (c) 0.02 s/mm2, and (d) 0.04 s/mm2. The hatched areas indicate the regions in which all four conditions are satisfied. The crossmark in panel (c) represents the combination of the design parameters finally selected. Note that [RA1] and [RA2] represent the requirements, derived from Inequalities Equation(13) and (14) respectively, on the minimum and maximum particle masses that can be classified by the APM, while [RB1] and [RB2] the requirements, both derived from Inequality Equation(15), that the resolution at m c = m lo and m c = m hi, respectively, be larger than R lo (= 0.5).](/cms/asset/27f179c6-a4d8-4d0b-9001-459399263e57/uast_a_827323_o_f0004g.gif)
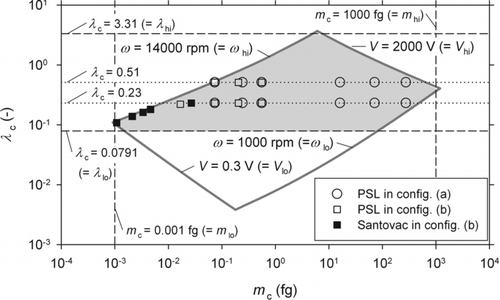
We note from that the conditions [RA2] and [RB2] are satisfied by wide margins. Taking advantage of this fact, we reselect the value of ω lo at 1000 rpm, instead of 500 rpm as initially assumed. The operation region of the APM with this value of ω lo is shown in . A summary of comparison between the APM thus designed and the Model 3600 APM is given in .
Table 1 Comparison between the compact APM developed in the present study and the Model 3600 APM
FIG. 5 Operation region of the compact APM constructed in the present study (distorted parallelogram). The hatched area indicates the region in which Requirements A, B, and C are all satisfied. The symbols ○, □, and ▪ represent the points on which APM spectra were experimentally obtained, where ○ represents an experiment conducted in configuration (a) with PSL particles used as test particles; □ in configuration (b) with PSL particles; and ▪ in configuration (b) with Santovac oil particles. See Figure 6 for configurations (a) and (b).
2.5. Validity in the Parabolic Flow Model
The preceding analysis is based on the uniform flow model for the velocity distribution of the aerosol flow in the electrode gap. A more realistic model of the flow profile is the parabolic flow model. In this section, we examine whether the design parameters chosen above satisfy Requirements A to C in the parabolic flow model.
First we note that the expressions of m c and λc (Equations Equation(2) and Equation(4)), and hence the location of the operation region in the (m c, λc) plane are model independent. Consequently, Requirement A is satisfied irrespective of the flow model. On the other hand, R(λc) and T(λc), and hence the values of λlo and λhi, depend on the flow model. EquationEquation (17) gives λlo and λhi in the uniform flow model, and with the chosen values of the design parameters, we have
In the parabolic flow model, R(λc) and T(λc) need to be calculated numerically. By performing this calculation, we obtain
![]()
Because the interval (λlo, λhi) of the parabolic flow model encompasses that of the uniform flow model, it is obvious that Inequalities Equation(15″), Equation(16″), and (18), and hence Requirements B and C, are satisfied also in the parabolic flow model.
3. EXPERIMENTAL VERIFICATION
3.1. Method
To confirm the validity of the preceding theoretical treatment, an APM having the values of the design parameters thus determined was constructed, and its performance was experimentally evaluated and compared to that of the Model 3600 APM. In typical measurements using an APM, the particle concentration at the APM outlet, CN , is recorded for a series of electrode voltage, V, at constant ω. We call a set of CN –V pairs an APM spectrumFootnote 2 . In the present study, we compare experimental APM spectra obtained for particles with a known mass to the corresponding theoretically predicted spectra. The experiment was carried out in either of the two configurations illustrated in . In configuration (a), the particle concentration at the APM inlet was measured before and after data collection of CN by switching a three-way valve connected to the inlet of a CPC. In configuration (b), two CPCs were used to measure the concentrations at the inlet and outlet of the APM simultaneously. In either configuration, the electrode voltage was swept linearly with time.
FIG. 6 Two experimental configurations.
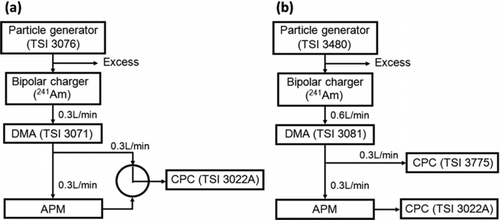
We proposed in the previous paper (Tajima et al. Citation2011) a scheme to select an appropriate value of λc for APM operations, which may be termed the “resolution matching scheme.” This scheme assumes the use of a DMA in combination with the APM, and the value of λc is so selected that the resolution of the APM expressed in terms of particle mobility matches the resolution of the DMA. In the present study, the ratio of the aerosol to sheath air flow rates of the DMA was set at 0.1, and the corresponding λc calculated according to the resolution matching scheme ranged from 0.25 to 0.5 depending on the particle size. In the experiment, we adopted λc = 0.23 and 0.51, the values roughly equal to the limits of this range, as long as they were inside the operation region ().
Polystyrene latex (PSL) particles of eight sizes; 29, 48, 70, 76, 100, 309, 506, and 791 nm (STADEX; JSR Co.), and Santovac oil particles were aerosolized to be used for test particles. When PSL particles were used, the DMA voltage was adjusted so that the highest particle concentration was attained at the DMA outlet. The density of each PSL particle type is given by the manufacturer, and is in the range from 1.054 to 1.115 g/cm3. Santovac oil particles were aerosolized by an electrospray aerosol generator (Model 3480, TSI Inc.), and were selected by the DMA at five different sizes ranging from 12 to 35 nm. We assume that the density of the Santovac particles is identical to that of a bulk liquid, 1.198 g/cm3. The mass of the test particles ranges from 0.0011 to 274 fg, which covers a major part of the interval specified by EquationEquation (11).
The symbols in (○, □, and ▪) indicate the points on which APM spectra were collected in the experiment. Since the line λc = 0.23 for m c smaller than about 10−2 fg is outside the operation region, the operation conditions for particles with such small m c were chosen so that ω took its maximum possible value, ω hi (= 14,000 rpm).
Prior to the experiment, continuous operations at 14,000 rpm longer than 10 h were conducted several times, and it was confirmed that the constructed APM worked stably at this maximum rotational speed. Also, it was confirmed that at the maximum voltage (2000 V), the electrostatic breakdown did not occur during the operations.
3.2. Results
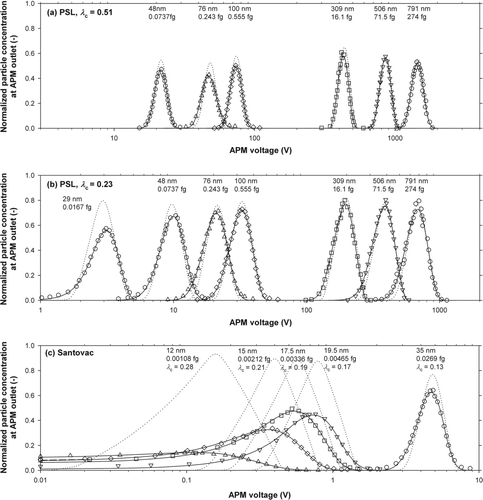
The APM spectra obtained experimentally are shown in (PSL particles with λc = 0.51), b (PSL particles with λc = 0.23), and c (Santovac oil particles). Theoretically, an APM spectrum can be calculated according to
FIG. 7 APM spectra for (a) PSL particles with λc = 0.51, (b) PSL particles with λc = 0.23, and (c) Santovac oil particles. Experimental spectra are shown with symbols, calculated spectra obtained by the least square fitting method shown with solid curves, and theoretically predicted spectra shown with dotted curves. Associated with each experimental spectrum is the values of the DMA-classified diameter and of the number-averaged mass. For spectra of Santovac oil particles, the values of λc are also shown.
The number-averaged mass can be calculated from n(m) thus determined. shows the ratio of the number-averaged mass obtained in this way to that predicted theoretically. The latter was derived from the volume of a sphere having the DMA-classified diameter multiplied by the known particle density. Because no noticeable systematic differences in the experimental results were observed between the two experimental configurations depicted in , as well as between the two choices of λc, the data in were plotted without discrimination between these experimental conditions. For the purpose of comparison, also shows the data obtained in our previous study using the Model 3600 APM operated at the aerosol flow rate of 1 L/min for PSL and NaCl particles (Tajima et al. Citation2011).
FIG. 8 Ratio of the number-averaged mass obtained experimentally to that predicted theoretically. The theoretically predicted mass values were based on the assumption that particles, including NaCl particles in the experiment with the Model 3600 APM, are spherical.
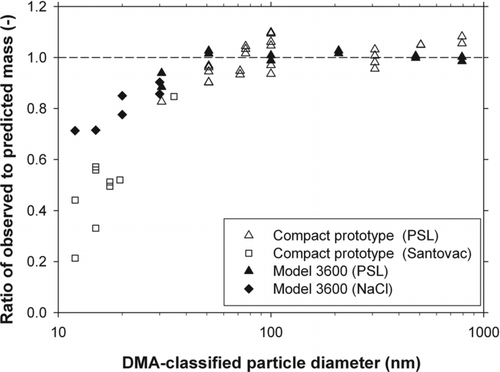
shows that the experimentally determined mass is in good agreement with the theoretically predicted mass for particles larger than 50 nm (approximately 0.1 fg in mass); the ratio between them is within the interval of 1 ± 0.1, with a slightly larger scatter among data for the prototype compact APM than for the Model 3600 APM. However, for particles smaller than 30 nm (approximately 0.02 fg in mass), a systematic deviation of the ratio from unity is observed, with the measured mass smaller than the predicted mass. This phenomenon is similarly observed for the Model 3600 APM, although quantitative comparison is not possible because different type of particles, especially in terms of their shape, were used in the present and previous studies. We note that the disagreement between theory and experiment in the relatively smaller mass range is observed regardless of the operating conditions as represented by λc, as well as regardless of the APM design.
Particle Brownian motion within the APM is expected to shift the APM transfer function to the larger mass side (Hagwood et al. Citation1995), and hence it cannot explain the observed disagreement. In our separate study (Sakurai et al. Citation2010), we investigated size change of Stantovac and poly-alpha-olefin (PAO) particles before and after the APM by using a scanning mobility particle sizer, but observed no size change even at 10 nm. Therefore, evaporation of the oil particles is not considered to be the major cause of the disagreement.Footnote 3 Larriba et al. (Citation2011) used a high-resolution DMA and a mass spectrometer in tandem to measure the mobility and mass of clusters of an ionic liquid. They showed that the mobility diameter, calculated from the measured mobility using the Stokes–Millikan law, was in excellent agreement with the sum of the volume diameter, which generalizes the mass diameter for binary substances such as salts, and 0.3 nm that accounts for the finite size of air molecules in the air-particle collision cross section (also see Ku and de la Mora [2009] for the 0.3 nm correction). If we apply this 0.3 nm correction to the mobility diameter of 12 nm which is the smallest particle size in our experiment, the predicted mass would decrease by about 7.3%. This correction can, therefore, partly explain the observed disagreement, but not all of it, which amounts to 30 to 80% at 12 nm.
Although no definitive explanation is obtained yet, the observed disagreement might be ascribable to nonsphericity of the test particles in the relatively small size range, which can lead to an increase in mobility equivalent diameter as compared to the diameter of spherical particles having the same mass. It is recently reported on the basis of observation with a scanning electron microscope that the sphericity of the 30 nm PSL particles is not as good as the 50 nm and larger PSL particles (Hayashida Citation2013). Also, oil droplets moving through the sheath air of a DMA could be distorted depending on their sizes, although we are unable at present to quantitatively estimate this effect.
Besides the locations of the APM spectra, their shapes, especially the widths of the spectra, are of our concern, because they reflect the actual resolution of the instrument. If a reasonable estimate of the shape of n(m) is available, we can calculate a theoretical spectrum according to EquationEquation (19) and compare it with experiment. Because the difference in number-averaged mass between the theoretical prediction and the experimental observation is significant for particles smaller than 30 nm, as we have just seen above, we temporarily use here an effective density such that the predicted number-averaged mass reproduces the observed number-averaged mass. In addition, we assume that the shape of n(m) is derived from the DMA transfer function multiplied by the size distribution at the DMA inlet; the latter for the PSL particles is approximated by a normal distribution having the size standard deviation provided by the particle manufacturer, and for Santovac particles approximated by a uniform distribution (Tajima et al. Citation2011). The theoretical spectra thus obtained are shown by the dotted lines in .
shows that the shapes of the experimental spectra for particles larger than 100 nm are in excellent agreement, both in their widths and heights, with those of the theoretical spectra. The agreement is still good for particles as small as about 50 nm, but for even smaller particles, especially particles smaller than 20 nm, notable broadening is observed in the experimental spectra. Again, the reason for this broadening is not identified at this moment. It should be pointed out that the apparently sharp spectrum for 48 nm PSL particles in was obtained at the rotational velocity almost equal to the maximum velocity ω hi (see also for the operation conditions). This indicates that an instability of the aerosol flow through the APM does not occur even at ω hi, and is not the reason for the broadening observed below 20 nm.
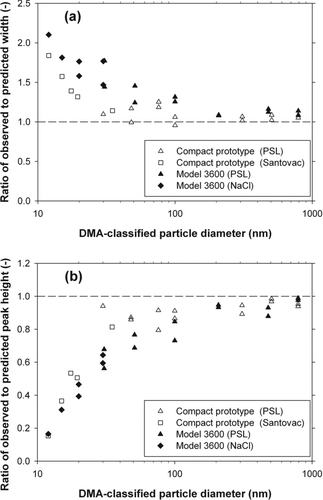
The ratios of the full width at half maximum and the peak height of the experimental spectra to those of the theoretically predicted spectra, plotted in , respectively, confirm that for particles larger than 50 nm the spectral broadening is not significant. also show that both the widths and heights of the spectra obtained with the compact APM are in slightly better agreement with the theoretical predictions than those with the Model 3600 APM.
FIG. 9 Ratios of (a) the full width at half maximum and (b) the peak height of the experimental spectra to those of the theoretically predicted spectra.
The analyses here demonstrate that the constructed APM operated at the aerosol flow rate of 0.3 L/min has a performance comparable to that of the Model 3600 APM operated at 1.0 L/min.
4. CONCLUSIONS
A theoretical framework was formulated that determines the design parameters of an APM which is significantly smaller than the existing Model 3600 APM and yet satisfies several performance criteria. A prototype compact APM having the design parameters determined according to this formulation was constructed, and its performance was experimentally evaluated.
The number-averaged mass of particles larger than 50 nm (approximately 0.1 fg in mass) determined experimentally was in good agreement with theoretically predicted values. The scatter of the experimentally obtained number-averaged mass around the theoretical prediction was slightly larger than that obtained with the Model 3600 APM. For particles smaller than 30 nm (approximately 0.02 fg), a systematic and significant underestimate of the number-averaged mass as compared with theoretical prediction was observed. This phenomenon was observed also for the Model 3600 APM, and regardless of the operating conditions. Although the exact reason for this phenomenon is not identified yet, a possible role of the nonsphericity of the test particles in the observed phenomenon is suggested.
The shape of the observed spectra was in excellent agreement with theoretical prediction, both in terms of their widths and heights, for particles larger than 100 nm, and in fairly good agreement for particles larger than 50 nm. Agreement of the spectral shape between theory and experiment was somewhat better than that of the Model 3600 APM.
These analyses show that the performance in classifying particle mass of the compact APM operated at the aerosol flow rate of 0.3 L/min is approximately the same as that of the Model 3600 APM operated at 1.0 L/min. With the external dimensions of the electrodes being 140 mm in length and 60 mm in diameter, the new compact model of APM can be adopted easily to field measurements.
Supplemental Information.zip
Download Zip (325.6 KB)Acknowledgments
The authors would like to thank Professor Yoshio Otani of Kanazawa University for his helpful support.
[Supplementary materials are available for this article. Go to the publisher's online edition of Aerosol Science and Technology to view the free supplementary files.]
Notes
There is some arbitrariness in categorizing Q in either group, but it is convenient to regard Q as a design parameter for the purpose of determining the design of an APM. Note that Q can be used to control R and T at each APM operation, but the same role can be played also by ω.
In practice, the ratio of CN to the particle concentration at the APM inlet is often recorded in order to compensate the variation of the concentration at the inlet during the scan over V. We also call a set of “normalized” C ″ N–V pairs an APM spectrum.
However, the aerosol temperature at the APM outlet was observed to increase by about 10 degrees at 14,000 rpm operation. Due attention should be paid to the temperature rise when semivolatile particles are to be measured.
Related Research Data
REFERENCES
- Beranek , J. , Imre , D. and Zelenyuk , A. 2012 . Real-Time Shape-Based Particle Separation and Detailed in Situ Particle Shape Characterization . Anal. Chem. , 84 : 1459 – 1465 .
- Cross , E. S. , Onasch , T. B. , Ahern , A. , Wrobel , W. , Slowik , J. G. Olfert , J. S. 2010 . Soot Particle Studies—Instrument Inter-Comparison—Project Overview . Aerosol Sci. Technol. , 44 : 592 – 611 .
- Eggersdorfer , M. L. , Kadau , D. , Herrmann , H. J. and Pratsinis , S. E. 2012 . Aggregate Morphology Evolution by Sintering: Number and Diameter of Primary Particles . J. Aerosol Sci. , 46 : 7 – 19 .
- Ehara , K. , Hagwood , C. and Coakley , K. J. 1996 . Novel Method to Classify Aerosol Particles Accoding to Their Mass-to-Charge Ratio – Aerosol Particle Mass Analyzer . J. Aerosol Sci. , 27 : 217 – 234 .
- Geller , M. , Biswas , S. and Sioutas , C. 2006 . Determination of Particle Effective Density in Urban Environments with a Differential Mobility Analyzer and Aerosol Particle Mass Analyzer . Aerosol Sci. Technol. , 40 : 709 – 723 .
- Guha , S. , Ma , X. , Tarlov , M. J. and Zachariah , M. R. 2012 . Quantifying Ligand Adsorption to Nanoparticles Using Tandem Differential Mobility Mass Analysis . Anal. Chem. , 84 : 6308 – 6311 .
- Hagwood , C. , Coakley , K. , Negiz , A. and Ehara , K. 1995 . Stochastic Modeling of a New Spectrometer . Aerosol Sci. Technol. , 23 : 611 – 627 .
- Hayashida , M. 2013 . Private Communication .
- Khalizov , A. F. , Zhang , R. Y. , Zhang , D. , Xue , H. X. , Pagels , J. and McMurry , P. H. 2009 . Formation of Highly Hygroscopic Soot Aerosols upon Internal Mixing with Sulfuric Acid Vapor . J. Geophys. Res.-Atmos. , 114 : D05208
- Kim , S. C. , Wang , J. , Emery , M. S. , Shin , W. G. , Mulholland , G. W. and Pui , D. Y. H. 2009 . Structural Property Effect of Nanoparticle Agglomerates on Particle Penetration through Fibrous Filter . Aerosol Sci. Technol. , 43 : 344 – 355 .
- Ku , B. K. , Emery , M. S. , Maynard , A. D. , Stolzenburg , M. R. and McMurry , P. H. 2006 . In Situ Structure Characterization of Airborne Carbon Nanofibres by a Tandem Mobility-Mass Analysis . Nanotechnology , 17 : 3613 – 3621 .
- Ku , B. K. and Evans , D. E. 2012 . Investigation of Aerosol Surface Area Estimation from Number and Mass Concentration Measurements: Particle Density Effect . Aerosol Sci. Technol. , 46 : 473 – 484 .
- Ku , B. K. and Fernandez de la Mora , J. 2009 . Relation between Electrical Mobility, Mass, and Size for Nanodrops 1–6.5 nm in Diameter in Air . Aerosol Sci. Technol. , 43 : 241 – 249 .
- Kuwata , M. , Kondo , Y. and Takegawa , N. 2009 . Critical Condensed Mass for Activation of Black Carbon as Cloud Condensation Nuclei in Tokyo . J. Geophys. Res.-Atmos. , 114 : D20202
- Kuwata , M. , Zorn , S. R. and Martin , S. T. 2012 . Using Elemental Ratios to Predict the Density of Organic Material Composed of Carbon, Hydrogen, and Oxygen . Environ. Sci. Technol. , 46 : 787 – 794 .
- Laborde , M. , Mertes , P. , Zieger , P. , Dommen , J. , Baltensperger , U. and Gysel , M. 2012 . Sensitivity of the Single Particle Soot Photometer to Different Black Carbon Types . Atmos. Meas. Tech. , 5 : 1031 – 1043 .
- Lall , A. A. , Ma , X. F. , Guha , S. , Mulholland , G. W. and Zachariah , M. R. 2009 . Online Nanoparticle Mass Measurement by Combined Aerosol Particle Mass Analyzer and Differential Mobility Analyzer: Comparison of Theory and Measurements . Aerosol Sci. Technol. , 43 : 1075 – 1083 .
- Lall , A. A. , Rong , W. , Madler , L. and Friedlander , S. K. 2008 . Nanoparticle Aggregate Volume Determination by Electrical Mobility Analysis: Test of Idealized Aggregate Theory Using Aerosol Particle Mass Analyzer Measurements . J. Aerosol Sci. , 39 : 403 – 417 .
- Larriba , C. , Hogan , C. J. , Attoui , M. , Barrajo , R. , Fernandez-Garcia , J. and Fernandez de la Mora , J. 2011 . The Mobility-Volume Relationship below 3.0 nm Examined by Tandem Mobility-Mass Measurement . Aerosol Sci. Technol. , 45 : 453 – 467 .
- Lee , S. Y. , Chang , H. , Ogi , T. , Iskandar , F. and Okuyama , K. 2011 . Measuring the Effective Density, Porosity, and Refractive Index of Carbonaceous Particles by Tandem Aerosol Techniques . Carbon , 49 : 2163 – 2172 .
- Lide , D. R. 2008 . CRC Handbook of Chemistry and Physics. , 15 – 43 . Florida : CRC Press .
- Liu , Q. , Ma , X. and Zachariah , M. R. 2012 . Combined On-Line Differential Mobility and Particle Mass Analysis for Determination of Size Resolved Particle Density and Microstructure Evolution . Microporous Mesoporous Mater. , 153 : 210 – 216 .
- Ma , X. and Zachariah , M. R. 2009 . Oxidation Anisotropy and Size-Dependent Reaction Kinetics of Zinc Nanocrystals . J. Phys. Chem. C , 113 : 14644 – 14650 .
- Malik , A. , Abdulhamid , H. , Pagels , J. , Rissler , J. , Lindskog , M. Nilsson , P. 2011 . A Potential Soot Mass Determination Method from Resistivity Measurement of Thermophoretically Deposited Soot . Aerosol Sci. Technol. , 45 : 284 – 294 .
- Malloy , Q. G. J. , Nakao , S. , Qi , L. , Austin , R. , Stothers , C. Hagino , H. 2009 . Real-Time Aerosol Density Determination Utilizing a Modified Scanning Mobility Particle Sizer Aerosol Particle Mass Analyzer System . Aerosol Sci. Technol. , 43 : 673 – 678 .
- McMurry , P. H. , Wang , X. , Park , K. and Ehara , K. 2002 . The Relationship between Mass and Mobility for Atmospheric Particles: A New Technique for Measuring Particle Density . Aerosol Sci. Technol. , 36 : 227 – 238 .
- Moteki , N. , Takegawa , N. , Koizumi , K. , Nakamura , T. and Kondo , Y. 2011 . Multiangle Polarimetry of Thermal Emission and Light Scattering by Individual Particles in Airflow . Aerosol Sci. Technol. , 45 : 1184 – 1198 .
- Nakao , S. , Shrivastava , M. , Nguyen , A. , Jung , H. and Cocker , D. R. 2011 . Interpretation of Secondary Organic Aerosol Formation from Diesel Exhaust Photooxidation in an Environmental Chamber . Aerosol Sci. Technol. , 45 : 964 – 972 .
- Olfert , J. S. and Collings , N. 2005 . New Method for Particle Mass Classification - the Couette Centrifugal Particle Mass Analyzer . J. Aerosol Sci. , 36 : 1338 – 1352 .
- Olfert , J. S. , Reavell , K. St. J. , Rushton , M. G. and Collings , N. 2006 . The Experimental Transfer Function of the Couette Centrifugal Particle Mass Analyzer . J. Aerosol Sci. , 37 : 1840 – 1852 .
- Olfert , J. S. , Symonds , J. P. R. and Collings , N. 2007 . The Effective Density and Fractal Dimension of Particles Emitted from a Light-Duty Diesel Vehicle with a Diesel Oxidation Catalyst . J. Aerosol Sci. , 38 : 69 – 82 .
- Park , K. , Cao , F. , Kittelson , D. B. and McMurry , P. H. 2003a . Relationship between Particle Mass and Mobility for Diesel Exhaust Particles . Environ. Sci. Technol. , 37 : 577 – 583 .
- Park , K. , Dutcher , D. , Emery , M. , Pagels , J. , Sakurai , H. Scheckman , J. 2008 . Tandem Measurements of Aerosol Properties—A Review of Mobility Techniques with Extensions . Aerosol Sci. Technol. , 42 : 801 – 816 .
- Park , K. , Kittelson , D. B. and McMurry , P. H. 2003b . A Closure Study of Aerosol Mass Concentration Measurements: Comparison of Values Obtained with Filters and by Direct Measurements of Mass Distributions . Atmos. Environ. , 37 : 1223 – 1230 .
- Park , K. , Kittelson , D. B. , Zachariah , M. R. and McMurry , P. H. 2004 . Measurement of Inherent Material Density of Nanoparticle Agglomerates . J. Nanoparticle Res. , 6 : 267 – 272 .
- Saito , K. , Shinozaki , O. , Yabe , A. , Seto , T. , Sakurai , H. and Ehara , K. 2008 . Measuring Mass Emissions of Diesel Particulate Matter by the DMA-APM Method (Second Report): Comparison with Filter Method . Rev. Automotive Eng. , 29 : 639 – 645 .
- Sakurai , H. , Ehara , K. , Tajima , N. and Fukushima , N. 2010 . “ Investigation on the Cause for Underestimation of Density Measured by the DMA-APM Method ” . In American Association for Aerosol Research 2010 Annual Conference , Portland , OR : Poster .
- Sakurai , H. , Park , K. , McMurry , P. H. , Zarling , D. D. , Kittelson , D. B. and Ziemann , P. J. 2003 . Size-Dependent Mixing Characteristics of Volatile and Nonvolatile Components in Diesel Exhaust Aerosols . Environ. Sci. Technol. , 37 : 5487 – 5495 .
- Scheckman , J. H. and McMurry , P. H. 2011 . Deposition of Silica Agglomerates in a Cast of Human Lung Airways: Enhancement Relative to Spheres of Equal Mobility and Aerodynamic Diameter . J. Aerosol Sci. , 42 : 508 – 516 .
- Tajima , N. , Fukushima , N. , Ehara , K. and Sakurai , H. 2011 . Mass Range and Optimized Operation of the Aerosol Particle Mass Analyzer . Aerosol Sci. Technol. , 45 : 196 – 214 .
- Torvela , T. , Lahde , A. , Monkare , J. , Riikonen , J. , Lehtinen , K. E. J. Jarvinen , K. 2011 . Low-Temperature Aerosol Flow Reactor Method for Preparation of Surface Stabilized Pharmaceutical Nanocarriers . J. Aerosol Sci. , 42 : 645 – 656 .
- Weingartner , E. , Burtscher , H. , Hüglin , C. and Ehara , K. 2011 . “ Semi-Continuous Mass Measurement ” . In Aerosol Measurement , Edited by: Kulkarni , P. , Baron , P. A. and Willeke , K. 262 – 264 . Hoboken, New Jersey : John Wiley & Sons .