
Abstract
Copyright 2015 American Association for Aerosol Research
INTRODUCTION
We have previously reported measurements of the complete particle number distribution down to one molecule made during atmospheric nucleation events (Jiang et al. Citation2011c). The Cluster Chemical Ionization Mass Spectrometer (Cluster CIMS; Zhao et al. Citation2010) measured concentrations of sulfuric acid vapor and sulfuric acid-containing clusters, while a scanning mobility particle spectrometer equipped with a diethylene glycol condensation particle counter (DEG SMPS) measured number distributions down to ∼1 nm. Cluster CIMS and DEG SMPS measurements typically agreed to within an order of magnitude in the overlap ∼1 nm range and showed similar trends with size.
Jiang et al. (Citation2011c) discussed sources of measurement error. For the Cluster CIMS, errors include interferences from high molecular weight gas molecules, and uncertainties in chemical ionization efficiencies, ion induced clustering (IIC), and mass discrimination (Zhao et al. Citation2010; Chen et al. Citation2012). For the DEG SMPS, uncertainties include material-dependent charging and DEG CPC activation efficiencies (Iida et al. Citation2009), as well as possible IIC in the bipolar charger.
In this study, we carried out laboratory experiments aimed at exploring these uncertainties for clusters formed from sulfuric acid and dimethylamine (DMA). Trace gas interferences have been eliminated from the clean flow reactor used here (Jen et al. Citation2014). Cluster CIMS measurements were done using both nitrate (HNO3•NO3−) and acetate (H2O•CH3CO2−) to test the hypothesis that chemical ionization efficiencies depend on the proton affinity of the reagent ions and composition of neutral clusters. The transfer function for the DEG SMPS mobility classifier is sufficiently broad to allow more than one cluster type to simultaneously reach the DEG CPC, and this was explicitly taken into account when comparing data from the two instruments. The DEG SMPS measurements were done at three fixed classifying voltages corresponding to centroid mobility diameters of 1.23 nm, 1.34 nm, and 1.55 nm. Mass (geometric) diameters are 0.3 nm smaller than mobility diameters (Larriba et al. Citation2011). As voltages were not scanned, we refer to these as DEG MPS measurements.
The 5 cm diameter flow reactor has been described previously (Jen et al. Citation2014). In brief, sulfuric acid vapor ([A1] = 107–109 cm−3) was introduced near the entrance, and DMA ([DMA] = 2–110 ppt) was injected at a point to allow the sulfuric acid and DMA to react for 3 s before measurement. Further experimental details are described in the online supplemental information (SI).
ION MOBILITIES AND MOBILITY CLASSIFIER TRANSFER FUNCTION
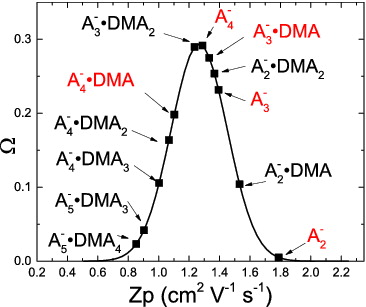
Ion cluster mobilities were calculated using a particle dynamics program (Larriba and Hogan Citation2013a,Citationb). The modeled ion compositions include dimer (A2−), trimer (A3−), and tetramer (A4−), as well as clusters with DMA molecules (Table S1). The structures of these ion clusters are from Ortega et al. (Citation2014). The simulations ran at experimental conditions of T = 300 K and P = 1 atm. The reemission velocity was set to 92% of Maxwell distribution. Water is not included in these structures but is likely present in the ions. We assume that water does not significantly affect the cluster's mobility diameter.
The TSI 3085 transfer function, Ω, has been measured previously and interpolated to the conditions of this study (Jiang et al. Citation2011a). shows Ω for a classifying voltage of 4.5 V, sheath flow of 13 LPM, and aerosol flow of 2.0 LPM. The points signify clusters that would penetrate through the mobility classifier at these operating conditions. The Ω value for each cluster represents the fraction of clusters that will be delivered to the DEG CPC. The clusters highlighted in red are detected by nitrate whereas acetate detects all clusters.
FIG. 1. TSI 3085 transfer function at the classifying voltage and flow rate used in this study. Clusters that fall within the mobility window are also shown. Those in red were detected by the Cluster CIMS using nitrate.
CLUSTER CIMS VS. DEG MPS AT 1.34 NM CENTROID MOBILITY DIAMETER
The value of Ω was multiplied by the measured Cluster CIMS concentration for each cluster type. The resulting concentrations were summed over all Cluster CIMS detected cluster types to give the predicted DEG MPS. The measured DEG MPS concentrations were inverted following Jiang et al. (Citation2011b), taking into account transport losses in the mobility classifier at 2 LPM and size-dependent charging and activation efficiencies. compares these predicted DEG MPS concentrations to values measured by DEG MPS. Results are shown for four [DMA] using both nitrate (hashed bars) and acetate (solid bars). Cluster CIMS concentrations were not corrected for IIC as IIC contributions were deemed negligible (see the SI). The various colors in the bar represent the various clusters detected by the Cluster CIMS. The height of each color segment represents the concentration of a specific cluster that would penetrate the mobility classifier (note log scale). For measurements carried out using nitrate, the agreement between the two instruments worsens as [DMA] increases. Acetate detects many more clusters types than nitrate and also leads to better agreement between instruments. This suggests that acetate is more efficient at chemically ionizing more neutralized clusters. DEG MPS are below those measured by the Cluster CIMS at low [A1]. Under these conditions, most of the clusters that penetrate through the mobility classifier are dimers. It is possible that the DEG CPC does not detect dimers efficiently.
FIG. 2. Comparison of predicted DEG MPS concentration at 1.34 nm centroid mobility diameter to measured DEG MPS concentration at various [DMA]. The colors in the bar represent each cluster type and its contribution to the total number concentration. Cluster CIMS measurements were done using acetate (solid bars) and nitrate (hash-marked bars). The lines show 1:1 comparisons. This method was applied to two other centroid mobility diameters: 1.23 (3.8 V) and 1.55 nm (6.0 V). These results are given in the SI and show good agreement.
![FIG. 2. Comparison of predicted DEG MPS concentration at 1.34 nm centroid mobility diameter to measured DEG MPS concentration at various [DMA]. The colors in the bar represent each cluster type and its contribution to the total number concentration. Cluster CIMS measurements were done using acetate (solid bars) and nitrate (hash-marked bars). The lines show 1:1 comparisons. This method was applied to two other centroid mobility diameters: 1.23 (3.8 V) and 1.55 nm (6.0 V). These results are given in the SI and show good agreement.](/cms/asset/cd6fdbb3-7ed5-435f-99bd-3343f413d8c2/uast_a_1002602_f0002_c.jpg)
CONCLUSION
This study demonstrates substantial progress toward reconciling measurements of ∼1 nm cluster number concentrations in a sulfuric acid/DMA system by two independent measurement methods: chemical ionization mass spectrometry and mobility classification coupled to a vapor condensation particle counter. Chemical ionization measurements carried out with acetate ions led to significantly better agreement than those done with nitrate, especially at high [DMA]. This suggests that ion proton affinity plays an important role in the chemical ionization process. For the DEG MPS, the uncertainty in charging and activation efficiency increases as cluster size decreases. Thus, the largest uncertainty of the DEG MPS measured concentration is at low [A1] where the size distribution is dominated by the smallest clusters.
SUPPLEMENTAL MATERIAL
Supplemental data for this article can be accessed on the publisher's website.
UAST_1002602_Supplementary_File.zip
Download Zip (200.3 KB)FUNDING
Support from NSF Awards AGS1068201, AGS0943721, and CDI1051396 is gratefully acknowledged. Coty N. Jen acknowledges support from NSF GRFP award 00006595. The authors thank Carlos Larriba for mobility calculation support.
REFERENCES
- Chen, M., Titcombe, M., Jiang, J., Jen, C., Kuang, C., Fischer, M. L., et al. (2012). Acid–Base Chemical Reaction Model for Nucleation Rates in the Polluted Atmospheric Boundary Layer. Proc. Natl. Acad. Sci, 109(45):18713–18718.
- Iida, K., Stolzenburg, M. R., and McMurry, P. H. (2009). Effect of Working Fluid on Sub-2 nm Particle Detection with a Laminar Flow Ultrafine Condensation Particle Counter. Aerosol Sci. Technol., 43:81–96.
- Jen, C. N., McMurry, P. H., and Hanson, D. R. (2014). Stabilization of Sulfuric Acid Dimers by Ammonia, Methylamine, Dimethylamine, and Trimethylamine. J. Geophys. Res.: Atmos., 119(12), DOI: 10.1002/2014JD021592.
- Jiang, J., Attoui, M., Heim, M., Brunelli, N. A., McMurry, P. H., Kasper, G., et al. (2011a). Transfer Functions and Penetrations of Five Differential Mobility Analyzers for Sub-2 nm Particle Classification. Aerosol Sci. Technol., 45:480–492.
- Jiang, J., Chen, M., Kuang, C., Attoui, M., and McMurry, P. H. (2011b). Electrical Mobility Spectrometer Using a Diethylene Glycol Condensation Particle Counter for Measurement of Aerosol Size Distributions Down to 1 nm. Aerosol Sci. Technol., 45:510–521.
- Jiang, J., Zhao, J., Chen, M., Eisele, F. L., Scheckman, J., Williams, B. J., et al. (2011c). First Measurements of Neutral Atmospheric Cluster and 1–2 nm Particle Number Size Distributions During Nucleation Events. Aerosol Sci. Technol., 45:ii–v.
- Larriba, C., and Hogan, C. J. (2013a). Free Molecular Collision Cross Section Calculation Methods for Nanoparticles and Complex Ions with Energy Accommodation. J. Comput. Phys., 251:344–363.
- Larriba, C., and Hogan, C. J. (2013b). Ion Mobilities in Diatomic Gases: Measurement versus Prediction with Non-Specular Scattering Models. J. Phys. Chem. A, 117:3887–3901.
- Larriba, C., Hogan, C. J., Attoui, M., Borrajo, R., Garcia, J. F., and de la Mora, J. F. (2011). The Mobility–Volume Relationship below 3.0 nm Examined by Tandem Mobility–Mass Measurement. Aerosol Sci. Technol., 45:453–467.
- Ortega, I. K., Olenius, T., Kupiainen-Määttä, O., Loukonen, V., Kurtén, T., and Vehkamäki, H. (2014). Electrical Charging Changes the Composition of Sulfuric Acid-Ammonia/Dimethylamine Clusters. Atmos. Chem. Phys. Discuss., 14:1317–1348.
- Zhao, J., Eisele, F. L., Titcombe, M., Kuang, C., and McMurry, P. H. (2010). Chemical Ionization Mass Spectrometric Measurements of Atmospheric Neutral Clusters using the Cluster-CIMS. J. Geophys. Res., 115:D08205.