
Abstract
In the EU there is an increasing need for regulatory agencies to derive health based threshold limits based on human inhalation studies with airborne particles. A necessary prerequisite for such projects is the development of a suitable generator system to produce nanoparticle test aerosols for human whole-body inhalation studies. We decided to use a generator with flame-based heating of aqueous precursor solutions. Validation of the test system was done by generating zinc oxide (ZnO) nanoparticles with minimal contamination of trace gases, i.e., nitric oxides or carbon monoxide that could confound the effects seen in exposed subjects. ZnO was selected based on the uncertainties surrounding its health effects after exposure at the workplace. The generation process of the developed flame generator yields ZnO nanoparticles with monomodal size distribution and very good temporal stability. The maximum target exposure mass concentration of 2 mg/m3 ZnO, with a resulting median particle diameter of 57 nm, is attainable in our human exposure laboratory. The morphological examination shows typical agglomerates and aggregates formed by high temperature processes. Overall, the performed experiments confirm that a constant exposure can be provided for all subjects at all times.
Copyright 2014 American Association for Aerosol Research
1. INTRODUCTION
Zinc oxide (ZnO) was selected for our planned human exposure study because the health effects caused by exposure to ZnO at the workplace are not fully understood (Monsé et al. Citation2013). Such exposures are common in a variety of work environments, for example, during welding of zinc-coated sheets, where submicron particles are emitted with different size distributions depending on the welding and joining techniques used (Brand et al. Citation2013).
In 2005, Beckett and coworkers compared the acute health effects of ultrafine particles (mobility equivalent diameter 0.04 μm) with fine particles (mobility equivalent diameter 0.26 μm) of ZnO with an airborne concentration of 0.5 mg/m3. In addition, a third scenario was tested using pure air. The single exposures were carried out with 12 healthy subjects for 2 h. No acute adverse effects were observed, even at the highest exposure concentration of 0.5 mg/m3 ZnO. Higher exposures were not tested due to technical limitations. Currently, there is no data available on exposure scenarios with higher mass concentrations and longer inhalation times when considering particles of similar median diameter. It is, therefore, uncertain at which ZnO concentration noxious effects occur, and as a result, the no observed adverse effect concentration (NOAEC) could be higher than 0.5 mg/m3. To address this problem, we set up a human inhalation study.
First, a feasibility study had to be carried out to determine the limits of the technical possibilities, and to define the exposure details needed for a human study in our whole body human exposure laboratory (ExpoLab), which was described in detail earlier by Monsé et al. (Citation2012). To establish the possible level of particle mass concentration, ZnO threshold limits were considered. The former German threshold limit for airborne ZnO dust prior to 2005 was 5 mg/m3 in the respirable fraction (alveolar fraction, A-fraction). In 2005, the limit value for airborne zinc at workplaces (calculated as ZnO) was only valid for procedures with a processing temperature <850°C and was 1.0 mg/m3 for the A-fraction. A higher value of 2.0 mg/m3 (A-fraction) was established for pouring procedures, flaming soldering, flaming sputter, brazing, and sweat and guts procedures at temperatures >850°C (Pflaumbaum, 2006). In 2006, these thresholds were cancelled under consideration of the uncertainness of noxious effects of ZnO. In most countries, the limit values for ZnO (fume or respirable dust) are still around 5 mg/m3 for 8 h (GESTIS Citation2013). For our exposure scenarios, we used a target concentration of 2 mg/m3ZnO.
Beckett et al. (Citation2005) used an electrical arc discharge system (Palas GmbH, Germany) to generate zinc oxide particles that were delivered to the subjects with a mouthpiece exposure system.
However, the output of this generator is too low to achieve whole body exposure at an exposure mass concentration of 2 mg/m3, especially taking into account the desired air exchange rates of 360 m3/h in our exposure room. Hence, this generator type was not suitable for our experimental design. Liquid flame spray method (LFS), which employs a flame generator, has been previously used to generate airborne ZnO particles as described in detail by Tikkanen et al. (Citation1997) and Mäkelä et al. (Citation2009). The apparatus generates a fine jet spray of a metal salt solution, which is pyrolyzed in a flame to form particles. The particle concentrations and the median particle diameters can be widely adjusted by varying the gas flow, the concentration of the metal salt, or the flow of the atomizing gas. Mädler et al. (Citation2002) and Tani et al. (Citation2002) presented a so called flame spray pyrolysis (FSP) process that was systematically investigated. In a further example, Height et al. (Citation2006) generated ZnO nanorods using FSP.
The function of the FSP-generators is similar to the LFS-method. A relatively new modification to the FSP-method was made by Rudin et al. (Citation2011), the flame-assisted spray pyrolysis (FASP). However, this method was also not suitable for our experiments due to the enormous costs and effort needed to adapt it to our laboratory. In 1982, McCarthy et al. (Citation1982) described a ZnO generating system in which supersaturated zinc fume reacts with oxygen to form ZnO particles. A major disadvantage of the system was its inability to constantly distribute ZnO particles. Hence, this system was also inappropriate for our approach. Additional information is available from Teoh et al. (Citation2010), who published a comprehensive review about the preparation of various oxide and nonoxide ceramic particles via FSP. Demokritou et al. (Citation2010) developed and characterized a versatile, engineered nanomaterial generation system (VENGES). They performed both in vivo and in vitro studies to show a linkage between physicochemical properties of engineered nanomaterials and their potential toxicity. The same system was used by Sotiriou et al. (Citation2012) as a novel platform for pulmonary and cardiovascular toxicological characterization of inhaled engineered nanomaterials. A major disadvantage of all FSP systems is the use of methane as the fuel source. In contrast to hydrogen, methane is very expensive (about 10-fold) and generates large amounts of carbon dioxide.
Since the particle generation systems described above were not suitable for the ExpoLab, we developed a nanoparticle generator with hydrogen-oxygen-flame-based heating of aqueous precursor solutions. The main reaction product, besides ZnO nanoparticles, is water vapor, which cannot confound the effects of ZnO on the exposed subjects. Further advantages of the flame-based generation method are the generation of ZnO at high temperatures comparable with welding processes, and the restriction to one substance.
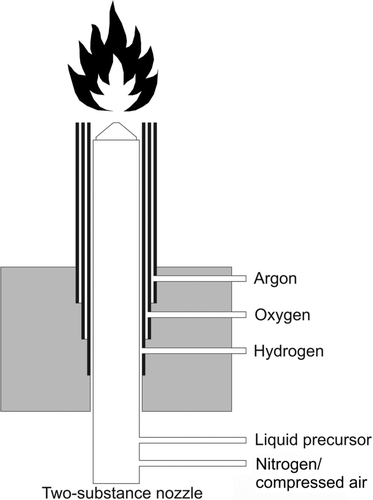
FIG. 1 Pictorial schematic of the burner head of the nanoparticle generator.
2. METHODS
2.1. Nanoparticle Generator
The characteristic features of the generator are three concentric metal tubes (type of steel is 1.4301, wall thickness is 1 mm) with 1 mm gap distances. A two-substance nozzle (model 970, Düsen-Schlick GmbH, Germany) is positioned at the center of the burner head () and used to spray the liquid precursor material. The parts of the nozzle that come into direct contact with hot flame gases are made of fireproof steel (type of steel is 1.4841). The inner annulus is fed by hydrogen (purity 99.9990%, Air Products GmbH, Germany) using adjustable flow rates of 0 to 20 L/min. The central annulus is fed by oxygen (purity 99.9990%, Air Products GmbH, Germany) with flow rates between 0 and 10 L/min. The outer annulus is admitted with argon (purity 99.998%, Air Products GmbH, Germany) to shield the flame cone from ambient air using flow rates of 0 to 20 L/min. Each gas supply is equipped with a mass-flow controller (EL-FLOW, Bronkhorst High-Tech B.V., The Netherlands). The special construction of the gas feedings causes spiral flow down the walls that allows constant and rapid mixing of gaseous reactants and the spray jet (Reed Citation1961). The flame of the burner head leaves the generator in a horizontal direction.
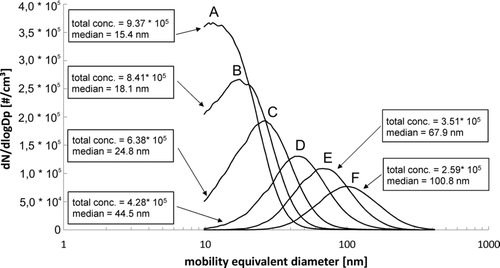
FIG. 2 Influence of varying airflow velocities on particle size distributions. Values were set to (a) 8.0; (b) 6.0; (c) 4.0; (d) 2.0; (e) 1.0; (f) 0.5 m/s.
All parts of the nanoparticle generator are assembled in a portable 19'' table-top housing unit. The gas-carrying tubes are composed of stainless steel, with additional safety assemblies integrated. An automatic burner control unit ensures safe operation by controlling, igniting, and monitoring the burner of the nanoparticle generator as it continuously operates with the help of a UV sensor pursuant to EN 746-2 (Citation2010). This burner head is electrode-free, and therefore the generated particles are free from contaminations that usually arise from the electrode material. If the system fails, the burner control unit shuts down the generator by closing the hydrogen and oxygen gas valves. An integrated flame arrestor provides protection against flashbacks and backfires. It also prevents the formation of dangerous gas mixtures within the pipelines.
We tested the nanoparticle generator at two different facilities. The characterization of the generated ZnO nanoparticles was performed at the nanoTest Center of the Institute for the Research on Hazardous Substances (IGF) in Dortmund, Germany. The system has been used in the past for numerous studies comparing aerosol measurement instruments (Dahmann et al. Citation2001; Asbach et al. Citation2009, Citation2012; Kaminski et al. Citation2013). We measured particle size distributions, temporal stability of the generation process, and the morphology of generated ZnO using several experimental settings in a 20-m-long steel pipe.
In our ExpoLab in Bochum, Germany, we determined the behavior of the ZnO nanoparticles with regard to homogeneity and exposure mass concentration of airborne particle atmospheres. Further measurements were performed to characterize the formation of trace gases and to check the elementary composition of the generated ZnO.
Further information of the analytical methods are given in the online supplementary information.
3. RESULTS AND DISCUSSION
3.1. Characterization of the Nanoparticles at the nanoTest Center (IGF)
The following settings of the generator were used during all experiments to assess the influence on the particle concentration, median diameter, and SEM/EDX analysis: the hydrogen volumetric flow rate was set to 10 L/min and the oxygen flow to 5 L/min. Argon was switched off. Atomizing gas was compressed air.
3.1.1. Influence of Diluting Volume Flow
The pyrolysis of the liquid precursor containing zinc acetate, water, and acetic acid (HAc) generates material with median diameters in the range of 15.4 to 100.8 nm, dependent on the volumetric flow rates of dilution air in the 20 m pipe. shows the influence of varying volume flows on particle size distributions. The atomizing pressure was set to 0.40 bar. The liquid precursor had a zinc salt concentration of 33.33 g/L and was pumped into the generator at a flow rate of 1.0 mL/min.
FIG. 3 Mean particle size distributions and their standard deviations of ZnO during 60 min for each different liquid precursor flows: (A) 0.25 mL/min, 18 SMPS-measurements; (B) 0.5 mL/min, 17 SMPS-measurements; (C) 1.0 mL/min, 17 SMPS-measurements; (D) 1.5 mL/min, 19 SMPS-measurements.
The system of the generator, in combination with the 20-m steel pipe, produced nanosized ZnO particles. The Scanning Mobility Particle Sizer (SMPS) curve A represents a volume flow of 5655 m3/h (airflow velocity in the pipe: 8.0 m/s, measured in the middle of the 20-m steel pipe with a distance of 0.25 m from the inner surface). The high air throughput causes a dilution of the generated primary particles and a reduction of the dwell time of the particles in the steel pipe. The result is the formation of smaller aggregates or agglomerates (15.4 nm) as compared to the conditions in the curves B to F in which the volume flows and dwell times decrease gradually (B: 6.0 m/s = 4241 m3/h, 18.1 nm; C: 4.0 m/s = 2827 m3/h, 24.8 nm; D: 2.0 m/s = 1414 m3/h, 44.5 nm; E: 1.0 m/s = 707 m3/h, 67.9 nm; F: 0.5 m/s = 353 m3/h, 100.8 nm). The opposite effect is observable in the particle concentrations that increase with higher volumetric flows, despite a higher dilution of the aerosol. This shows that the effect of reduced coagulation on the particle number concentration outweighs the dilution effect. The measured concentrations are in the range of 2.59![]() 106 to 9.37
106 to 9.37![]() 106 particles per cm3 (#/cm3). The curves A to C show a cutoff at <9.8 nm that represents the limit of detection of the particle sizer. The size distributions are monomodal with relatively small geometric standard deviations in the range of 1.42 to 1.64. These findings confirm processes that were previously reported (Hinds Citation1999).
106 particles per cm3 (#/cm3). The curves A to C show a cutoff at <9.8 nm that represents the limit of detection of the particle sizer. The size distributions are monomodal with relatively small geometric standard deviations in the range of 1.42 to 1.64. These findings confirm processes that were previously reported (Hinds Citation1999).
3.1.2. Influence of Liquid Precursor Flow and Temporal Stability of Particle Concentration
The atomizing pressure was set to 0.40 bar. The liquid precursor had a zinc salt concentration of 33.33 g/L and was pumped into the generator with different flow rates from 0.25 to 1.5 mL/min. Airflow velocity in the 20-m pipe was set to 2.0 m/s (1414 m3/h). To check the temporal stability of the particle concentration, each liquid precursor flow was fixed for about 60 min and 17 to 19 SMPS-measurements were recorded.
The particle concentrations are almost independent of precursor flows. Under these conditions, the mean concentrations are similar and in the range of 4.34–4.68![]() 106 #/cm3. The mean median diameter increases from 25.5 to 52.4 nm by increasing the precursor flow from 0.25 to 1.5 mL/min (Table S1) according to faster coagulation rates of the primary particles, which size was independent of experimental conditions (see section 3.1.7), to form larger agglomerates.
106 #/cm3. The mean median diameter increases from 25.5 to 52.4 nm by increasing the precursor flow from 0.25 to 1.5 mL/min (Table S1) according to faster coagulation rates of the primary particles, which size was independent of experimental conditions (see section 3.1.7), to form larger agglomerates.
The curves A to D in represent the average values for all measurement series. Additionally, the individual standard deviation at each channel of the SMPS device (in total 64 channels per size decade) is calculated and added to . Apparent from is that the particle size distributions were very stable. The standard deviations of the mean particle concentrations, calculated on the basis of the 17–19 SMPS-measurements for each liquid precursor flow, were in the maximum range of +/–2.6%. The standard deviations of the mean median diameters differed in the maximum range of +/–2.5%. The mean geometric standard deviations were also calculated to A: 1.57; B: 1.62; C: 1.62; and D: 1.62. The system reached a new steady state within 3 min after changing the flow rate of the liquid precursor (transition measurements not shown).
3.1.3. Influence of Atomizing Pressure
The atomizing pressure was set in the range of 0.20–0.40 bar. The liquid precursor had a zinc salt concentration of 8.33 g/L and was pumped into the generator with a flow of 1.0 mL/min. The airflow velocity in the 20-m pipe was set to 2.0 m/s (1414 m3/h).
Pressures <0.20 bar caused unstable atomization of the liquid precursor solution, clearly recognizable by the formation of very large droplets that dropped out of the flame cone. The pyrolyis efficiency decreased with pressures >0.40 bar. The acceleration of the spray jet became too high to pyrolyze all the components in the flame.
In fact, the influence of the atomizing pressure on particle concentration and median diameter is relatively small (Table S2). As a tendency, the particle concentration as well as the median diameter increase from 6.8![]() 106 to 7.2
106 to 7.2![]() 106 #/cm3 and 20.2 to 23.0 nm, respectively. The best atomizing results were attained by operating the nanoparticle generator at 0.30 bar.
106 #/cm3 and 20.2 to 23.0 nm, respectively. The best atomizing results were attained by operating the nanoparticle generator at 0.30 bar.
3.1.4. Influence of Zinc Concentration of the Liquid Precursor Solution
The atomizing pressure was set to 0.30 bar. The zinc acetate dihydrate concentrations of the liquid precursors were 8.33 and 16.67 g/L and were pumped into the generator with a constant flow rate of 1.0 mL/min. Airflow velocity in the 20-m pipe was set to 0.5 m/s (353 m3/h) and 2.0 m/s (1414 m3/h).
shows a relatively small influence of the zinc salt concentration on particle concentrations by fixed volume flows in the 20-m pipe, whereas the median diameter strongly increases. Pyrolysis of higher concentrated precursor solutions more rapidly generates more primary particles that agglomerate and aggregate, thus yielding increased median diameter. Furthermore, it can be seen that for the same precursor concentrations the median diameter becomes smaller as the airflow velocity increases. As shown in , higher velocity is synonymous for the reduction of the dwell time of particles in the steel pipe resulting in a decreased median diameter.
TABLE 1 Particle concentration and median diameter for different zinc concentrations and airflow velocities
3.1.5. Influence of Flame Size
The atomizing pressure was set to 0.30 bar. The zinc salt concentration of the liquid precursor was 8.33 g/L and was pumped into the generator with a constant flow rate of 1.0 mL/min. Airflow velocity in the 20-m pipe was set to 0.5 m/s (353 m3/h). Argon was switched off.
Table S3 indicates that a small flame size (5.0 L/min hydrogen and 2.5 L/min oxygen) does not produce enough flame volume to pyrolyze the complete spray jet. The resulting particle concentration is small. We assume that the main part of the spray jet forms large droplets that could not be detected with SMPS measurements. Comparing the medium and large flame size, the yield of particle concentration and the resulting median diameter is almost identical. Volume flows higher than 10 L/min hydrogen and 5 L/min oxygen are counter-productive. The pyrolysis efficiency remains at steady state, but the heat loss of the nanoparticle generator increases unnecessarily.
3.1.6. Measurements of Particle Size Distributions of Particles >600 nm
To check for incomplete pyrolysis of the precursor solutions, number size distributions of particles >600 nm were measured using an aerodynamic particle sizer (APS) with 20 s time resolution during our experiments with the following conditions: The nanoparticle generator operated with a hydrogen flow of 5, 10, and 15 L/min and an oxygen flow of 2.5, 5.0, and 7.5 L/min. The flow rate of the liquid precursors was set to 1.0 mL/min. The solutions were atomized with compressed air in a pressure range from 0.20 to 0.40 bar. Zinc salt solutions with concentrations of 8.33 and 16.67 g/L were used. Airflow velocities were fixed to 0.5, 2.0, and 8.0 m/s.
On average, we found 78 +/– 15 #/cm3 in a range of 53 to 104 #/cm3 with a median diameter of 0.79 +/– 0.06 μm. The average geometric standard deviation was 1.55. The results were independent of the adjusted conditions. Background measurements, without pumping the liquid precursor solution into the operating generator, yielded 14 #/cm3. Estimations of the larger particles with an assumed density of 1 g/cm3 showed that on average, 60 μg/m3 additional particular mass concentration is formed. These values were negligibly small in comparison with the target exposure mass concentration of 2 mg/m3 ZnO but showed that the pyrolysis efficiency may not have reached 100%.
3.1.7. Scanning Electron Microscopy
Flow rate of the liquid precursor solutions was 1.0 mL/min. The atomizing pressure was set to 0.30 bar. Image A in represents the particle morphology at the highest volume flow through the 20-m pipe at 5655 m3/h. The zinc salt concentration was 8.33 g/L. Under these conditions, only primary particles were found with an estimated diameter of 10 nm. Confirming SMPS measurements yielded a particle concentration of >6![]() 106 #/cm3 with a median diameter of <9.8 nm (below limit of detection). Sampling time with the Nanometer Aerosol Sampler (NAS) was 3 min.
106 #/cm3 with a median diameter of <9.8 nm (below limit of detection). Sampling time with the Nanometer Aerosol Sampler (NAS) was 3 min.
FIG. 4 SEM pictures of collected ZnO particles. (a)Volume flow 5655 m3/h; (b) volume flow 353 m3/h.
Image B shows particles sampled during experiments with the following conditions: volume flow through the 20-m pipe was set to 353 m3/h (0.5 m/s). The zinc salt concentration was 33.33 g/L and the sampling time of the NAS device was 2 min. Aggregation processes occurred, which yielded larger particles assembled of sintered primary particles. An estimation of the primary particle diameter is 10 nm. Thus, the experimental conditions did not influence the primary particle diameter. Additionally, the aggregates of primary particles accumulate to considerably larger agglomerates. SMPS results gave a particle concentration of 3.3![]() 106 #/cm3 with a median diameter of 95 nm and confirmed the trend of SEM measurements. This image is typical of a high temperature nanoparticle generation process (Tsantilis and Pratsinis Citation2004).
106 #/cm3 with a median diameter of 95 nm and confirmed the trend of SEM measurements. This image is typical of a high temperature nanoparticle generation process (Tsantilis and Pratsinis Citation2004).
3.1.8. EDX Spectroscopy
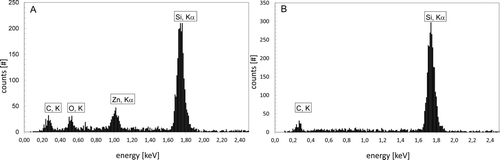
In , the energy-dispersive X-ray (EDX) spectrum A was recorded by measuring the agglomerated particles on the same silicon substrate that was used for scanning electron microscopy. The characterized particles in spectrum A confirmed the presence of Zn and O. Further signals were seen for silicon and carbon. These additional signals issued from the silicon substrate were confirmed with spectrum B that was recorded beside a particle. EDX-analyses of the substrate with precipitated primary particles yielded identical results.
FIG. 5 EDX spectroscopy. (a) Spectrum of a particle: absorption peaks of carbon (C, K), oxygen (O, K), zinc (Zn, Kα), and silicon (Si, Kα). (b) Background spectrum: absorption peaks of carbon (C, K) and silicon (Si, Kα).
3.2. Characterization of the Nanoparticles in the ExpoLab (IPA)
For safety purposes, we decided to use aqueous precursor solutions. In case of escaping unpyrolyzed precursor droplets out of the flame cone, only water vapor will be generated and the zinc salts will remain in the pipes of the air conditioning vents. The used salts (zinc acetate or zinc formate) are not volatile and, therefore, do not pose any risk to the subjects.
3.2.1. Trace Gas Analyses
As known from the literature, high-temperature processes promote the generation of nitric oxides when ambient air is involved. In our experiments, the flame stoichiometry is fixed to a constant ratio of 2:1 (hydrogen 10 L/min to oxygen 5 L/min), and causes a quantitative reaction of both gases to yield water vapor without any remaining oxygen content. A dosage of excess of hydrogen should be avoided. Reduction processes could change the composition of ZnO particles as seen in experiments with the formation of copper particles by Scharmach et al. (Citation2010). To protect the flame cone against additional oxygen from ambient air or atomizing gas, we used argon as the sheath gas (optimum flow rate was 4 L/min) in combination with nitrogen as the atomizing gas (pressure 0.30 bar). Under these conditions, the nitric oxides (NOx) emissions were decreased to a minimum of 160 ppb nitrogen monoxide (NO) and 180 ppb nitrogen dioxide (NO2) (Table S4). Both values were well below the maximum allowable concentrations of 500 ppb for either gas (DFG Citation2012). Operation of the nanoparticle generator without the argon sheath flow and with pressurized air instead of nitrogen as the atomizing gas yields NOx values beyond 500 ppb (each >1.5 ppm).
For further measurements, the conditions of the nanoparticle generator were fixed to the evaluated optimum (see below). Carbon monoxide (CO) was not detectable; whereas, carbon dioxide (CO2) expectably increased, calculated to additional 2.5 ppm to the ambient CO2 concentration of about 390 ppm (NOAA Citation2013). The calculation was based on the complete decomposition of the acetate groups and HAc in the liquid precursor solution under generation of CO2. This effect is negligible with respect to our planned human exposure study. The CO/CO2 detector shows slightly elevated CO2 concentrations, but the measurement signal remained at the noise level of the detector. HAc was determined at 100 ppb via mass spectroscopy and is much smaller than the limit value of 10 ppm (DFG Citation2012). Ozone (O3) was not detected (concentration <1 ppb). The analysis of the fluids of the two impingers did not detect hydrogen peroxide (H2O2), a byproduct in hydrogen-oxygen flames, as previously reported (Holt and Oldenberg Citation1947). A possible generation of propylene, acetic anhydride and acetone could be excluded by measurements with online mass spectroscopy. Except for HAc (concentration about 0.03 mg/m3), volatile organic compounds (VOC) sampled by Tenax® TA tubes did not exceed 0.005 mg/m3 (limit of detection, LOD). Together with HAc, traces of formic acid (below the limit of determination 1.5 mg/m3) were found by silica gel tube sampling, but the low concentrations are irrelevant for exposure studies. Analysis of the activated carbon tube, as well as the backup analyzer XAM 7000, was below the detection limits of any additional compounds.
3.2.2. Elementary Analysis and FTIR Spectroscopy of ZnO Particles
The average results from the determination of two different samples were 2.01% carbon, 0.56% hydrogen, and 0.97% nitrogen. The conceivable generation of zinc carbonate was not confirmed and the carbonate content was determined to be 0.14%, which was negligible. The nitrogen content is due to a side reaction of ZnO with airborne NO2 on the filter medium, as the latter was passed through the filters to form zinc nitrate. The Fourier Transform Infra Red (FTIR) spectra of the collected material and purchased zinc nitrate showed the same signal at 1387 cm−1. The collected ZnO material contained no residues of unpyrolyzed zinc formate dihydrate as determined by comparing the corresponding FTIR spectra. Typical signals of zinc formate dihydrate at 770, 1350, and 1380 cm−1 were not detectable in the spectra of purchased ZnO and collected ZnO particles. The remaining carbon and hydrogen content could not be assigned to known substances using FTIR spectroscopy. Considering the side reaction of NO2, the purity of the generated ZnO particles was about 97.4%.
3.2.3. Measurements of Exposure Mass Concentration
We recorded a decay curve in the ExpoLab with the use of propylene after a steady state concentration of 1 ppm. The air exchange rate was calculated at 11.71 +/– 0.02/h. The resulting volumetric flow rate, calculated with a unit volume of 28.567 m3 (Monsé et al. Citation2012), was 334.5 m3/h. Using the liquid precursor solution with a zinc salt concentration of 33.33 g/L and a flow rate of 1.0 mL/min resulted in 0.742 g/h ZnO (assuming 100% pyrolysis efficiency). Thus, the exposure mass concentration should be 2.22 mg/m3 ZnO. The TEOM measurements confirmed the calculation with a stable measurement value of 2.27 +/– 0.05 mg/m3.
3.2.4. Homogeneity of Nanoparticle Atmospheres in the ExpoLab
To check the homogeneity in the ExpoLab, we generated a ZnO atmosphere with a target exposure mass concentration of 2.0 mg/m3. The atomizing pressure was set to 0.40 bar. The liquid precursor had a zinc salt concentration of 25.87 g/L zinc formate dihydrate and was pumped into the generator with a flow rate of 1.0 mL/min. The nanoparticle generator operated with a hydrogen flow of 10 L/min, oxygen flow was 5.0 L/min, and argon flow was fixed to 4.0 L/min.
The number concentration, size distributions, and the exposure mass concentration were determined at points 1–7, as illustrated in , under two different conditions—A: without portable fan; and B: with portable fan. Points 1–4 are the working areas of the subjects, point 5 is the middle of the ExpoLab, and points 6 and 7 are the remaining corners.
FIG. 6 Measurement points (1–7) in the ExpoLab.
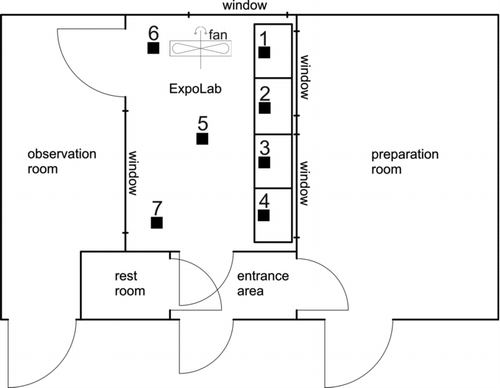
The exposure mass concentration was not influenced by the use of a fan in the ExpoLab for ventilation. We found that without ventilation, the particle size distribution was inhomogenous with a tendency to form particles with an increased median diameter (averaged median diameter is 79 nm+/– 11%), and decreased particle number concentration. The reason was the presence of different airflow velocity zones within the ExpoLab. The mass exposure concentration remained unchanged, independent of the measurement points in the ExpoLab (). We observed that zones with different aging times of the particles formed different size distributions. By mixing the air in the ExpoLab with a fan, the airflow velocity was similar throughout the lab, the agglomeration processes at each measurement point were equal, and the resulting size distributions showed a decreased median particle diameter of 57 nm with a much smaller deviation of +/– 5%.
The corresponding particle size distributions are shown in Figures S2a (without portable fan) and b (with portable fan). Table S5 underlines our findings. The median diameters are more variable without the use of the fan (69—91 nm), but improves when the fan is used (52 to 61 nm).
3.3. Comparison of the nanoTest Center (IGF) with the ExpoLab (IPA)
Adopting the experimental conditions at the IGF nanoTestCenter to the situation in the ExpoLab should yield particles with a median diameter of about 100 nm due to the same air exchange rate of 360 m3/h used in both systems. The tubes of the air conditioning system of the ExpoLab are much smaller in diameter (20 cm) and length (about 10 m), and therefore the resulting dwell time prevented the formation of larger aggregates. We found particles with a median particle diameter of only 57 nm.
The geometric standard deviations of the particle size distributions at the nanoTest Center are in the range of 1.42 to 1.64, and in the ExpoLab in the range of 1.77–1.82. The aerosol ageing process (primarily coagulation) in the turbulent flow in the 20 m pipe was different from the process in the ExpoLab. In the pipe, the aerosol was fed at the entrance and grew steadily as it flowed down the pipe. In the exposure room, the aerosol was continuously fed into a volume with well-stirred turbulent mixing ventilation where aged aerosol was already present. The geometric standard deviation of the size distribution was increased, but the distribution was still monomodal. Previous work suggests that this can lead to bimodal aerosol size distributions within a certain volume, as shown by Seipenbusch et al. (Citation2008).
4. CONCLUSION
Overall, the described experiments confirm that a constant exposure with nanosized ZnO particles can be continuously provided for all subjects in the ExpoLab with a target exposure mass concentration of 2.0 mg/m3. The measured trace gases are not expected to confound the medical effect parameters in human exposure studies.
SUPPLEMENTARY MATERIAL
Supplemental data for this article can be accessed on the publisher's website.
Mons__Supplemental_material-2014-01-24.zip
Download Zip (281.5 KB)ACKNOWLEDGMENTS
The authors thank H. Schulze and Dr. H.-H. Fricke (IGF Bochum, Institute for the Research on Hazardous Substances, Germany) for technical support and FTIR spectroscopy and Dr. D. Taeger (IPA Bochum, Institute for Prevention and Occupational Medicine of the German Social Accident Insurance, Germany) for handling of the software “GraphPad Prism.”
REFERENCES
- Asbach , C. , Kaminski , H. , Fissan , H. , Monz , C. , Dahmann , D. Mülhopt , S. 2009 . Comparison of Four Mobility Particle Sizers with Different Time Resolution for Stationary Exposure Measurements . J. Nanopart. Res. , 11 : 1593 – 1609 .
- Asbach , C. , Kaminski , H. , von Barany , D. , Kuhlbusch , T. A. J. , Monz , C. Dziurowitz , N. 2012 . Comparability of Portable Nanoparticle Exposure Monitors . Ann. Occ. Hyg. , 56 : 606 – 621 .
- Beckett , W. S. , Chalupa , D. F. , Pauly-Brown , A. , Speers , D. M. , Stewart , J. C. Frampton , M. W. 2005 . Comparing Inhaled Ultrafine Versus Fine Zinc Oxide Particles in Healthy Adults . Am. J. Respir. Crit. Care Med. , 171 : 1129 – 1135 .
- Brand , P. , Lenz , K. , Reisgen , U. and Kraus , T. 2013 . Number Size Distribution of Fine and Ultrafine Fume Particles from Various Welding Processes . Ann. Occup. Hyg. , 57 ( 3 ) : 305 – 313 .
- Dahmann , D. , Riediger , G. , Schletter , J. , Wiedensohler , A. , Carli , S. Graff , A. 2001 . Intercomparison of Mobility Particle Sizers (MPS) . Gefahrst. Reinhalt. L. , 61 : 423 – 427 .
- Demokritou , P. , Büchel , R. , Molina , R. M. , Deloid , G. M. , Brain , J. D. and Pratsinis , S. E. 2010 . Development and Characterization of a Versatile Engineered Nanomaterial Generation System (VENGES) Suitable for Toxicological Studies . Inhal. Toxicol. , 22 ( S2 ) : 107 – 116 .
- DFG (Deutsche Forschungsgemeinschaft) . 2012 . The MAK Collection for Occupational Health and Safety, , (Online vol. 48) , Wiley VCH, Weinheim. ISBN . 978-3-527-33427-8
- EN 746-2 . 2010 . Industrial Thermoprocessing Equipment. Safety Requirements for Combustion and Fuel Handling Systems , Berlin : Beuth .
- GESTIS . 2013 . Database on Hazardous Substances. International Threshold Limits for Chemical Substances http://www.dguv.de/ifa/de/gestis/limit_values/index.jsp
- Height , M. J. , Mädler , L. and Pratsinis , S. E. 2006 . Nanorods of ZnO Made by Flame Spray Pyrolysis . Chem. Mater. , 18 : 572 – 578 .
- Hinds , W. C. 1999 . Aerosol Technology. Properties, Behavior and Measurement of Airborne Particles , 260 – 277 . New York : John Wiley & Sons Inc. . ISBN 978-0-471-19410-1
- Holt , R. B. and Oldenberg , O. 1947 . Spectroscopic Study of the Role of Hydrogen Peroxide in the Thermal Combination of Hydrogen and Oxygen . Phys. Rev. , 71 : 479
- Kaminski , H. , Rath , S. , Götz , U. , Sprenger , M. , Wels , D. Polloczek , V. 2013 . Comparability of Mobility Particle Sizers and Diffusion Chargers . J. Aerosol. Sci. , 57 : 156 – 178 .
- Mädler , L. , Kammler , H. K. , Mueller , R. and Pratsinis , S. E. 2002 . Controlled Synthesis of Nanostructured Particles by Flame Spray Pyrolysis . J. Aerosol. Sci. , 33 ( 2 ) : 369 – 389 .
- Mäkelä , J. M. , Aromaa , M. , Rostedt , A. , Krinke , T. J. , Janka , K. Marjamäki , M. 2009 . Liquid Flame Spray for Generating Metal and Metal Oxide Nanoparticletest Aerosol . Hum. Exp. Toxicol. , 28 : 421 – 431 .
- McCarthy , J. F. , Yurek , G. J. , Elliott , J. F. and Amdur , M. O. 1982 . Generation and Characterization of Submicron Aerosols of Zinc Oxide . Am. Ind. Hyg. Assoc. J. , 43 ( 12 ) : 880 – 886 .
- Monsé , C. , Monz , C. , Dahmann , D. , Asbach , C. , Stahlmecke , B. Lichtenstein , N. 2013 . Vorbereitungen zur Untersuchung gesundheitlicher Effekte von Zinkoxidpartikeln. [Developments for Investigations into the Health Effects of Zinc Oxide Particles.] . Gefahrst. Reinhalt. L. , 73 ( 4 ) : 144 – 148 .
- Monsé , C. , Sucker , K. , van Thriel , C. , Broding , H. C. , Jettkant , B. Berresheim , H. 2012 . Considerations for the Design and Technical Setup of a Human Whole-Body Exposure Chamber . Inhal. Toxicol. , 24 ( 2 ) : 99 – 108 .
- NOAA . 2013 . National Oceanic and Atmospheric Administration USA http://www.noaa.gov
- Pflaumbaum , W. , Blome , H. and Kleine , H . 2006 . BGIA-Report 1/2006 St. Augustin List of Hazardous Substances 2006. German Federation of Institution for Statutory Accident Insurance and Prevention. ISBN 3-88383-700-8
- Reed , T. B. 1961 . Induction-Coupled Plasma Torch . J. Appl. Phys. , 32 ( 5 ) : 821 – 824 .
- Rudin , T. , Wegner , K. and Pratsinis , S. E. 2011 . Uniform Nanoparticles by Flame-Assisted Spray Pyrolysis (FASP) of Low Cost Precursors . J. Nanopart. Res. , 13 : 2715 – 2725 .
- Scharmach , W. J. , Buchner , R. D. , Papavassiliou , V. , Pacouloute , P. and Swihart , M T. 2010 . A High-Temperature Reducing Jet Reactor for Flame-Based Metal Nanoparticle Production . Aerosol Sci. Tech. , 44 : 1083 – 1088 .
- Seipenbusch , M. , Binder , A. and Kasper , G. 2008 . Temporal Evolution of Nanoparticle Aerosols in Workplace Exposure . Ann. Occup. Hyg. , 52 : 707 – 716 .
- Sotiriou , G. A , Diaz , E. , Long , M. S. , Godleski , J. , Brain , J. D. Pratsinis , S. E. 2012 . A Novel Platform for Pulmonary and Cardiovascular Toxicological Characterization of Inhaled Engineered Nanomaterials . Nanotoxicology , 6 ( 6 ) : 680 – 690 .
- Tani , T. , Mädler , L. and Pratsinis , S. E. 2002 . Homogeneous ZnO Nanoparticles by Flame Spray Pyrolysis . J. Nanopart. Res. , 4 : 337 – 343 .
- Teoh , W. Y. , Amal , R. and Mädler , L. 2010 . Flame Spray Pyrolysis: An Enabling Technology for Nanoparticles Design and Fabrication . Nanoscale , 2 : 1324 – 1347 .
- Tikkanen , J. , Gross , K. A. , Berndt , C. C. , Pitkanen , V. , Keskinen , J. Raghu , S. 1997 . Characteristics of the Liquid Flame Spray Process . Surf. Coat Tech. , 90 : 210 – 216 .
- Tsantilis , S. and Pratsinis , S. E. 2004 . Soft- and Hard-Agglomerate Aerosols Made at High Temperatures . Langmuir , 20 : 5933 – 5939 .