
Abstract
For a constant aerosol concentration, it is traditionally assumed that a Poisson process describes the behavior of particle detections during sampling and consequently fluctuations in the measured concentration. Recent studies, however, have shown that sampling of micrometer-sized aerosols has non-Poissonian behavior with positive correlations. The validity of the Poisson assumption for nanometer-sized aerosols has not been established and thus was tested in this study. Its validity was tested for four particle sizes—10 nm, 25 nm, 50 nm, and 100 nm—by sampling from indoor air with a differential mobility analyzer-condensation particle counter (DMA-CPC) setup to obtain a time series of particle counts. Five metrics were calculated from the data: pair-correlation function (PCF), scaled clustering index (SCI), coefficient of variation, probability of measuring a concentration at least 25% greater than average, and posterior distributions from Bayesian inference. To identify departures from Poissonian behavior, these metrics were also calculated for 1000 computer-generated Poisson time series with the same mean as the experimental data. For most comparisons, the experimental data fell within the range of 80% of the Poisson-simulation values. Essentially, the metrics for the experimental data were mostly indistinguishable from a simulated Poisson process. The greater influence of Brownian motion for nanometer-sized aerosols may explain the Poissonian behavior observed for smaller aerosols. Although the Poisson assumption was found to be reasonable in this study it must be carefully applied, as the results here do not definitively prove applicability in all sampling situations.
Copyright 2014 American Association for Aerosol Research
INTRODUCTION
Obtaining an accurate measurement of aerosol counts is necessary for researchers in the fields of industrial hygiene, health, and safety protection, air pollution control, sampling of airborne particulates, filtration, etc. (Stainer et al. Citation2004; Kim et al. Citation2007). Current instruments provide real-time concentration measurements by sampling from a volume of air and then estimating particle concentration based on single particle detections. Even with a constant concentration, the number of detected aerosols and inferred concentration will vary from sample to sample because aerosols are stochastically distributed in space (Larsen et al. Citation2003). Traditionally, it is believed that the number of sampled particles is probabilistic and can be described by a Poisson process (Hinds Citation1999; McMurry Citation2000). The probability, P(k|λ), of detecting k number of aerosols in a single sample volume with population mean count, λ, is given by the Poisson distribution displayed in EquationEquation (1) (Ramachandran and Cooper Citation2011).
In aerosol sampling, the Poisson distribution is the expected probability distribution of counts obtained from using an aerosol counting instrument (e.g., optical particle counter [OPC]) over many samples. Two identifying characteristics of a Poisson process are that the mean and variance calculated over all the volumes will be equal and the waiting times between particle detections are distributed exponentially (Larsen et al. Citation2003). It is useful to assume that aerosol sampling behaves according to a Poisson process for several reasons. First, uncertainty in the concentration can then be described as inversely proportional to the square root of the measured count (Ramachandran and Cooper Citation2011). Second, using Bayes’ theorem, the probability distribution and the maximum likelihood value of the population mean count can be found from the measured count. The application of Bayes’ theorem here is especially powerful because the probability of the measured concentration representing the actual concentration can be calculated from one measurement. When sampling with short time periods so that a low number of aerosols are detected, knowledge of the Poisson distribution is helpful.
Due to Brownian motion or other phenomena, the inherent randomness associated with aerosol sampling is expected. However, the Poisson assumption is a strict embodiment of stochastic behavior that requires a perfectly random process so that detections are independent of each other. A Poisson process would only be realized when the probability of detecting a particle is not influenced (i.e., enhanced or inhibited) due to particle detections before it (Shaw et al. Citation2002). Any change in the probability of detecting a particle due to a preceding particle detection indicates that chance described by a Poisson process is not responsible for variability in the measured aerosol concentration. Non-Poissonian behavior of detected aerosols thus makes the relationship between measured concentration and actual concentration unclear.
Although a Poisson process is a convenient model to describe the sampling or detection of aerosols, its validity has not been extensively verified experimentally. Previous works, which have investigated the Poisson assumption, have been related to cloud physics or rainfall events (Kostinski and Shaw Citation2001; Shaw et al. Citation2002; Jaczewski and Malinowski Citation2005). The primary goal of these works was to investigate if cloud droplets/rain were distributed perfectly randomly in space. Additional studies also investigated whether a Poisson process describes the spatial distribution of aerosols but inadvertently examined the sampling nature of micrometer-sized aerosols (Larsen et al. Citation2003; Larsen Citation2007). Although the consensus was that the spatial distribution of aerosols could not be exactly described by a Poisson process, the effect of this in the realm of aerosol sampling was not discussed. Furthermore, only aerosols with sizes greater than 300 nm were considered and they were grouped into relatively coarse size bins by an OPC. These studies did, however, pave the foundation for assessing Poissonian behavior so that its context in nanometer-sized aerosol sampling can be fully examined in this study.
There are several ways to quantitatively determine whether a process is Poissonian but a powerful and routinely used tool is the pair-correlation function (PCF). The PCF can be described in the following manner (Shaw et al. Citation2002; Larsen et al. Citation2003). First, consider two sampling time periods, dt1
and dt2
, which are separated by time t and are defined to be sufficiently small so the chance of containing two or more aerosols in a period is unlikely. For a Poisson process, the probability that a time period contains a particle is then ![]() where T is the total sampling time, N is the total count of aerosols in T. As particle detections are independent of each other, the probability, P(t), of detecting a particle in both time periods is the product of the probabilities of detecting a particle in each time period.
where T is the total sampling time, N is the total count of aerosols in T. As particle detections are independent of each other, the probability, P(t), of detecting a particle in both time periods is the product of the probabilities of detecting a particle in each time period.
If, however, the process is not Poissonian then the probability will be enhanced or inhibited by modifying EquationEquation (2) into EquationEquation (3) (Green Citation1969).
The term η(t) is the PCF which indicates how a time series of particle detections deviates from a Poisson process. A value of η(t) greater than zero means that there is enhancement (positive correlation) of particle detection when time periods are separated by t. For –1 ≤ η(t) < 0, a particle detection at dt1 decreases the chance a particle will be detected t away at dt2 (negative correlation). For the process to be considered Poissonian, the PCF must be zero for all t. A more thorough background of the PCF is discussed in literature and will not be repeated here (Shaw et al. Citation2002; Larsen et al. Citation2003).
When calculating the PCF with an experimental time series, the small time periods dt1 and dt2 cannot be rigorously achieved. Practically, the PCF can be calculated via the operational PCF formula displayed in EquationEquation (4) using particle counts within the smallest sampling period available for the instrument (Kostinski and Jameson Citation2000).
To use EquationEquation (4) with time series data, the total sampling time can be divided into small time periods determined by the instrument resolution. Then, the number of particles in a time period, N(0), can be multiplied by the number of particles in the period that is time t away, N(t). This process is repeated in T for each pair of N(0) and N(t) and the average for all multiplied pairs is calculated. Since time periods as defined above cannot be used in the most precise sense, the time series must satisfy dilute criteria (to be discussed below). In general, using practically obtainable sampling periods causes the exact detection time of a particle to be ambiguous so the calculated PCF is simply an estimation. Besides the dilute criteria, there also must be a sufficient number of particles present in the time series for the calculated PCF to be meaningful.
The PCF shows how the probability of a particle detection differs from the Poissonian case when two sampling periods are separated by some time t, and it is the most rigorous test for the Poisson assumption. Another metric, which is commonly used for assessing perfect randomness, is the scaled clustering index, SCI(s). The SCI indicates how particle detection deviates from a Poisson process over a sampling period with length of s, with deviations near zero being weighted more than near s. The operational formula of SCI is displayed in EquationEquation (5) (Kostinski and Jameson Citation2000; Larsen Citation2012):
The goal of this study was to evaluate whether the actual sampling of nanometer-sized aerosols can be described by a Poisson process. Because of their size, these aerosols are influenced by physical mechanisms (e.g., Brownian motion, air turbulence, electrostatic forces, etc.) differently than micrometer-sized aerosols. Subsequently, their sampling behavior may be very different. From a practical perspective, due to concerns about the health and environmental effects of airborne nanoparticles, it is important to obtain a better understanding of how the particles are sampled (Biswas and Wu Citation2005). To test this hypothesis, a scanning mobility particle sizer (SMPS) was employed to create a time series of particle detections for aerosols of a specific size (10 nm to 100 nm). The time series were then analyzed with the PCF and SCI to get insight into the validity of the Poisson assumption. The PCF, SCI, and other metrics (e.g., coefficient of variation of the concentration, etc.) were calculated from both the experimental time series and a computer-generated Poissonian time series to examine how experimentally measured values could differ from a true Poisson process in nanometer-sized aerosol sampling.
MATERIALS AND METHODS
Obtaining a Time Series of Nanometer-Sized Aerosol Counts
An SMPS (TSI, Shoreview, MN, USA) was used to obtain a time series of aerosol counts because it is able to accurately detect aerosols with sizes of tens of nanometers. Unlike an OPC, it is not limited by low light scattering produced by small aerosols. The SMPS consists of two subsystems: an electrostatic classifier (Model 3080) and a condensation particle counter (CPC; Model 3782). The air to be sampled first enters the classifier due to a vacuum applied by the CPC. Within the classifier, polydisperse aerosols are directed to a bipolar charge neutralizer where they obtain the Boltzmann equilibrium distribution. The aerosols then enter a differential mobility analyzer (DMA) that uses an electric field to only allow aerosols with a specific electrical mobility (i.e., a mobility-classified monodisperse particle) to exit the classifier. For a chosen mobility, the DMA selects aerosols with one positive net elementary charge (although a very small number of multiply-charged aerosols are selected as well). Finally, these monodisperse aerosols are sent to the CPC where they are grown by condensation and counted with an optical detection setup. For nanometer-sized aerosols, the fraction of aerosols containing one net elementary charge was less than 40% at 50 nm and this fraction rapidly decreases with size (Hoppel and Frick Citation1986; Hinds Citation1999). Thus, the number of aerosols undergoing electrophoresis and are then counted decreases with size. In scanning mode, an SMPS can obtain the particle size distribution by automatically varying the electrophoresis voltage. In this study, however, the voltage was kept fixed so that the time series of particle detections for one specified size at a time could be obtained. In this manner, the validity of the Poisson assumption could be examined as a function of size. Aerosols with sizes of 10 nm, 25 nm, 50 nm, and 100 nm were sampled and the resulting time series of particle counts were analyzed.
The CPC recorded particle counts every 0.1 s; this was the shortest sampling time available without creating custom software to extract the pulse signals recorded by the CPC's photodetector. Thus, the presence of non-Poisson behavior for scales shorter than the minimum sampling time (0.1 s in this study) cannot be accurately identified. Also, as mentioned previously, when calculating the PCF, counts are measured and recorded over a 0.1-s sampling period so that the exact arrival of a particle at the detector is not known (Larsen et al. Citation2003). With these limitations, a Poisson process cannot be determined from the data in the fullest sense; however, 0.1 s is sufficient to investigate whether the Poisson distribution is practically appropriate (via analysis of coefficient of variation, etc.) because aerosol concentration measurements are usually taken with sampling periods greater than 0.1 s. Nanometer-sized aerosol sampling is conducted in many different contexts (e.g., ambient aerosol measurements, filter testing, etc.), but in this work, room air will be analyzed as a first study. The instrument was placed inside an empty and locked laboratory room and sampled from the surrounding room air. Sampling was run overnight for about 12 h for each particle size yielding a time series of 4.32 × 10⁵ measurements from 0.432 m3 of sampled air.
Appropriate use of the PCF and Check for Constant Mean Concentration
After obtaining the times series for each particle size, the data were plotted and a subset of data containing 104 measurements (about 16.7 min) were selected which visually appeared to have constant concentration. The datasets were then scrutinized quantitatively for their validity of the following conditions: (1) the concentration is sufficiently dilute, (2) there are a high number of total counted particles in T, and (3) the underlying concentration does not change with time (it is stationary) (Larsen et al. Citation2005). The PCF is most meaningful when none of these conditions are violated. For the SCI and other metrics (to be discussed below), however, only condition (3) needs to be met. Although the Poisson assumption should theoretically be applicable even with a time-varying concentration, assessing its validity is most straightforward with stationary time series.
To satisfy conditions (1) and (2), the following should be true, respectively:
Examination of the data indicated that only the 10-nm time series was reasonably appropriate. In evaluating condition (3), although there have been attempts to establish criteria for constant-concentration data, no protocol exists that guarantees this. Calculation of the PCF and SCI using a time series without constant concentration unintentionally indicates the presence of positive correlations (i.e., both η(t) and SCI > 0) (Larsen Citation2012). In this study, the following necessary, but not sufficient, criteria proposed by Larsen et al. (Citation2005) were used in an effort to classify a dataset as possibly stationary:
Other Calculated Metrics
Besides the PCF and SCI, three other metrics—which have more practical significance in aerosol sampling—were calculated: the coefficient of variation (CV) for a sampling period, the probability of obtaining a concentration at least 25% greater than average, and the posterior distribution for the concentration from Bayesian inference. As mentioned in the introduction, Bayesian inference can be used to determine how likely the measured concentration is the actual concentration given a set of measurements. This is the posterior density, f(μ|x1,…, xm) (the density distribution of obtaining mean concentration, μ, given m samples), found using Bayes’ theorem (Bolstad Citation2007):
To compare how experimental data differed from Poisson data, the metrics were calculated for both the experimental data and for 1000 Poisson simulations with the same mean and number of measurements as the experimental data. The Poisson simulation data were generated from MATLAB's poissrnd() function. For each metric, the maximum and minimum simulation values were plotted as well as the area of the graph containing 80% of the simulation-data values. The graphs compare the experimental data to what are expected from a truly random process and can signify departures from a Poisson process.
RESULTS AND DISCUSSION
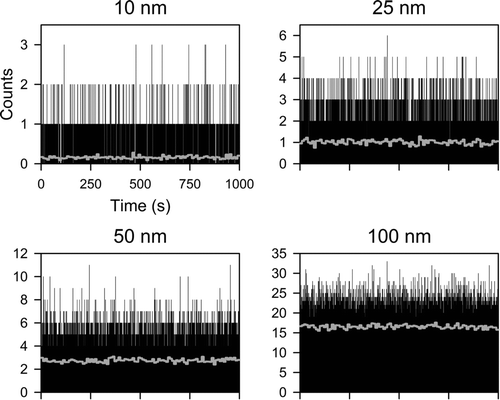
displays the time series of particle counts that were analyzed for each particle size. The gray line indicates the mean count for each 10-s sampling period within the 1000-s time series. For each particle size, the gray line remains relatively constant over the time series and no obvious trend in underlying concentration change can be seen. The average number of detected counts per 0.1 s increased with increasing particle size: 100 nm had the highest at 16.5 #/0.1 s while 10 nm had the lowest at 0.159 #/0.1 s. From ambient air, a higher concentration of smaller nanometer-sized aerosols (<100 nm) is generally expected (Bukowiecki et al. Citation2002; Fromme et al. Citation2007), but the lower average count is because smaller particles have a lower probability of acquiring net charge and undergoing electrophoresis within the DMA. Furthermore, the CPC used in this study has a counting efficiency of 50% for 10-nm aerosols compared to 100% for 100-nm aerosols (Liu et al. Citation2006). However, shows that the time series for each particle size has nearly constant concentration with seemingly random behavior which is suitable for further analysis in this study.
FIG. 1 Count versus sampling time for the tested particle sizes. The gray line indicates the mean count over a 10-s period.
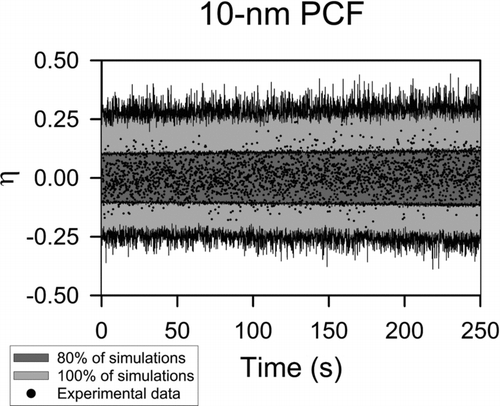
The PCF for the experimental data and the simulations is displayed in . Only the 10-nm PCF was calculated due to the constraints described in the Materials and Methods section. For and the following figures, the dark gray area contains 80% of the simulation values, the light gray area contains 100% of the simulation values (i.e., the black edges of the light gray area represent the range of values obtained from the simulations), and the black dots indicate experimental values. Experimental values are plotted every 0.1 s in the figures when the x-axis is time or sampling time period. First, inspection of the experimental PCF reveals that there is no prevailing positive PCF and criteria a–c were satisfied. In general, the PCF calculated from the experimental data is within the minimum and maximum simulation values and is essentially indistinguishable from the simulations. Overall, the experimental values were consistent to what is expected from a Poisson process (via comparison to the simulations), and this provides first evidence that nanometer-sized aerosol sampling can be described by a Poisson process at least under the conditions tested here.
FIG. 2 The PCF for the 10-nm size. The area containing 80% of the simulation values is shown in dark gray while the area containing 100% of the simulation values is shown in light gray. The experimental PCF is represented by black dots.
shows the SCI. The SCI and following metrics can be calculated for 25-nm, 50-nm, and 100-nm (along with 10-nm) sizes because satisfying the dilute criteria is not required for these metrics. While the x-axis for the PCF represents the time separating two sampling periods, the SCI x-axis represents the length (in s) of the sampling period employed. The SCI was calculated for sampling time periods up to 10 s, which is considerably longer than the time periods used for a single particle size during scanning with an SMPS. For all tested particle sizes, the experimental SCI mostly falls within the area containing 80% of the simulations. An overall trend of positive values for the experimental data is not observed here suggesting that the aerosol concentration remained stable during the time series for all particle sizes.
FIG. 3 The SCI for each particle size.
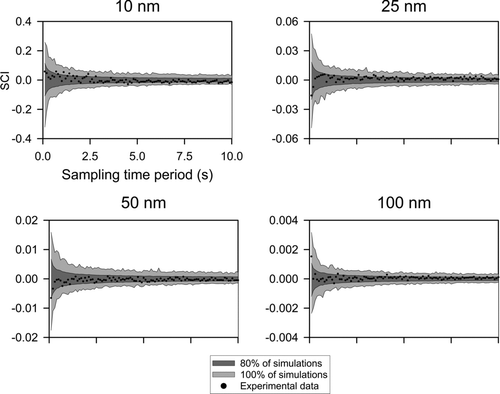
The range of the SCI decreases with increasing particle size; the simulated SCI ranges are about ±0.3 and ±0.003 for 10 nm and 100 nm, respectively. This observation can be explained by examining the signal to noise ratio (SNR) for a purely Poisson process, which is displayed in EquationEquation (12):
displays the CV of counts versus the sampling time period length. Practically, the CV describes how a measured concentration would change from sample to sample (for a specified sampling period) due to random fluctuations. The experimental CV values generally fall within the range of the simulations for all sizes except 10 nm where the CV is lower than what is expected. Besides this occurrence at a sampling time period of about 25 s, the CV is consistently low and outside the range of 80% of the simulated values. A CV lower than a CV for a Poisson process indicates that an aerosol concentration measured on multiple occasions would yield more consistent results causing the standard deviation to be lower than expected. When measuring particle concentration, this may be beneficial because the concentration fluctuation is not as extreme; however, the Poisson distribution cannot be used in determining confidence in a measurement. Influences from the sampling process itself may be responsible for the low CV values.
FIG. 4 The CV values versus sampling time period for the tested particle sizes.
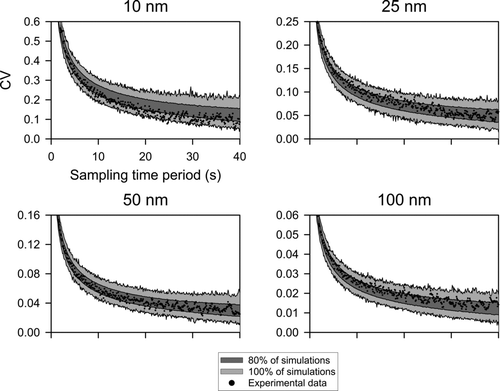
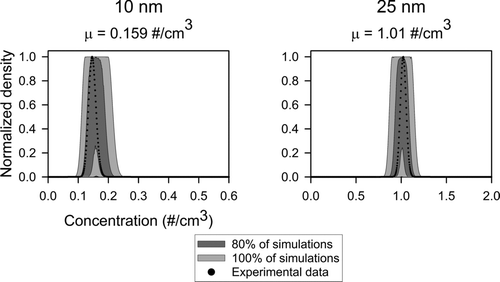
FIG. 5 The normalized posterior distribution from Bayesian inference with sampling time period of 1 s. A total of 100 measurements were used here to form the posterior distributions.
Detection of size-selected particles with the CPC relies on aerosol charging and then selecting charged particles with a specific electrical mobility. Because of their small size, singly-charged 10-nm particles have a relatively high electrical mobility and may be subjected to considerable mutual repulsions which depend on interparticle distance. The self-separating nature could have induced nearly equal separation distance between particles resulting in little variance between sampling periods (i.e., relatively constant detection rate). This hypothesis can be investigated further via inspection of the PCF in . For the lowest value of t (0.1 s), the PCF is positive and this may be indicative of particles being repulsed to the adjacent sampling periods from small-scale clustering. Indeed, the first six consecutive values of the PCF are positive and this stretch of positive values is rare given the oscillating nature of the PCF. Besides the influence of electrostatic forces, other processes during sampling (e.g., fluid forcing, etc.) could have manipulated detections to cause a more consistent detection rate and lower CV values.
In addition to the CV, another practical metric that was calculated from the time series data was the probability (for a specific sampling period length) of measuring a concentration at least 25% greater than the average concentration. These figure panels (Figure S1) can be found in the online supplementary information (SI) and generally show that the experimental data fall within the range of 80% of the simulated values. Therefore, measured extreme concentrations were not more likely than what is expected from a Poisson process. shows the normalized posterior distributions obtained from Bayesian inference with a 1-s sampling period (a similar graph using a 0.1-s sampling period is shown in Figure S2 of the SI). A total of 100 measurements were used to form the posterior distributions—the likelihood that a measured concentration is the actual (population) mean concentration. The population mean concentration, μ, is listed underneath the particle size. For all the conditions, the experimental posterior distributions are mostly within the 80%-range of the simulation values. Thus, Bayesian inference using experimental data does not produce results that are noticeably different from a Poisson simulation.
For accurate inference of μ, the posterior distribution should have a peak at μ and as small a spread as possible. There is a wider spread in the posterior distributions for the 0.1-s sampling period than for the 1-s sampling period since more counts can be accumulated in a 1-s sampling period. The SNR will be increased, and there will be a better prediction of the population mean. A more appropriate prior could have been chosen (e.g., Jeffery's prior or Gamma distribution), but the goal of this study was to compare the output produced by the experimental and simulated data regardless of the prior chosen.
By examining –, this study has shown that the Poisson assumption in nanometer-sized aerosol sampling is mostly valid. A caveat is that the conclusions may only be valid for the tested environmental conditions (temperature, humidity, etc.), location (room air), particle sizes, and sampling instrument (SMPS). Furthermore, the results may only be relevant for the 16.7-min time series examined. The applicability of the Poisson assumption in other sampling situations (e.g., laboratory generated aerosols, outdoor aerosols, etc.) warrants further testing.
Results from previous works with ambient micrometer-sized aerosols show that sampling cannot be accurately described by a Poisson process and positive correlations exist (both PCF and SCI > 0) in some cases (Larsen et al. Citation2003; Larsen Citation2007). Those findings could be produced by two causes: (1) there was a change in underlying aerosol concentration that could not be identified and (2) sampling of micrometer-sized aerosols simply cannot be described by a Poisson process. Cause (1) is possible because the previous studies observed positive correlations, which are what occur from underlying change in concentration. As mentioned above, a change in underlying concentrations results in a higher variance and η(t) > 0; thus, a finding of positive correlations cannot be unequivocally interpreted as non-Poissonian sampling behavior. However, if no underlying concentration change exists, then (2) is valid and there may be a fundamental difference in how micrometer-sized and nanometer-sized aerosols are sampled: nanometer-sized aerosols are sampled according to a Poisson process while micrometer-sized aerosols are not.
The reason for this phenomenon may be explained by Brownian motion—the random motion of aerosols due to collisions with air molecules—which affects both aerosols in a flow and in still air. Smaller aerosols have less mass and so Brownian motion is more influential than for larger aerosols. Ambient nanometer-sized aerosols with spatial correlations may be decorrelated by Brownian motion. During sampling, nanometer-sized aerosols will follow the streamlines in the air-flow, but their path will resemble a “random walk” with a mean transport direction. This movement may cause aerosols to be detected in a random Poisson manner. The results presented in Larsen (Citation2007) and here show that greater correlations occur for larger micrometer-sized aerosols (>1 μm) than for smaller aerosols suggesting that Brownian motion causes the Poissonian detection of nanometer particles. Besides Brownian motion, other size-dependent mechanisms (e.g., electrostatic forces, as mentioned above), possibly induced by the sampling process itself, may also be responsible for determining the sampling nature.
It should be noted that the original goal of previous studies was to determine whether the Poisson process correctly describes the position of ambient aerosols in space (Larsen et al. Citation2003; Larsen Citation2007). An important assumption of these studies was that a time series of particle detections by an OPC could be inverted to infer the spatial distribution of aerosols. However, the findings from these studies must be interpreted carefully because the sampling process can affect the position of aerosols relative to each other. Aerosols entering an OPC will be subjected to the laminar parabolic flow inside the sampling tube causing aerosols at the center of the tube to travel faster than aerosols near the walls. Aerosols will change their positions (and detection time) with respect to each other simply because of the parabolic flow—the very act of drawing air into the OPC. Furthermore, light-scattering instruments rely on a variant of an aerosol focusing lens to make particles converge to the focal point of the laser beam. Thus, the relative spatial structure will not be preserved, and the time series of detections is not a perfect surrogate for spatial distribution. By appealing to the so-called mapping theorem, the authors in previous studies have argued that the sampling process itself cannot introduce deviations into the time series—sampling can only amplify or modify existing deviations (Larsen et al. Citation2004). It is still possible, though, that modest deviations could be sufficiently amplified so that the experimental PCF or other metrics fall outside the range of simulated values. Consequently, here, no attempt is made to infer results about the spatial distribution of ambient nanometer-sized aerosols from the time series data. This study simply investigated the assumption that aerosol sampling—regardless of instrument or how aerosols are manipulated before detection—can be described by a Poisson process. For the conditions tested, this assumption was proved to be mostly valid. Essentially, Poissonian sampling behavior was evaluated directly and so there are no possible artifacts to consider.
CONCLUSIONS
In this study, the validity of the Poisson assumption for sampling of nanometer-sized aerosols was tested. A DMA-selected aerosols with sizes of 10 nm, 25 nm, 50 nm, and 100 nm from indoor air and a CPC detected the aerosols to obtain a time series of counts. Analysis of the time series with the PCF and SCI showed that the experimental data generally produced values within the range of 80% of the Poisson-simulation values. The same result was observed for all the metrics related to concentration measurements except for several 10-nm CV values that were lower than Poisson simulations. The lower CV may be attributed to electrostatic repulsions between the small 10-nm particles causing nearly equal spacing between particles and thus a more constant detection rate. Nanometer-sized aerosol sampling was generally found to be Poissonian, and so non-Poissonian behavior found in previous studies for micrometer-sized aerosols may be due to the inability of Brownian motion to decorrelate the detection of larger aerosols. In summary, this study suggests that the Poisson assumption is mostly valid for nanometer-sized aerosol sampling, but further studies to investigate its validity in other sampling conditions are warranted.
SUPPLEMENTAL MATERIAL
Supplemental data for this article can be accessed on the publisher's website.
Supplementary_files.zip
Download Zip (5 MB)FUNDING
Brian Damit was supported by the National Science Foundation Graduate Research Fellowship (NSF GRF) under grant DGE-0802270. ORNL is managed by UT-Battelle, LLC, for the U.S. Department of Energy under contract DE-AC05-00OR22725.
REFERENCES
- Biswas , P. and Wu , C. Y. 2005 . Nanoparticles and the Environment . J. Air. Waste Manage., , 55 : 708 – 746 .
- Bolstad , W. M. 2007 . Introduction to Bayesian Statistics , Hoboken, N.J : John Wiley & Sons, Inc .
- Bukowiecki , N. , Dommen , J. , Prevot , A. , Richter , R. , Weingartner , E. and Baltensperger , U. 2002 . A Mobile Pollutant Measurement Laboratory Measuring Gas Phase and Aerosol Ambient Concentrations with High Spatial and Temporal Resolution . Atmos. Environ., , 36 : 5569 – 5579 .
- Fromme , H. , Twardella , D. , Dietrich , S. , Heitmann , D. , Schierl , R. Liebl , B. 2007 . Particulate Matter in the Indoor Air of Classrooms— Exploratory Results from Munich and Surrounding Area . Atmos. Environ., , 41 : 854 – 866 .
- Green , H. S. 1969 . The Molecular Theory of Fluids , New York : Dover .
- Hinds , W. C. 1999 . Aerosol Technology: Properties, Behavior, and Measurement of Airborne Particles , New York : Wiley .
- Hoppel , W. A. and Frick , G. M. 1986 . Ion-Aerosol Attachment Coefficients and the Steady-State Charge Distribution on Aerosols in a Bipolar Ion Environment . Aerosol Sci. Tech., , 5 : 1 – 21 .
- Jaczewski , A. and Malinowski , S. 2005 . Spatial Distribution of Cloud Droplets in a Turbulent Cloud-Chamber Flow . Q. J. Roy. Meteor. Soc., , 131 : 2047 – 2062 .
- Kim , S. C. , Harrington , M. S. and Pui , D. Y. H. 2007 . Experimental Study of Nanoparticles Penetration Through Commercial Filter Media . J. Nanopart. Res., , 9 : 117 – 125 .
- Kostinski , A. B. and Jameson , A. R. 2000 . On the Spatial Distribution of Cloud Particles . J. Atmos. Sci., , 57 : 901 – 915 .
- Kostinski , A. B. and Shaw , R. A. 2001 . Scale-Dependent Clustering in Turbulent Clouds . J. Fluid Mech., , 434 : 389 – 398 .
- Larsen , M. L. 2007 . Spatial Distributions of Aerosol Particles: Investigation of the Poisson Assumption . J. Aerosol Sci., , 38 : 807 – 822 .
- Larsen , M. L. 2012 . Scale Localization of Cloud Particle Clustering Statistics . J. Atmos. Sci., , 69 : 3277 – 3289 .
- Larsen , M. L. , Cantrell , W. , Kannosto , J. and Kostinski , A. B. 2003 . Detection of Spatial Correlations among Aerosol Particles . Aerosol Sci. Tech., , 37 : 476 – 485 .
- Larsen , M. L. , Cantrell , W. , Kostinski , A. B. and Kannosto , J. 2004 . Response from Authors to Comment on ‘Detection of Spatial Correlations among Aerosol Particles. . Aerosol Sci. Tech., , 38 : 129 – 130 .
- Larsen , M. L. , Kostinski , A. B. and Tokay , A. 2005 . Observations and Analysis of Uncorrelated Rain . J. Atmos. Sci., , 62 : 4071 – 4083 .
- Liu , W. , Kaufman , S. L. , Osmondson , B. L. , Sem , G. J. , Quant , F. R. and Oberreit , D. R. 2006 . Water-Based Condensation Particle Counters for Environmental Monitoring of Ultrafine Particles . J. Air Waste Manage., , 56 : 444 – 455 .
- McMurry , P. H. 2000 . A Review of Atmospheric Aerosol Measurements . Atmos. Environ., , 34 : 1959 – 1999 .
- Ramachandran , G. and Cooper , D. W. 2011 . “ Size Distribution Data Analysis and Presentation ” . In Aerosol Measurement: Principles, Techniques, and Applications , Edited by: Kulkarni , P. , Baron , P. A. and Willeke , K. 488 Hoboken, New Jersey : John Wiley & Sons, Inc .
- Shaw , R. , Kostinski , A. and Larsen , M. 2002 . Towards Quantifying Droplet Clustering in Clouds . Q. J. Roy. Meteor. Soc., , 128 : 1043 – 1057 .
- Stainer , C. O. , Khlystov , A. Y. and Pandis , S. N. 2004 . Nucleation Events During the Pittsburgh Air Quality Study: Description and Relation to Key Meteorological, Gas Phase, and Aerosol Parameters . Aerosol Sci. Tech., , 38 : 253 – 264 .