
Abstract
We developed a laser induced incandescence–mass spectrometric analyzer (LII-MS) for online measurements quantifying the aerosol chemical compositions with respect to the mixing state of black carbon (BC). The LII-MS is developed as a tandem series comprising an LII chamber to detect and vaporize BC-containing particles and a particle trap laser desorption mass spectrometer (PT-LDMS: Takegawa et al. 2012). The PT-LDMS collects aerosol particles transferred from the LII chamber and quantifies the chemical compositions. A newly designed collection probe, coupled with the sheath-air inlet nozzle of the LII chamber, enables a high throughput of aerosol particles without significant dilution. Total aerosol particles can be analyzed in the PT-LDMS by turning off the laser (MS mode), and the aerosol particles externally mixed with BC can be analyzed by turning on the laser (LII-MS mode). The difference in the PT-LDMS signals between the MS and LII-MS modes yields the chemical composition of materials internally mixed with BC. Performance of the developed instrument was evaluated in the laboratory by generating BC particles internally-mixed with oleic acid (OL) and BC particles externally mixed with ammonium sulfate particles. Preliminary results from ambient measurements are also presented and discussed.
Copyright 2014 American Association for Aerosol Research
1. INTRODUCTION
Atmospheric aerosols affect the radiative balance of the Earth's atmosphere. Black carbon (BC) aerosols strongly absorb solar radiation and contribute to the heating of the atmosphere (Haywood and Shine Citation1995). They can also act as cloud condensation nuclei depending on their mixing states (Kuwata et al. Citation2007). The mixing state of BC can be altered by condensation of organic and inorganic materials during the process of atmospheric aging. The condensed materials can enhance the light absorption cross section of BC (Fuller et al. Citation1999). The BC mixing state is therefore a key physicochemical property that can be analyzed to estimate the radiative impacts of BC aerosols (Bond and Bergstrom Citation2006; Adachi et al. Citation2010; Lack and Cappa Citation2010; Bond et al. Citation2013).
At present there are several techniques used for the analysis of particles. Electron microscopy is a common technique used for investigating the morphology and mixing state of individual BC particles with sample pretreatment techniques (Okada et al. Citation2001; Ebert et al. Citation2002). A volatility tandem differential mobility analyzer (V-TDMA) system (Orsini et al. Citation1999; Philippin et al. Citation2004) has been used for online quantification of the coating thickness of the nonvolatile core including BC and some crustal materials. In addition, a laser induced incandescence method (LII) has been used for the online detection of BC and certain metals (Stephens et al. Citation2003). The Single Particle Soot Photometer (SP2, Droplet Measurement Technology (DMT), Boulder, USA), which is a commercially available LII BC analyzer, has been used for investigating the concentration and mixing state of BC (Baumgardner et al. Citation2004; Schwarz et al. Citation2006, 2010; Moteki and Kondo Citation2007; Sedlacek et al. Citation2012). However, the V-TDMA and SP2 are not able to quantify the chemical composition of materials that are internally mixed with BC. Onasch et al. (Citation2012) have recently reported a new instrument that combine an Aerodyne aerosol mass spectrometer (AMS) with a solid state laser cavity used in a DMT SP2 (soot particle-aerosol mass spectrometer, SP-AMS). The laser cavity is thus incorporated inside the vacuum chamber, so that the crossing point of the laser and particle beam axes match with the ionization section of the Aerodyne AMS. Although the SP-AMS can directly measure the chemical composition of aerosol particles internally mixed with BC, there are some important issues associated with its use that may introduce significant uncertainties, such as the incomplete overlap of the laser and particle beams.
We developed a laser induced incandescence-mass spectrometric analyzer (LII-MS); a new method for use in quantifying the aerosol chemical composition classified by the mixing state of BC. The LII-MS consists of a series of a LII analyzer that selectively detects/vaporizes BC-containing particles, and a particle trap laser desorption mass spectrometer (PT-LDMS: Takegawa et al. Citation2012), which analyzes the chemical compositions of the aerosol particles transported from the LII analyzer. The major purpose of this study is to describe the concept of the instrument, and to present a preliminary evaluation of the performance of the LII analyzer, the PT-LDMS, and their combined use in the laboratory and during ambient measurements. Laboratory experiments and ambient deployment have been conducted to evaluate the performance of the LII analyzer, PT-LDMS, and their combination. Details of the experimental setups are presented in the online supplemental information.
2. INSTRUMENTATION
2.1. Configuration of the LII-MS
shows a schematic diagram of the LII-MS. The LII analyzer, which was designed and assembled by Fuji Electric Co. Ltd., is a simplified version of that presented in Moteki et al. (Citation2011), and is similar to a DMT SP2 (Schwarz et al. Citation2006; Moteki and Kondo Citation2007, Citation2010). The major differences with that of Moteki et al. (Citation2011) are that it has a shorter laser cavity (240 mm) and simplified optical detectors. The optical system has only three detectors: a photomultiplier tube (H10720-210, Hamamatsu Photonics K. K., Japan) for thermal emission, an avalanche photodiode (S8890-30, Hamamatsu Photonics K. K., Japan), and a photodiode (S5739, Hamamatsu Photonics K. K., Japan) for light scattering. A long-path filter (>0.42 μm) is placed in front of the PMT (corresponding to the broadband detector in the SP2). The pre-amplifier of each detector has both high and low gain outputs in order to achieve a wide dynamic range of particle size and mass. Only pulse height data from the light scattering and thermal emission (LII) signals of single particles are recorded by custom-made software. Quantification of the coating thickness of the BC-containing particles (Moteki and Kondo Citation2008) will be conducted in future studies. The conversion of LII signals to the mass of BC particles was not done using an aerosol particle mass analyzer (APM) as suggested by Moteki and Kondo (Citation2010). The number concentrations of BC-containing particles with a mobility diameter larger than ∼0.1 μm are calculated.
FIG. 1. Schematic diagram of the LII-MS system which graphically describes how aerosol particles are analyzed by the PT-LDMS using two modes; whole aerosol particles are analyzed in the PT-LDMS by turning off the laser (MS mode), and BC-free particles only are analyzed by turning on the laser (LII-MS mode).
A cross-sectional view of the LII analyzer is schematically shown in . The LII analyzer uses the sheath-air inlet nozzle presented in Moteki et al. (Citation2011), which ensures that the particle jet is confined by the particle-free sheath air flow. The inner diameter of the inner tube is 0.4 mm, and this can therefore be considered as the upper limit of the particle jet width in relation to focusing by sheath air. The flow rates of the sample and sheath air are 0.11 and 0.5 liter per minute (lpm), respectively. The jet velocity is estimated to be ∼40 m s−1 considering the width of laser beam (∼1 mm at e−2) and the width of the light scattering signals. The filtered purge air (at 0.05 lpm) is introduced in the laser cavity to avoid contamination on the surface of the ultra-high reflectance mirrors (>99.99%).
FIG. 2. Cross-sectional view of the schematic of the LII analyzer and the collection probe used in this study.
A collection probe is newly designed to recover the aerosol sample flow with any small changes in aerosol concentration (). The collection probe consists of two coaxial tubes and is similar to the sheath-air nozzle; the center tube is intended to isolate and collect the aerosol flow separately from the sheath flow. The sample flow rate is limited by the critical orifice of the PT-LDMS, which is placed downstream of the LII analyzer. The remaining sheath flow is drawn through the space between the center and the outer tubes, which is referred to as the excess flow (). The outer tube also acts as a shroud to guide the aerosol and sheath flows, and this is useful to account for any small misalignments of the axes of the sheath-air nozzle and the separation probe. The inner diameters of the center and the outer tubes are designed so that the air velocities in the two flows can be nearly identical (are therefore isokinetic). The inner diameter of the center tube and outer tube are 0.5 mm and 1.4 mm, respectively, and the estimated air velocity is ∼8 m s−1. When there is a longer distance from the exit of the nozzle inlet to the entrance of the outlet, there is a more significant dispersal of the particle jet. The distance in the LII analyzer presented here is determined to be 5 mm in consideration of the possible interference between the inlet/outlet structure and the laser beam.
The PT-LDMS, as designed by the University of Tokyo and assembled by Fuji Electric Co. Ltd., is a simplified version of that in Takegawa et al. (Citation2012). Details of the modified system will be presented elsewhere (Takegawa et al., “Evaluation of a Particle Trap Laser Desorption Mass Spectrometer (PT-LDMS): Quantification of Sulfate Aerosol,” manuscript in preparation). The time for sampling and analysis (including laser irradiation and cooling) is nominally set at 7 min and 8 min, respectively, resulting in a data acquisition interval of 15 min. The analysis procedure includes a waiting time for stabilizing background signals (2.5 min) after closing the inlet valve, and for cooling the particle trap before beginning sampling (4.5 min). The actual time interval of the laser irradiation is 1 min. The evolved gas is analyzed with the aerosol inlet closed in order to reduce the background signals of major gas molecules such as N2+ (m/z 28), 15N2+ (m/z 30), and CO2+ (m/z 44) (Takegawa et al., Citation2012). The particle trap is coated with platinum (Pt) to catalytically oxidize organic compounds mainly to carbon monoxide (CO) and/or carbon dioxide (CO2). Detection of organic compounds based on m/z 44 signals has been briefly discussed in Takegawa et al. (Citation2012).
2.2. Data Processing
Ion signals at m/z 14 (N+), 28 (CO+), 30 (NO+), 41 (C3H5+), 44 (CO2+), 48 (SO+), 55 (C4H7+), 57 (C4H9+), and 64 (SO2+) were monitored in laboratory experiments and in ambient measurement. Integrated values of the ion signal at m/z above the background level (Qm/z, Takegawa et al. Citation2012) were used to derive the mass concentration for each species. Q30, Q48, and Q28 were selected for the quantification of nitrate, sulfate, and organic carbon (OC) mass concentrations, respectively. The Qm/z values with and without particle loadings (hereafter referred to as sample and zero [filtered] air) were then measured; the latter is probably due to laser-induced artifacts originating from the particle trap, on which small but non-negligible amounts of contaminations (including carbon, sulfur, and other elements) are likely to have been adsorbed during the machining process. The difference between the Qm/z values for the sample and zero air (ΔQm/z) thus yields the net signal originating from the collected particles. It should be noted that the ion signals are not converted to the mass concentration because the absolute calibration method is still an issue undergoing consideration (Takegawa et al., manuscript in preparation). This is especially important for the quantification of ambient OC because the oxidation efficiencies for various organic compounds during the laser desorption process have not yet been fully tested. In this study, only ΔQ28 values from laboratory experiments are shown and discussed in this article.
The schematics of the LII-MS operations are also shown in . When the laser is turned off, the LII analyzer with the newly developed collection probe can directly transfer sampled air to the PT-LDMS (MS mode). The PT-LDMS collects the aerosol particles transported from the LII analyzer and then quantifies chemical compositions. When the laser is turned on, BC-containing particles can be almost fully vaporized in the LII analyzer and remaining BC-free particles are then transferred to the PT-LDMS (LII-MS mode). The difference in the values of ΔQm/z between the MS and LII-MS modes yields the chemical compositions of the materials internally mixed with BC.
2.3. Differences in the Vaporization/Analysis of BC-Containing Particles Between the LII-MS and SP-AMS
A comparison of LII-MS and SP-AMS with respect to the vaporization process and analysis of BC-containing particles is briefly summarized in . The major differences found in the vaporization of BC are the operating pressure and the method used to introduce aerosol particles to the laser beam. It is of note that the width of the LII laser for the LII-MS (FWHM of ∼0.6 mm (∼1 mm at e−2)) is neatly the same as that for a SP-AMS (FWHM of ∼0.56 mm; Onasch et al. 2012), even though the design of the laser cavity is different in these instruments. Energy conservation with regard to the LII process can be found in previous studies (Michelson Citation2003). Convective heat transfer, which is one of the key physical processes to cool the heated BC-containing particle in the laser field, can be negligible in the SP-AMS. Energy loss through particle vaporization (Moteki and Kondo Citation2007) should not be drastically varied with changes in operating pressure. There is a difference in the methods used to introduce the particle beam into the laser vaporization chamber, and its process is important for interpreting the vaporization process of BC-containing particles. Aitken/coarse mode and/or irregular-shaped particles are not able to be well-focused under typical pressure conditions (1∼2 torr) in the aerodynamic lens (ADL). Diffusion and inertial motion are key factors controlling the lower and upper limit of the size cut, respectively (Zhang et al. Citation2004). However, a sheath-air inlet nozzle has been widely used for optical detection under atmospheric pressure conditions (Kaye et al. Citation2000; Stephens et al. Citation2003) and as such has a much better focusing capability for particles with diameters ranging from 0.1 to a few microns than ADL. illustrate the overlap between the laser and particle beams in the vaporization chamber for both the LII-MS and SP-AMS (the particle beam width for the ADL used in SP-AMS was quoted from Huffman et al. Citation2005). It is clear that the major fraction of particles can be efficiently vaporized in the LII-MS, while a substantial fraction of particles may be incompletely overlapped by the laser beam within SP-AMS, especially when the particle shape is nonspherical (DeCarlo et al. Citation2004). Furthermore, the type (or shape) of BC-containing particles could affect the ionization efficiencies of BC-containing particles as shown in of Onasch et al. (Citation2012).
Table 1. Comparison of LII-MS and SP-AMS from the viewpoint of a vaporization/analysis of a BC-containing particle
FIG. 3. The overlap of the laser beam field with particle beam in the SP2 and SP-AMS: (a) cross sectional view (left); (b) overhead view (right). The laser beam propagates in the +x and −x directions along the x-axis, and the aerosol particles flow in the −z direction along the z-axis. The particle beams for SP-AMS were illustrated using the Gaussian sigma values for pure oleic acid (OL) and soot particles given in Huffman et al. (Citation2005).
FIG. 4. A schematic of the measurement cycle used in this study. Solid, shaded, and open circles are the data sampling with the MS (LII laser off), LII-MS (LII laser on) modes, and zero air, respectively. The difference between the dashed line (linear interpolation of the MS modes) and the shaded circle indicate the mass concentration internally mixed with BC.
FIG. 5. Size-dependent instrumental transfer function for the LII-MS system and typical volume size distribution in various atmospheric environments. (a) Throughput efficiency of the LII analyzer (TELII) for PSL particles (circles) as a function of Da with a visual guide (bold shaded line); (b) transmission/collection/vaporization efficiency of the PT-LDMS (TEADL·EffMS) for ammonium sulfate (diamond markers) and potassium nitrate (triangle markers) as a function of Da with a visual guide (bold shaded line); (c) aerosol volume size distributions in urban (black line, left axis), rural (shaded line, right axis), and remote continental (dashed line, right axis) atmosphere (data taken from Seinfeld and Pandis, Citation2006). Da for the data in 5c is estimated assuming the particle density of 1500 kg m−3 and a spherical shape. The estimated transmission efficiency of the LII-MS system (TELII ·TEADL·EffMS) is shown as a bold shaded line (second left axis).
FIG. 6. Detection efficiency of BC-containing particles (open circle: propane flame soot; filled square: undenuded fullerene) as a function of the mobility diameter. The error bars depict the uncertainty derived from the accuracy of CPC (10%). MPP in the top axis is estimated by the effective density of undenuded fullerene particles (Lot# FS12S011) as given by Gysel et al. (Citation2011).
Another important difference can be found in the quantification methods used for BC and condensed materials (). The LII-MS quantifies the mass concentrations of BC at the LII section using incandescence signals, which is the same principle as a DMT SP2. The mass concentrations of condensed materials are quantified at the MS section by the laser desorption followed by electron impact ionization mass spectrometry (EI-MS). The difference in the mass spectral signals between when the laser is on and off yields the mass concentrations of the condensed materials. The advantage of the LII-MS is that the vaporization efficiency of BC-containing particles is independent of particle morphology because of the sufficient overlap of the particle and LII laser beams. However, the disadvantages of this system are that the quantification of condensed materials is indirectly performed and that the cycle of the alternative operation modes typically takes about one hour as it is limited by the particle collection and the subsequent analysis sequence in the MS section.
In contrast, SP-AMS quantifies the mass concentrations of BC using the laser vaporization of BC and condensed materials and the subsequent analysis of the evolved gases using EI-MS. The mass concentrations of nonrefractory materials externally mixed with BC are quantified using the same method as an Aerodyne AMS (i.e., combination of tungsten vaporizer and EI-MS). The advantage of SP-AMS is that it can directly quantify the condensed materials and can provide continuous data (with a typical resolution of minutes), but the disadvantage of SP-AMS is that the particle collection efficiency and thermal decomposition patterns of nonrefractory compounds are different between the laser and tungsten vaporizers and that the vaporization efficiency of BC-containing particles depend on particle morphology because of the insufficient overlap of the particle and LII laser beams (as indicated by Onasch et al. Citation2012).
3. EXPERIMENTAL
3.1. Size-Dependent Particle Detection Efficiency of the LII-MS
The overall particle detection efficiency of the LII-MS was determined by combining the transmission efficiencies of the LII analyzer (TELII), transmission efficiencies of the ADL (TEADL), and collection/vaporization efficiencies of particles in the PT-LDMS (EffMS). TELII as a function of the particle diameter was evaluated using dry mono-disperse polystyrene latex particles (PSL, Size Standard Particles, JSR Corporation) with sizes ranging from 0.1 to 0.8 μm. The product of TEADL and EffMS was evaluated using dry, mono-disperse ammonium sulfate and potassium nitrate. This section mainly focuses on the transmission efficiency of accumulation-mode particles (∼0.1–1.0 μm in aerodynamic diameter in transition regime [Da]).
3.2. Analysis of Aerosol Composition Classified by the BC Mixing State
The incandescence temperature of BC-containing particles under atmospheric pressure conditions has been estimated to be 3000–4000 K in previous studies (Stephens et al. Citation2003; Schwarz et al. Citation2006). This temperature is much higher than the boiling or sublimation points of atmospherically relevant materials such as ammonium sulfate and therefore, the detection capability of BC-containing particles by the LII analyzer can be considered as the lower limit of the vaporization efficiency of condensed materials. Undenuded fullerene (stock number: 40971, lot number: G25N20, Alfa Aesar Inc.) and propane flame soot particles generated using a mini-CAST (Jing Corp., Switzerland) were selected as test compounds.
Dry, mono-disperse azelaic acid (C9di, Wako Chemicals), fullerene, and propane flame soot particles with mobility diameter (Dmob) of 0.25 μm were introduced into the PT-LDMS to examine the response to carbonaceous aerosols. Results showed that the PT-LDMS detected no significant signals from fullerene and propane flame soot particles under typical operating conditions (the temperature of the particle trap irradiated by the CO2 laser was estimated to be ∼600˚C using a radiation thermometer).
We then tested the vaporization of aerosol compounds internally mixed with BC using propane flame soot particles coated with oleic acid (OL, Wako Chemicals) of various core and shell diameters (DC and DS, respectively) as classified by a tandem DMA system. The detection of aerosol particles externally mixed with BC was also tested using AS and fullerene particles; diameters (Dmob) of AS and fullerene particles were both 0.25 μm.
3.3. Effect of the Location of BC in a Particle on the Vaporization of Condensed Materials
Moteki and Kondo (Citation2007) first showed the possibility of partial vaporization of large BC-containing particles in the laser cavity of the SP2 (in particular of Dmob > 0.4 μm). This phenomenon can be caused by the localized position of BC in a particle, resulting in the breakup of the BC-containing particle into heated BC and other light-scattering material in the course of the laser irradiation (these other material are then transferred to the analysis section in the LII-MS). This can lead to the possible underestimation of the mass of the material that internally mixed with BC. Sedlacek et al. (Citation2012) have recently suggested the presence of such BC particles in air mass affected by biomass burning.
The number fraction of particles not vaporized in the LII analyzer was investigated as a function of Dmob of OL-coated fullerene particles. The number concentrations of BC-containing particles were measured using an optical particle counter (OPC, KC-01E, RION Co., Ltd.). Their inner and outer diameters were 0.3 μm and 0.3–0.5 μm, respectively. In addition, the OL-coated fullerene particles with outer Dmob larger than 0.4 μm tended to have a non-core-shell structure (Moteki and Kondo Citation2007).
3.4. Ambient Measurement
Ambient measurement using the LII-MS was conducted at a building on the campus of the Research Center for Advanced Science and Technology, the University of Tokyo (35º39´N, 139º40´E). A sulfate particle analyzer (SPA, model 5020, Thermo Scientific, Inc.) was operated for the period of 15–17 March 2013. The sulfate mass concentrations measured using the SPA (SO4SPA) were compared with measurements of Q48 (SO+) under the MS mode. Further measurement of the BC-mixing-type-resolved composition was conducted throughout the period of 23–25 March 2013. During this period, the LII laser was gradually degraded, but the laser power was high enough (within 5% reduction) to vaporize the internally mixed materials and detect BC particles until the noon of 24 March 2013. We therefore only had the opportunity to analyze observed data during a limited time period (from 00:00 on 23 March to 12:00 on 24 March 2013). We used a particle soot absorption photometer (PSAP) with a thermodenuder heated up to 300°C (Kondo et al. Citation2009; Irwin et al. Citation2013) to measure the mass concentrations of BC during the observation period. A PM2.5 cyclone (URG-2000-30EH, URG Corp.) was used for the inlet of the LII-MS, SPA, and PSAP.
The exhaust port of the LII analyzer was switched to an alternative flow line (the same flow rate as the PT-LDMS) to maintain generation of the particle jet in the laser cavity when the PT-LDMS inlet was closed. Filtered air was introduced into the LII-MS system once an hour to determine the zero levels of the PT-LDMS. The signal evolution of the zero air data before and after CO2 laser irradiation was fitted to that of the sample air data, and the fitted zero air data were then subtracted from the sample air data to calculate ΔQm/z for each analysis sequence.
shows the schematic of the measurement cycle used in this study. We estimated the mass concentration of each compound for whole particles () under the LII-MS mode (t = tn+2 and tn+3) in order to calculate the mass concentration of compounds internally mixed with BC. The values of
and
were estimated by linearly interpolating between
and
. The difference between
and
was then defined as the mass concentration of compounds internally mixed with BC at the time of t.
4. RESULTS
4.1. Transmission Efficiency of the LII-MS System
TELII of PSL particles was shown as a function of Da in . It is found that a large fraction of the accumulation mode particles (60% or more) with no large size-dependence was transferred into the PT-LDMS. Higher TELII of the larger PSL particles (especially the 0.8-μm-PSL) is likely to be due to the larger inertia of these particles than of smaller particles. The ratio of the flow rate of sample air to that of the sheath air for the nozzle inlet is typically 0.1–0.2 (shaded area in ), which is the lower limit of the throughput efficiency determined by the complete mixing of the particle jet with the sheath air flow. The observed TELII was clearly higher than this limit.
The combination of TEADL and EffMS for the PT-LDMS is shown as a function of Da (0.4–1.0 μm) in . The value at Da of 1 μm was ∼0.6; hence, the upper size cut of the PT-LDMS can be approximated as PM1.
Typical volume-size distributions under various atmospheric conditions (Seinfeld and Pandis Citation2006) are shown in for comparison with the transmission efficiency of the LII-MS. Note that TEADL·EffMS at Da of 0.1–0.35 μm was assumed to be unity (Liu et al. Citation2007). The combination of these lines can be regarded as the overall transmission efficiency of the LII-MS (). It is therefore suggested that the LII-MS can efficiently sample and analyze a major fraction of accumulation mode particles (> ∼60%).
4.2. Detection Efficiency of BC-Containing Particles by the LII Analyzer
depicts the detection efficiency of selected BC particles as a function of Dmob. The mass of particle (MPP) (top axis in ) with respect to each Dmob was estimated assuming the effective density of fullerene particles given in Gysel et al. (Citation2011). The current setup of the LII analyzer is able to detect more than 90% of BC particles with MPP of ≥∼1 fg (corresponding to mass equivalent diameter of ≥0.08 μm). Contribution of ultrafine particles (<0.1 μm) to the total mass of PM2.5 would be less than a few percent under typical urban conditions (Cabada et al. Citation2004; Stanier et al. Citation2004).
4.3. Detection of Carbonaceous Aerosols by the PT-LDMS
shows the relationship between ΔQ28 and the carbon mass accumulated on the particle trap for C9di. The ΔQ44/ΔQ28 ratio was found to be nearly constant (0.62 ±0.05). ΔQ28 were linearly well correlated (r2 = 0.99) with the introduced C9di carbon mass. The sum of hydrocarbon peaks (ΔQoc,CH = ΔQ41 (C3H5+), ΔQ55 (C4H7+), and ΔQ57 (C4H9+)) and the sum of oxidized peaks (ΔQoc,OX = ΔQ28 (CO+) and ΔQ44 (CO2+)) should be used as an indicator of the oxidation degree during the laser desorption process. The average ratio of ΔQoc,CH to ΔQoc,OX was ∼0.01. The ΔQoc,CH/ΔQoc,OX ratio for C9di from the standard mass spectra given by the NIST chemistry webbook (http://webbook.nist.gov/chemistry/), and an Aerodyne quadruple-AMS (Q-AMS) (Takegawa et al. Citation2007) are ∼10 and ∼1, respectively. This difference was attributed to the catalytic property of the Pt-coating on the particle trap.
FIG. 7. The relationship between ΔQ28 (Q28 for zero air = ∼4000 pC [±∼15%]) and the accumulated carbon mass of 0.25-μm azelaic acid particles.
![FIG. 7. The relationship between ΔQ28 (Q28 for zero air = ∼4000 pC [±∼15%]) and the accumulated carbon mass of 0.25-μm azelaic acid particles.](/cms/asset/2cbfc7f6-d31b-4497-aa22-54da2aa2ddad/uast_a_937477_f0007_b.gif)
4.4. Tandem Analysis of Internal/External Mixture of BC and other Compounds by the LII-MS
shows the relationship between ΔQ28 and the OC mass of OL internally mixed with propane flame soot obtained by both MS and LII-MS modes. The organic signals for the MS mode showed a positive correlation with the carbon mass of OL. The scatter in the correlation (r2 = 0.84) was somewhat larger than that in the C9di (). This may be due to the assumption of spherical, core-shell structure of particles used to estimate the mass of OL. No significant enhancement of ΔQ28 above zero was found in the LII-MS mode, regardless of the mass of OL introduced in the system. This result demonstrates proof of the concept that BC-containing particles are almost fully vaporized before they are transferred to the MS section when the LII laser is turned on. The linear regression slope of ΔQ28/OC for OL is smaller than that for C9di (4.5 × 10³) with the observed TELII of ∼0.6, which could be related to the difference in the oxidation efficiency between OL and C9di. Further characterization of the performance of the particle trap is needed for the better quantification of OC mass concentrations.
FIG. 8. (a) The correlation plot of ΔQ28 (Q28 for zero air = ∼19,000 pC [±∼15%]) with sampled carbon mass of OL coating for the BC-containing particles with variable DC and DS in the MS (filled markers) and LII-MS (open markers) modes. DC in the experiment was selected as 0.1 (circle), 0.15 (square), and 0.25 μm (diamond). Texts added to the data points indicate DS of the OL-coated BC particles. (b) Correlation plot of the ΔQ48 (Q48 for zero air = ∼100 pC [±∼16%]) with sampled mass of sulfate under the MS (filled circles) and LII-MS (open circles) modes. Filled triangle markers in both figures depict data for zero air sampling. All linear regression lines in (a) and (b) are forced through the origin.
![FIG. 8. (a) The correlation plot of ΔQ28 (Q28 for zero air = ∼19,000 pC [±∼15%]) with sampled carbon mass of OL coating for the BC-containing particles with variable DC and DS in the MS (filled markers) and LII-MS (open markers) modes. DC in the experiment was selected as 0.1 (circle), 0.15 (square), and 0.25 μm (diamond). Texts added to the data points indicate DS of the OL-coated BC particles. (b) Correlation plot of the ΔQ48 (Q48 for zero air = ∼100 pC [±∼16%]) with sampled mass of sulfate under the MS (filled circles) and LII-MS (open circles) modes. Filled triangle markers in both figures depict data for zero air sampling. All linear regression lines in (a) and (b) are forced through the origin.](/cms/asset/271359df-19cb-4b27-b09f-7842bbd64c1f/uast_a_937477_f0008_b.gif)
Mono-disperse AS particles externally mixed with mono-disperse fullerene particles were introduced to the LII-MS. shows the relationship between ΔQ48 (SO+) and sulfate mass obtained in both the MS and LII-MS modes. No significant differences were found in the correlation of ΔQ48 with sulfate mass. This result again demonstrates that BC-free particles are not affected by the LII laser, and are transferred to the MS section.
4.5. Vaporization of Non-Core-Shell BC-Containing Particles
depicts the number fraction of OL-coated fullerene particles remaining in the LII analyzer (NFR) when the LII laser is turned on. NFR was calculated by the changes in the number concentration of tested particles by turning on and off the laser in the LII analyzer. For bare and thinly coated fullerene, the OPC can detect few particles (NFR is less than 1%) when the laser is turned on. The values of NFR for larger BC-containing particles, a fraction of which have non-core-shell structure, were significantly higher than that for bare fullerene. However, in cases where the non-core-shell BC-containing particles are dominant, the LII-MS can underestimate the mass concentrations of compounds internally mixed with BC.
FIG. 9. Number fraction remaining for the OL-coated BC particles as a function of the shell diameter (DC = 0.3 μm in Dmob). Thickly coated particles tend to have the structure of the localized BC on the particle as suggested by Moteki et al. (2007).
4.6. Ambient Measurement
shows temporal variations of sulfate mass concentrations (SO4SPA) obtained by SPA and ΔQ48 measured by the LII-MS on 15–17 March 2013. The system was operated in the MS mode (LII laser off). The two independent measurements tracked reasonably well during this period. It is suggested that the size dependence of TELII would not significantly affect the quantification of the relative mass concentration of poly-disperse aerosols during this period.
FIG. 10. Comparison of the sulfate mass concentration (left axis, gray line) with ΔQ48 (Q48 for zero air = ∼100 pC [±∼16%]) (right axis, black markers) under the MS mode for the period of 15–17 March, 2013.
![FIG. 10. Comparison of the sulfate mass concentration (left axis, gray line) with ΔQ48 (Q48 for zero air = ∼100 pC [±∼16%]) (right axis, black markers) under the MS mode for the period of 15–17 March, 2013.](/cms/asset/86f1f8a5-36e7-4d24-b39a-7bce95007914/uast_a_937477_f0010_b.gif)
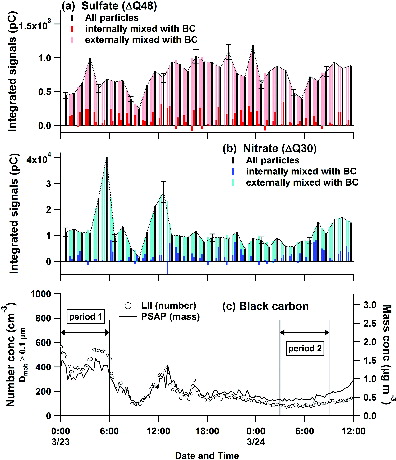
show the relative variations in the mass concentration of sulfate (ΔQ48) and nitrate (ΔQ30) classified by the BC-mixing type for the observation period (23–24 March 2013), respectively. Temporal variations of the BC number (Dmob ≥ 0.1 μm), and mass concentrations measured by LII-analyzer and PSAP, respectively, are also shown in . A large fraction of the subtracted relative intensities of sulfate and nitrate internally mixed with BC show positive values (>∼85% of the observed data). It is therefore suggested that the LII-MS successfully measured the mass of sulfate and nitrate internally mixed with BC.
FIG. 11. Temporal variations of relative concentrations of: (a) sulfate; (b) nitrate for BC-free (light colored bars), BC-containing (dark colored bars), and all (black bars) particles; (c) number (open circles, left axis) and mass concentrations (line, right axis) of BC during the measurement period of 23–24 March 2013.
5. DISCUSSION
A possible error can occur in the estimation of the mass concentration and fraction of sulfate and nitrate internally mixed with BC. This error is primarily due to the subtraction of the mass concentrations between the laser on and off modes. The linear interpolation method may yield substantial uncertainties, when the mass concentration are close to the limit of detection (LOD), or show large temporal variability within a short time period. The values of LOD for nitrate and sulfate under the current instrumental setup were estimated to be ∼1200 pC (0.14 μg m−3) and ∼30 pC (0.03 μg m−3), respectively. In this study, almost all data showed higher concentrations of nitrate and sulfate than these LODs. The precision is estimated to be 10% and 15% for sulfate and nitrate, respectively. We consider the relative changes in the mass concentration during a cycle of the laser on/off modulation as a measure of the uncertainties. The rate of relative concentration changes (R) at time tn+2 (also tn+3) are defined as follows:
[1] where Δt represents the time of a measurement cycle (1 h in this study). Nitrate data with larger R values tended to show a larger scatter in the mass fraction when internally mixed with BC (>1.0 or <−0.2) compared to sulfate. However, these data points may contain significant uncertainties due to rapid changes in the mass concentrations within the measurement cycle. A better time resolution (shorter Δt) together with an improvement of the LOD and precision would reduce the uncertainties. Further experiments are needed to characterize the quantitative performance of the instrument under various conditions.
The median values of the mass fraction to total for sulfate and nitrate internally mixed with BC (FSO4,im and FNO3,im, respectively) are summarized in . Note that data with R > 0.9 h−1 are excluded from the statistics. It is suggested that only a small fraction (∼15%) of nitrate and sulfate were internally mixed with BC during the measurement period. shows the histograms of FSO4,im and FNO3,im for the two selected periods (periods 1 and 2 in ). The BC concentrations during period 1 (mass ∼1.5 μg m−3, number ∼400 cm−3) were higher than those during period 2 (mass ∼0.5 μg m−3, number ∼100 cm−3). The modal FSO4,im and FNO3,im showed a distinct difference between these two periods. Although the number of data were not sufficient to draw a definitive conclusion, it is likely that this reflects a systematic difference in the chemical processing between the two periods.
Table 2. Median contribution from BC-containing and -free particles for nitrate (ΔQ30) and sulfate (ΔQ48) during the measurement period (23–24 March 2013)
FIG. 12. Histograms of the mass fractions of (a) sulfate and (b) nitrate internally mixed with BC during periods: 1 (black lines), and 2 (shaded lines).
6. CONCLUSIONS
The LII-MS has been newly developed for the online measurement of aerosol chemical compositions with respect to the mixing state of BC. The detection efficiency of BC-containing particles measured using the LII analyzer was evaluated with the mobility diameter ranges of 0.1–0.3 μm and was found to be ∼80% at 0.1 μm. A linear relationship between the m/z signals and mass loadings was found for selected inorganic and organic compounds (ammonium sulfate, oleic acid, azelaic acid). The performance of the instrument was then evaluated in the laboratory by generating BC particles internally mixed with OL and BC particles externally mixed with ammonium sulfate particles. The former experiment was performed using various BC size (Dmob = 0.1–0.25 μm) and coating thickness (ΔDmob = 0.05–0.075 μm), and showed that BC-containing particles were almost fully vaporized before being transferred to the MS section when the LII laser is turned on. The latter experiment was performed using mono-disperse (Dmob = 0.25 μm) BC and sulfate aerosols, and showed that sulfate particles were not affected by the LII laser and were efficiently transferred to the MS section. The result from ambient measurement in Tokyo on 23–24 March 2013 suggested that only a small fraction (∼15%) of the mass for nitrate and sulfate were internally mixed with BC during the period. More laboratory evaluation and ambient measurements are needed to characterize the performance of the instrument under various conditions.
ACKNOWLEDGMENTS
The authors would like to thank N. Moteki at the University of Tokyo with data analysis and throughout the LII experimental procedure.
SUPPLEMENTAL MATERIAL
Supplemental data for this article can be accessed on the publisher's website.
SI_AST-MS-2014-012.R1.zip
Download Zip (101.5 KB)FUNDING
This study was funded by the SENTAN program of the Japan Science and Technology Agency (JST).
REFERENCES
- Adachi, K., Chung, S. H., and Buseck, P. R. (2010). Shapes of Soot Aerosol Particles and Implications for Their Effects on Climate. J. Geophys. Res., 115:D15206, doi:10.1029/2009JD012868.
- Baumgardner, D., Kok, G. and Raga, G. (2004). Warming of the Arctic Lower Stratosphere by Light Absorbing Particles. Geophys. Res. Lett., 31:L06117.
- Bond, T. C., Doherty, S. J., Fahey, D. W., Forster, P. M., Berntsen, T., DeAngelo, B. J., et al. (2013). Bounding the Role of Black Carbon in the Climate System: A Scientific Assessment. J. Geophys. Res., 118:5380–5552.
- Bond, T. C., and Bergstrom, R. W. (2006). Light Absorption by Carbonaceous Particles: An Investigative Review. Aerosol Sci. Technol., 40(1):27–67.
- Cabada, J. C., Rees, S., Takahama, S., Khlystov, A., Pandis, S. N., Davidson, C. I., et al. (2004). Atmos. Environ., 38:3127–3141.
- DeCarlo, P., Worsnop, D. R., Slowik, J. G., Davidovits, P., and Jimenez, J. L. (2004). Particle Morphology and Density Characterization by Combined Mobility and Aerodynamic Diameter Measurements. Aerosol Sci. Technol., 38(12):1185–1205.
- Ebert, M., Inerle-Hof, M., and Weinbruch, S. (2002). Environmental Scanning Electron Microscopy as a New Technique to Determine the Hygroscopic Behaviour of Individual Aerosol Particles. Atmos. Environ., 36:5909–5916.
- Fuller, K. A., Malm, W. C., and Kreidenweis, S. M. (1999). Effects of Mixing on Extinction by Carbonaceous Particles. J. Geophys. Res., 104:15941–15954
- Gysel, M., Laborde, M., Olfert, J. S., Subramanian, R., and Gröhn, A. J. (2011). Effective Density of Aquadag and Fullerene Soot Black Carbon Materials used for SP2 Calibration. Atmos. Meas. Tech., 4:2851–2858.
- Haywood, J. M., and Shine, K. P. (1995). The Effect of Anthropogenic Sulfate and Soot Aerosol on the Clear Sky Planetary Radiation Budget. Geophys. Res. Lett., 22(5):603–606.
- Huffman, J. A., Jayne, J. T., Drewnick, F., Aiken, A. C., Onasch, T., Worsnop, D. R., et al. (2005). Design, Modeling, Optimization, and Experimental Tests of a Particle Beam Width Probe for the Aerodyne Aerosol Mass Spectrometer. Aerosol Sci. Technol., 39(12):1143–1163.
- Irwin, M., Kondo, Y., Moteki, N., and Miyakawa, T. (2013). Evaluation of a Heated-Inlet for Calibration of the SP2. Aerosol Sci. Technol., 47:895–905.
- Kaye, P. H., Barton, J. E., Hirst, E., and Clark, J. M. (2000). Simultaneous Light Scattering and Intrinsic Fluorescence Measurement for the Classification of Airborne Particles. Appl. Opt., 39:3738–3745.
- Kondo, Y., Sahu, L., Kuwata, M., Miyazaki, Y., Takegawa, N., Moteki, N., et al. (2009). Stabilization of the Mass Absorption Cross Section of Black Carbon for Filter-Based Absorption Photometry by the use of a Heated Inlet. Aerosol Sci. Technol., 43:741–756.
- Kuwata, M., Kondo, Y., Mochida, M., Takegawa, N., and Kawamura, K. (2007). Dependence of CCN Activity of Less Volatile Particles on the Amount of Coating Observed in Tokyo. J. Geophys. Res., 112:D11207, doi:10.1029/2006JD007758.
- Michelson, H. A. (2003). Understanding and Predicting the Temporal Response of Laser-Induced Incandescence from Carbonaceous Particles. J. Chem. Phys., 118(15):7012–7045.
- Lack, D. A., and Cappa, C. D. (2010). Impact of Brown and Clear Carbon on Light Absorption Enhancement, Single Scatter Albedo and Absorption Wavelength Dependence of Black Carbon. Atmos. Chem. Phys., 10:4207–4220.
- Liu, P. S. K., Deng, R., Smith, K. A., Williams, L. R., Jayne, J. T., Canagaratna, M. R., et al. (2007). Transmission Efficiency of an Aerodynamic Focusing Lens System: Comparison of Model Calculations and Laboratory Measurements for the Aerodyne Aerosol Mass Spectrometer. Aerosol Sci. Technol., 41:721–733.
- Moteki, N., and Kondo, Y. (2007). Effects of Mixing State on Black Carbon Measurements by Laser-Induced Incandescence. Aerosol Sci. Technol., 41:398–417.
- Moteki, N., and Kondo, Y. (2008). Method to Measure Time-Dependent Scattering Cross Section of Particles Evaporating in a Laser Beam. J. Aerosol Sci., 39:348–364.
- Moteki, N., and Kondo, Y. (2010). Dependence of Laser-Induced Incandescence on Physical Properties of Black Carbon Aerosols: Measurements and Theoretical Interpretation. Aerosol Sci. Technol., 44:663–675.
- Moteki, N., Takegawa, N., Koizumi, K., Nakamura, T., and Kondo, Y. (2011). Multi-Angle Polarimetry of Thermal Emission and Light Scattering by Individual Particles in Airflow. Aerosol Sci. Technol., 45:1184–1198.
- Okada, K., Ikegami, M., Zaizen, Y., Makino, Y., Jensen, J. B., and Gras, J. L. (2001). The Mixture State of Individual Aerosol Particles in the 1997 Indonesian Haze Episode. J. Aerosol. Sci., 32:1269–1279.
- Onasch, T., Trimborn, A., Fortner, E., Jayne, J., Kok, G., Williams, L., et al. (2012). Soot Particle Aerosol Mass Spectrometer: Development, Validation, and Initial Application. Aerosol Sci. Technol., 46:804–817.
- Orsini, D. A., Wiedensohler, A., Stratmann, F., and Covert, D. S. (1999). A New Volatility Tandem Differential Monibility Analyzer to Measure the Volatile Sulfuric Acid Aerosol Fraction. J. Atmos. Ocean. Technol., 16:760–772.
- Philippin, S., Wiedensoler, A., and Stratmann, F. (2004). Measurements of Non-Volatile Fractions of Pollution Aerosols with an Eight-Tube Volatility Tandem Differential Mobility Analyzer (VTDMA-8). J. Aerosol Sci., 35:185–203.
- Schwarz, J. P., Gao, R. S., Fahey, D. W., Thomson, D. S., Watts, L. A., Wilson, J. C., et al. (2006). Single-Particle Measurements of Midlatitude Black Carbon and Light-Scattering Aerosols from the Boundary Layer to the Lower Stratosphere. J. Geophys. Res., 111:D16207, doi:10.1029/2006JD007076.
- Schulz, M., Davis, S. M., Wofsy, S. C., and Fahey, D. W. (2010). Global-Scale Black Carbon Profiles Observed in the Remote Atmosphere and Compared to Models. Geophysical Research Letters, 37:L18812.
- Sedlacek, A. J., Lewis, E. R., Kleinman, L., Xu, J., and Zhang, Q. (2012). Determination of and Evidence for Non-Core-Shell Structure of Particles Containing Black Carbon Using the Single-Particle Soot Photmeter (SP2). Geophys. Res. Lett., 39, doi: 10.1029/2012GL050905.
- Seinfeld, J. H., and Pandis, S. N. (2006). Atmospheric Chemistry and Physics, 2nd ed., John Wiley & Sons, New York.
- Stanier, C. O., Khlystov, A. Y., and Pandis, S. N. (2004). Ambient Aerosol Size Distributions and Number Concentrations Measured During the Pittsburgh Air Quality Study (PAQS). Atmos. Environ., 38:3275–3284.
- Stephens, M., Turner, N., and Sandberg, J. (2003). Particle Identification by Laser-Induced Incandescence in a Solid-State Laser Cavity. Appl. Optics., 42(19):3726–3736.
- Takegawa, N., Miyakawa, T., Kawamura, K., and Kondo, Y. (2007). Contribution of Selected Dicarboxylic and ω-Oxocarboxylic Acids in Ambient Aerosol to the m/z 44 Signal of an Aerodyne Aerosol Mass Spectrometer. Aerosol Sci. Technol., 41:418–437.
- Takegawa, N., Miyakawa, T., Nakamura, T., Sameshima, Y., Takei, M., Kondo, Y., et al. (2012). Evaluation of a New Particle Trap in a Laser Desorption Mass Spectrometer for Online Measurement of Aerosol Composition. Aerosol Sci. Technol., 46(4):428–443.
- Zhang, X., Smith, K. A., Worsnop, D. R., Jimenez, J. L., Jayne, J. T., Kolb, C. E., et al. (2004). Numerical Characterization of Particle Beam Collection: Part II Integrated Aerodynamic-Lens-Nozzle System. Aerosol Sci. Technol., 38:619–638.