
Abstract
This article is a feasibility study on using nonlinear acoustic effects, acoustic streaming and acoustic radiation pressure, for aerosol removal in an air duct. Unlike previous research, which used acoustics solely to cause aerosol agglomeration prior to aerosol removal in traditional duct collection systems, this article considers the acoustic streaming effect, which is significant but was previously neglected. Monodispersed polystyrene spheres with diameters ranging from 0.3 to 6 μm were tested. The proposed system removed 12–20% of the submicron aerosols and 25–32% of the micron aerosols when the airflow rate was approximately 90 L/min. Acoustic streaming introduces stagnation points on the surface of the air duct and removes the aerosols by deposition. Acoustic radiation pressure causes aerosols to form agglomerates. This enhances inertial impaction and/or gravitational sedimentation, which further enhances the removal efficiency of micron aerosols. The particle-removal efficiency is proportional to the duration that the aerosols are exposed to the acoustic field. The pressure drop due to the nonlinear acoustic effects is negligible; thus, power consumption is minimal. This system has the potential to be developed into an energy-efficient technique for aerosol removal.
Copyright 2014 American Association for Aerosol Research
1. INTRODUCTION
Removal of aerosols is an important process for emission control in industries. In addition, it is required to provide quality air for urban residents. Aerosols are normally removed from the main air stream by deposition. The most common deposition mechanisms include gravitational sedimentation and inertial impaction. Aerosol removal systems enhance the rate of deposition by manipulating particles and providing obstacles for aerosols to adhere to. For example, fibers in filters introduce sudden changes in the air-flow velocity and direction, thus enabling the collection of aerosols on the fibers by means of interception and impaction (Gougeon et al. Citation1996). Separators such as cyclones use external centripetal forces to displace aerosols from the main air stream (Dickenson Citation1997). These methods have high particle-removal efficiencies (Faulkner and Shaw Citation2006); however, they consume a large amount of energy. Fiber-packed filters are categorized into different grades by their particle-removal efficiencies measured with aerosols of various aerodynamic diameters (CitationASHRAE standard 52.2). High Efficiency Particulate Air (HEPA) filters are used to remove submicron solid particles. They impose a pressure drop above 400 Pa and the pressure drop increases as the dust loading increases (Thomas et al. Citation1999). Mechanical fans, which consume a large amount of energy, are required to overcome the pressure drop to deliver clean air. Moreover, cyclones require high airflow velocities to operate (Faulkner and Shaw Citation2006). Only powerful blowers are capable of producing these airflow velocities, but they demand over 1000 W of operating power due to their low operating efficiency (Jang et al. Citation2008).
In order to minimize the energy consumption during operation, innovative aerosol removal techniques without high pressure drop or high airflow velocity are highly desired. Acoustics have been identified as one of the potential approaches to fulfill these requirements. An acoustic field is capable of manipulating the movement of aerosols, but the effects of an acoustic field on the airflow field are insignificant because the length and the time scales of the acoustic fields are much smaller than those of the airflow. Currently, acoustics are only used to pre-treat air to improve removal efficiency for traditional air cleaning systems. The pre-treatment involves the agglomeration of fine aerosols into larger agglomerates, thus allowing the air cleaner to capture them with higher efficiency. Aerosols are either exposed to travelling or standing acoustic waves (Liu et al. Citation2011; Riera and Gallego Citation1986; Capéran et al. Citation1995). The dominating agglomeration mechanism that occurs in a travelling wave is the so-called orthokinetic effect (Liu et al. Citation2009). This occurs when there are variances in relaxation times between aerosols of different sizes (both micron and submicron) in acoustic fields. Larger aerosols have longer relaxation times than smaller aerosols, resulting in different degrees of entrainment. The nonzero relative velocities between aerosols increase the likelihood of collision. This mechanism is found in the agglomeration of polydispersed aerosols. For standing waves with high acoustic intensities, typically above 130 dB, noticeable nonlinear effects have been observed to act on the suspended aerosols and cause agglomeration, even in monodispersed aerosols (Riera and Gallego Citation1986). These effects have been studied extensively and the agglomeration is caused by acoustic radiation pressure (Song et al. Citation1994; Hoffmann and Koopmann Citation1997; Martin and Ezekoye Citation1997; Gonzalez et al. Citation2002). The radiation pressure distributions on the surfaces of aerosols are non-uniform due to the scattering of waves. The resultant acoustic radiation forces move the aerosols toward the pressure nodes, causing agglomeration, as concentrated aerosols are more likely to collide. By using this phenomenon to pre-treat coal combustion plant emissions, an electrostatic precipitator (ESP) retains 42% more micron particles and 39% more submicron particles with respect to the particles collected when an ESP functions alone (Gallego-Juárez et al. Citation1999). However, the addition of a pre-treating component contributes to the energy consumption of the entire system and approximately 1200 W of additional power was required.
Up to now, acoustics have been functioning solely as an agglomeration mechanism. However, another nonlinear acoustic effect, namely acoustic streaming, which is also capable of altering the airflow field and potentially causing particle deposition, seems to have been overlooked. Acoustic streaming can be introduced by slight modifications to the dimensions and orientation of existing pre-conditioning systems. It is a second-order effect driven by the momentum transfer, represented by the Reynolds stress. The theoretical studies for acoustic streaming have been well developed (Nyborg Citation1965; Lighthill Citation1978) and modeled extensively (Hamilton et al. Citation2003; Aktas and Farouk Citation2004). The largest scale streaming, called Ecklart streaming, creates a jet-like air stream which spouts from the acoustic source outward, in the direction of the wave propagation. Moreover, this motion draws in air from the surroundings. If the streaming is near a solid boundary, vortices may be created. This has a desirable effect to introduce inertial impaction as a deposition mechanism for aerosols.
The objective of this study is to examine the feasibility of using nonlinear acoustic effects, enhanced by acoustic streaming, as a standalone aerosol-removal device. This method not only causes aerosol agglomeration, but also enhances particle deposition to achieve aerosol removal. This system has many appealing properties. It has lower operating costs as there are no consumable parts. Moreover, it will not impose a severe pressure drop to the airflow, and this reduces the energy consumption.
2. RESEARCH METHODS
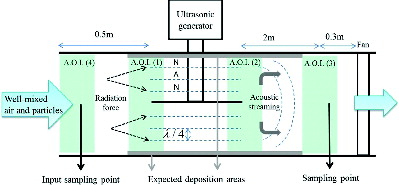
It is proposed to assemble an acoustic generator in an air duct to act as an aerosol-removal system. Aerosols are removed by deposition on the channel wall due to the acoustic field generated. The feasibility of this setup is examined in this study. An illustration of the experimental set-up and the anticipated nonlinear acoustic effects can be found in . The aspect ratio of the air duct was 2:1, which was narrower than those found in the literature (Gallego-Juárez et al. Citation1999). This geometry was used to facilitate the boundaries required to form vortices and encourage inertial impaction. The air duct had a width of 17.5 cm and a height of 8.5 cm. The hydrodynamic diameter was 11.4 cm. The height was adjusted to create different numbers of standing waves. A rectangular radiating plate was mounted on an ultrasonic transducer which generated the acoustic field. The plate was measured to be 30 × 160 × 0.3 cm3, and the transducer produced an ultrasound of approximately 30 kHz. The position of the radiation plate was determined by the sound wavelengths such that stationary waves were created at the center of the plate. Progressive waves emitting from the edges of the radiating plate caused interference with sound reflecting off the surfaces of the air duct. This created acoustic streams that emitted from the edges of the plate. The sound-pressure level was measured by a quarter inch (0.635 cm) microphone (377C01, PCB Piezotronics Incorporated, Depew, NY, USA) which was digitalized by an AD converter (P8004, Prosig Ltd., High St. Fareham, UK) and analyzed with a signal-processing software (DATS 7.0, Prosig Ltd.). The microphone was positioned to face the radiating plate at a distance of 1 m. The recorded sound pressure level was 147 dB, and the driving electrical power was 100 W.
FIG. 1. Illustrative diagram of the experimental set up.
Monodispersed aerosols were generated from one end of the air duct and were driven toward the other end by a fan, passing through the acoustic field. Both solid and liquid aerosols were generated in this study. Solid particles (Fluoro-Max Fluorescent Particles, Thermo Fisher Scientific Incorporated, Waltham, MA, USA) were generated by nebulizing a solution of distilled water with polystyrene spheres suspended in it. Their diameters ranged from 0.3 to 6 μm to cover both the submicron and micron ranges. Water droplets were generated with a commercial humidifier. The water droplets were measured to be approximately 20 μm in diameter using an Interferometric Mie Imaging (IMI) system (ParticleMaster, LaVision, Goettingen, Germany). These droplets were only used for visualization purposes and not for the measurement of number concentration.
Inlet and outlet particle-number concentrations and -size distributions were measured. A Condensation Particle Counter (CPC; TSI 3776, TSI Incorporated, Shoreview, MN, USA) was employed for concentration measurement and an Optical Particle Sizer (OPS; TSI 3330, TSI Incorporated) was used to measure size distributions in the range from 0.3 to 10 μm. The volume flow rates were 1.5 and 1 L/min for the CPC and OPS, respectively. This corresponded to a flow velocity of 1.273 and 0.85 m/s in the probe for the CPC and the OPS measurements, respectively.
Images were captured and processed by a Particle Image Velocimetry (PIV) system (FlowMaster, LaVision) at various locations to analyze the acoustic streaming. There were four areas of interest (A.O.I.) which were the sites selected for imaging (). The movement of particles as they were entering and exiting the standing wave is shown at A.O.I. (1) and A.O.I. (2), respectively. A.O.I. (3) and A.O.I. (4) were used to obtain the velocity profiles in the air duct where the particle-concentration-measuring probes were positioned. PIV analyzed the velocity vectors by comparing the positions of the seeding aerosols in two snapshots taken with a very short time interval of approximately 1 ms. The seeding aerosols were monodispersed 0.3-μm polystyrene spherical particles.
In order to ensure isokinetic sampling, if at least one of the two below conditions is met, the measured data are required to be scaled according to (Hinds Citation1999)(1) where Stk is the Stokes number, Us and U0 are, respectively, the sampling and main stream velocities, Cs and C0 are, respectively, the sampling and main stream particle-number concentrations. The first condition is that the flow velocity ratio of the probe to the main stream is lower than 0.2 or higher than 5. The second condition is that the particle Stokes number is above 0.01. The Stokes numbers for all cases in this study were found to be less than 0.0062. However, some experiments in this study were conducted with mean airflow velocities below 0.25 m/s and the first condition was met, indicating that scaling was required. In addition to these conditions, the flow direction must align with the inlet of the sampling probe, which was verified by PIV analysis.
3. RESULTS AND DISCUSSION
The effect of acoustic treatment on aerosol number concentration is presented in this section. To ensure the accuracy of the measurement, the flow must be steady and align with the inlet of the sampling probe. PIV analysis was conducted at A.O.I. (3) to measure the mean flow rate, the velocity profiles, and any effect that acoustics may have on them. shows two sets of typical velocity profiles with the fan operating at different speeds. They were captured at mid-width of the air duct, in the same plane as the particle-measuring probe. The profiles for both cases showed that there were no circulations or reverse flow, regardless of the presence of acoustics. The magnitudes of the velocities perpendicular to the main flow were also negligible.
FIG. 2. Typical velocity profiles for acoustics on and off.
The particle number concentrations were measured by the CPC at A.O.I. (3) and the results are shown in . Aerosols of four different sizes were input into the air duct. The mean air velocity was approximately 0.18 m/s. Particles were continuously generated from the mixing box. The acoustic device was switched on at t = 50 s, and off at t = 110 s. The data were scaled by EquationEquation (1)(1) to represent the mainstream concentration correctly. In addition, they were normalized with respect to the initial particle number concentrations, C0 (averaged values between the 30th–50th seconds), which were different for different sizes of aerosols. It was found that the particle concentrations decreased immediately after the acoustic generator was switched on at t = 50 s. The lowered concentration level sustained until the acoustic generator was switched off at t = 110 s. These results were clear evidence that the constructed acoustic field had a beneficial effect on lowering the particle concentration for both micron- and submicron-sized particles. The larger the aerosols, higher was the removal efficiency. Aerosols were removed by the enhancement of deposition due to nonlinear acoustic effects. The identified nonlinear acoustic effects are radiation pressure and acoustic streaming, which are analyzed in sections 3.1 and 3.2.
FIG. 3. Typical variation in particle number concentration due to acoustic treatment.
shows the particle-removal efficiency, which is defined as(2)
FIG. 4. Particle number concentration drops as a function of flow velocities. (Flow velocities were obtained without acoustics.)
3.1. Acoustic Streaming
Acoustic streaming is expected to be an important mechanism to encourage deposition of aerosols by inertial impaction. This section performs a qualitative analysis of this effect by visualization. Images of the airflow were captured under two conditions – with and without acoustics. Vector fields from these images were calculated by the PIV analyzer. shows the flow field taken at A.O.I (2). shows the flow field without acoustics. The observed flow field was uniform, and the dominating velocity vector component was tangential to the surface of the air duct. show the flow fields with acoustics and with different positions of the radiating plate. In , two pressure nodes, both above and below the plate, were generated. An asymmetric setting shown in was set up to generate three pressure nodes below and one above the plate. For cases with acoustics, the velocity vectors had the same order of magnitude in both the normal and tangential components, which were significantly different to the case without acoustics.
FIG. 5. Fluid flow fields (a) without acoustics, (b) with acoustics due to symmetrical plate position, and (c) with acoustics due to asymmetrical plate position.
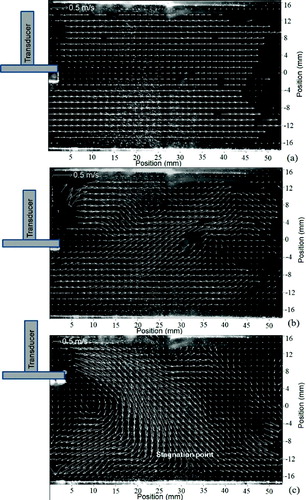
In the asymmetric case shown in , the flow was guided toward the bottom surface of the air duct, creating stagnation points and vortices on the solid boundary. Moreover, it was found that, for the same initial velocity (0.21 m/s) and particle size (0.3 μm), the asymmetric setting induced 21.3% higher particle-removal efficiency than that found in the symmetrical setting. The amount of disturbance caused by the change in the plate position was quantified statistically. For the symmetrical case shown in , the mean of the horizontal velocity vectors was 0.1 m/s and the standard deviation was 0.07 m/s. The corresponding values for the vertical velocity components were 0.03 and 0.04 m/s, respectively. For the asymmetrical case shown in , the mean of the horizontal velocity vectors was 0.3 m/s and the standard deviation was 0.22 m/s. The corresponding mean and standard deviation for the vertical velocity components were both 0.2 m/s. The asymmetrical setting increased the degrees of non-uniformity and fluctuation in the flow, which encouraged particle removal.
3.2. Acoustic Radiation Pressure
Another nonlinear acoustic effect, namely the acoustic radiation pressure, was also evident in the captured images. show that large particles (6 μm) flowed toward the radiating plate, from right to left, without and with acoustics, respectively. Particles were found to accumulate at the acoustic pressure node of the standing wave. shows the behavior of the fine particles (0.3 μm in diameter) when the standing wave was still present. The pattern shown in was not found in . In order to understand the size effect on the acoustic radiation force, a numerical simulation was conducted according to the theory developed by King (Citation1934), who developed a linearized governing equation for acoustic radiation force acting on a spherical particle in a standing wave. When the Stokes drag force is experienced, the position of the particle can be given as,(3)
FIG. 6. Aerosol flow patterns of (a) 6-μm particles without acoustics, (b) 6-μm particles with acoustics, and (c) 0.3-μm particles with acoustics.
FIG. 7. The effect of acoustic radiation pressure on particles of different sizes.
shows the patterns of the large water droplets (20 μm) leaving the standing wave with and without the acoustics. It was taken at A.O.I. (2). The straight-line pattern was distorted because the ultrasound was no longer a pure standing wave near the edge of the plate and the influence of acoustic streaming became significant.
FIG. 8. Droplets leaving the standing wave with (left) and without (right) acoustics.
Agglomeration may occur when the aerosols move toward the pressure node which increases the likelihood of collision. Experiments were conducted to investigate the particle-size shift. The sizes of the input monodispersed particles were 0.3, 0.6, and 2 μm in diameter. The sampling probe was located at A.O.I. (3) and the measurements were performed by separating particles into 10 size bins. The collected data were used to calculate the changes in particle number concentrations, given by(5) where Cbinon was the averaged particle number concentration measured by the OPS in 60 s for a specific size bin when the acoustic generator was turned on. Subscript “off” represents the concentration measured without the acoustic field. shows that the concentrations decreased for all sizes after the acoustic treatment when the input particles were in the submicron range. However, when the input particle size was 2 μm, there was an increase in particle-number concentration in the bin which measured particles ranging from 8 to 10 μm. In order to verify the agglomeration, a further investigation was conducted. The background concentration of particles ranging from 8 to 10 μm at the inlet (A.O.I. [4]) was measured. At A.O.I. (4), on average, the aerosol concentration in the size range 8 to 10 μm was 0.05 particles/cm3 with a standard deviation of 0.003 particles/cm3. The mean concentration measured at the outlet sampling point without acoustics dropped to 0.03 particles/cm3 with a standard deviation of 0.005 particles/cm3. On the other hand, the mean concentration measured with acoustics increased to 0.08 particles/cm3 with a standard deviation of 0.03 particles/cm3. The increase in concentration was more than 150%, verifying the occurrence of agglomeration.
Table 1 Percentage change in particle number concentration
3.3. Discussion of Energy Consumption
Most of the energy of aerosol-removal systems is consumed by air delivery. High energy consumption will occur if high velocity is required for the operation or a high-pressure drop exists in the system. The energy consumed by a fan or a blower per unit volume of processed air is(6) where
is the volume flow rate, ΔP is the pressure drop and η is the efficiency of the fan, typically below 50% (Jang et al. Citation2008). From the ASHRAE 52.2 standard, a medium-grade filter Minimum Efficiency Reporting Value (MERV 3–8) has a pressure drop of approximately 350 Pa (Dickenson Citation1997). In the proposed system, the effects of the acoustic field on the airflow field were insignificant due to the different length and time scales between the acoustic field and the flow field. The pressure drops for different mean airflow velocities were found to be less than 1 Pa, which were insignificant compared with those found in fiber-packed filters (Jaganathan et al. Citation2008), and saved a significant amount of energy. It is noted that additional power was required to operate the acoustic generator. The power required for the transducer was recorded to be about 100 W, which was ∼10% of the power consumed by the blower system to recover the pressure drops in traditional systems. Moreover, high-speed airflow was not required in the proposed system; the operational mean airflow velocity was less than 1 m/s. It should be noted that at the present stage, the removal efficiency of the proposed system is not as high as the traditional systems. However, due to the phenomenon discussed earlier, there is a potential for it to be developed into an energy-efficient aerosol-removal technique.
4. CONCLUSION AND RECOMMENDATION
An energy-efficient aerosol-removal system using nonlinear acoustic techniques was proposed. This study shows that, by incorporating acoustic streaming in the design of the system, the scope of acoustic techniques could be potentially extended from pre-conditioning to a standalone aerosol-removal system. Flow visualization by a PIV system showed that acoustic streaming encouraged inertial or direct impaction of aerosols onto the surfaces of the air duct by introducing stagnation points and vortices. Factors that affected the removal efficiency were the mainstream flow velocity, the position of the radiation plate and the aerosol size. A high flow rate in the air duct decreased the time that the particles were exposed to the acoustic field and decreased the removal efficiency. The position of the radiation plate changed the acoustic field and, therefore, the acoustic streaming pattern. It was shown that more aerosols were removed by higher degrees of non-uniformity and fluctuation in the flow field. Both simulated and observed results showed that acoustic radiation pressure caused agglomeration and the enlarged aerosol further enhanced the deposition on the surface by sedimentation and inertial impaction.
The proposed acoustic technique had minimal pressure drop, directly resulting in lower energy costs when compared with traditional systems. This novel technique has the potential to be developed into an energy-efficient technique. The proposed system could be optimized by modifying the geometry to increase vortices at the surfaces, leading to an increase in the removal efficiency. The experiments performed in this study employed monodispersed aerosols. Investigation into the efficiency of polydispersed aerosols is recommended in the future. Further studies to increase the removal efficiency of this system are suggested so that it can promptly be developed into an alternative aerosol-removal method.
FUNDING
The work was supported by the General Research Fund granted by the Research Grants Council of the Hong Kong Special Administrative Region, China (Project No. 611013).
REFERENCES
- Aktas, M. K. and Farouk, B. (2004). Numerical Simulation of Acoustic Streaming Generated by Finite-Amplitude Resonant Oscillations in an Enclosure. J. Acoust. Soc. Am., 116(5):2822–2831.
- ASHRAE standard 52.2. Available from https: //www.ashrae.org/standards-research–technology/standards-addenda.
- Capéran, P., Somers, J., Richter, K., and Fourcaudot, S. (1995). Acoustic Agglomeration of a Glycol fog Aerosol: Influence of Particle Concentration and Intensity of the Sound Field at Two Frequencies. J. Aerosol Sci., 26(4):595–612.
- Dickenson, T. C. (1997). Filters and Filtration Handbook. Elsevier.
- Faulkner, W. B. and Shaw, B. W. (2006). Efficiency and Pressure Drop of Cyclones Across a Range of Inlet Velocities. App. Eng. Agric., 22(1):155–161.
- Gallego-Juárez, J., Riera, E., RodrÍguez, G., Hoffmann, T., Gálvez, J., RodrÍguez, J., Gómez-Moreno, F., Bahillo-Ruiz, A., MartÍn-Espigares, M., and Acha, M. (1999). Application of Acoustic Agglomeration to Reduce Fine Particle Emissions from Coal Combustion Plants. Environ. Sci. Tech., 33(21):3843–3849.
- González, I., Gallego-Juárez, J., and Riera, E. (2003). The Influence of Entrainment on Acoustically Induced Interactions Between Aerosol Particles—An Experimental Study. J. Aerosol Sci., 34(12):1611–1631.
- Gonzalez, I., Hoffmann, T., and Gallego, J. (2002). Visualization of Hydrodynamic Particle Interactions: Validation of a Numerical Model. Acta Acust. United with Acustica, 88(1):19–26.
- Gougeon, R., Boulaud, D., and Renoux, A. (1996). Comparison of Data from Model Fiber Filters with Diffusion, Interception and Inertial Deposition Models. Chem. Eng. Commun., 151(1):19–39.
- Hamilton, M. F., Ilinskii, Y. A., and Zabolotskaya, E. A. (2003). Acoustic Streaming Generated by Standing Waves in Two-Dimensional Channels of Arbitrary Width. J. Acoust. Soc. Am., 113(1):153–160.
- Hinds, W. C. (1999). Aerosol Technology: Properties, Behavior, and Measurement of Airborne Particles: 2nd Edition, John Wiley & Sons.
- Hoffmann, T., and Koopmann, G. (1997). Visualization of Acoustic Particle Interaction and Agglomeration: Theory Evaluation. J. Acoust. Soc. Am., 101(6):3421–3429.
- Jaganathan, S., Vahedi Tafreshi, H., and Pourdeyhimi, B. (2008). On the Pressure Drop Prediction of Filter Media Composed of Fibers with Bimodal Diameter Distributions. Powder Technol., 181(1):89–95.
- Jang, C. M., Kim, D. W., and Lee, S. Y. (2008). Performance Characteristics of Turbo Blower in a Refuse Collecting System According to Operation Conditions. J. Mech. Sci. Technol., 22(10):1896–1901.
- King, L. V. (1934). On the Acoustic Radiation Pressure on Spheres. P. Roy. Soc. Lond. A Mat., 147(861):212–240.
- Lighthill, Sir J. (1978). Acoustic Streaming. J. Sound Vib., 61(3):391–418.
- Liu, J., Wang, J., Zhang, G., Zhou, J., and Cen, K. (2011). Frequency Comparative Study of Coal-Fired Fly Ash Acoustic Agglomeration. J. Environ. Sci., 23(11):1845–1851.
- Liu, J., Zhang, G., Zhou, J., Wang, J., Zhao, W., and Cen, K. (2009). Experimental Study of Acoustic Agglomeration of Coal-Fired Fly Ash Particles at Low Frequencies. Powder Technol., 193(1):20–25.
- Martin, K. M., and Ezekoye, O. A. (1997). Acoustic Filtration and Sedimentation of Soot Particles. Exp. Fluid., 23(6):483–488.
- Nyborg, W. L. (1965). Acoustic Streaming. Phys. Acoustics, 2(Pt B):265.
- Riera, E., and Gallego, J. (1986). Ultrasonic Agglomeration of Micron Aerosols Under Standing Wave Conditions. J. Sound Vib., 110(3):413–427.
- Song, L., Koopman, G., and Hoffmann, T. (1994). An Improved Theoretical Model of Acoustic Agglometation. J. Vib. Acoust., 116(2):208–214.
- Thomas, D., Contal, P., Renaudin, V., Penicot, P., Leclerc, D., and Vendel, J. (1999). Modelling Pressure Drop in HEPA Filters During Dynamic Filtration. J. Aerosol Sci., 30(2):235–246.