
Abstract
The development of a detailed microphysical model that describes the complex multicomponent interactions between organic vapors and soot particles emitted from aircraft gas turbine engines is presented. Our model formulation includes both soot surface activation by organic vapors and organic vapor condensation on the activated part of the soot surfaces. To enable this formulation, approaches to estimate chemical and physical properties of aerosols containing complex mixtures of sulfuric acid, water, and organic molecules were developed. Relevant distributions of a list of organic surrogates at the engine exit plane were used to represent complex organic emissions from aircraft engines. A parametric study was performed using this new formulation to understand the effects of ambient conditions, organic emissions levels, and mass accommodation coefficient values on the evolution of near field volatile particulate matter emissions from aircraft engines at ground level.
Copyright 2014 American Association for Aerosol Research
1. INTRODUCTION
The hydrophilicity, composition, and size of atmospheric fine particles are critical to understand their potential environmental and climate impacts and health risk. It is believed that particle hydrophilicity is important for cloud formation (Kanakidou et al. Citation2005) and particle chemical composition affects particle radiative forcing properties (Schwarz et al. Citation2008). Both particle chemical composition and size were also found to determine their health risk (Seaton et al. Citation1995; Pope and Dockery Citation2006). Aviation particulate matter (PM) emissions in the atmosphere generally consist of liquid-coated soot particles and homogeneous liquid droplets. The volatile (liquid) components of these particles mainly consist of sulfuric acid and condensable organic species. The role of sulfuric acid in the formation and atmospheric evolution of aviation PM has been widely studied (Kärcher Citation1998; Wong et al. Citation2008; Kärcher and Yu Citation2009). However, the effects of organic vapors on aviation PM formation and evolution is less understood, even though recent field measurements performed in the near field (<1000 m downstream) suggested that they are the most dominant components at low thrust settings due to incomplete combustion (Petzold et al. Citation2005; Knighton et al. Citation2007; Yelvington et al. Citation2007; Onasch et al. Citation2009; Timko et al. Citation2010a,b, Citation2013, Citation2014; Presto et al. Citation2011). Clearly, novel experimental and modeling approaches elucidating the role of organic vapors in the atmospheric evolution of hydrophilicity, composition, and size of aircraft emitted aerosols are needed to advance our understanding of the effects of aviation PM emissions on environment and human health.
A wide variety of organic species are emitted from aircraft engines. It is very expensive and challenging to perform experiments to systematically characterize size-resolved composition of aviation PM emissions in the near field. Existing modeling tools simulating volatile PM evolution in near field aircraft plumes only considered contributions from sulfuric acid (Kärcher Citation1998; Wong et al. Citation2008, Citation2011; Kärcher and Yu Citation2009). They failed to quantitatively explain complex phenomena observed in recent field measurements involving organic species. This article presents a new formulation that describes the detailed, multicomponent microphysics between organic vapors and soot particles emitted from aircraft gas turbine engines at ground level. A list of organic surrogates was selected based on their saturation vapor pressure values. Approaches to estimate chemical and physical properties of the particles containing mixtures of sulfuric acid, water, and organic surrogates are presented. Results for parametric sensitivity studies on ambient conditions, engine operating parameters, and engine emissions performance are discussed. Immediate benefit of this work is a modeling tool that can be exercised to analyze existing data (Yu et al. Citation2014; Peck et al. Citation2014) and guide future measurement missions performed in the near field. Furthermore, our modeling tool can also be coupled to large-scale air quality models for providing valuable aerosol size and composition information to initiate their calculations (Arunachalam et al. Citation2014).
2. MODEL DEVELOPMENT
The detailed microphysical model developed in this work is based on our previous approach of simulating atmospheric evolution of aircraft emitted particles (Wong et al. Citation2008; Jun Citation2011). Our model tracks time evolution of a gaseous or volatile portion of a particle species in a jet engine exhaust plume in terms of contributions from chemistry, plume dilution and mixing, and microphysical processes as (Kärcher Citation1998):[1]
Engine exit plane conditions, such as gas-phase species concentrations, soot emissions, exhaust temperature, and jet velocity are user inputs. The input values in this work were either calculated with an engine cycle simulation tool (e.g., exhaust temperature and jet velocity) or derived based on recent field measurements performed at the engine exit plane (e.g., gas-phase and soot emissions). Plume dilution and cooling profiles were calculated with a semiempirical, self-similar approach developed by Davidson and Wang (Citation2002).
For atmospheric microphysical processes, our previous model includes formation of new liquid aerosols via binary homogeneous nucleation and condensation of volatile vapors on soot (Wong et al. Citation2008, 2011, 2013; Wong and Miake-Lye Citation2010; Jun Citation2011). The contribution of organic emissions to these processes, however, was not considered. The present study extends our existing knowledge of particle microphysics to incorporate condensation of organic emissions on aircraft emitted soot particles. Microphysical processes of new droplet formation via homogeneous nucleation involving organic vapors are not considered in this article and will be presented in a subsequent publication.
Our model simulates microphysical evolution of aircraft emitted volatile PM immediately after engine exit plane, with a plume age of 20 min or less. The focus of our work is, therefore, to study how surfaces of aviation soot are activated and how aircraft emitted sulfuric acid and organics condense on soot surfaces. Larger scale aerosol models (Zavari et al. Citation2008; Riemer et al. Citation2009; Tian et al. Citation2014) study longer time scales (hours to days) so that their focus is more on predicting gas-particle partitioning based on local dilution levels and atmospheric conditions (temperature, pressure, etc.). To this reason, our model is more applicable to analyze recent field measurement data obtained in the near field, mostly less than 250 m downstream, whereas larger scale models are more applicable to study particle size and composition change in regional or even global scales. We believe two approaches are complimentary.
2.1. Soot Microphysics
2.1.1. Activation of Soot Surfaces
It is generally believed that freshly emitted soot particles from gas turbine engines are bare and initially hydrophobic. Activation of soot surfaces by adsorption of vapor molecules is prerequisite for subsequent vapor condensation on soot. Soot surfaces can be activated by sulfuric acid or water-soluble organic species to become hydrophilic (aqueous) or by water-insoluble organic species to become hydrophobic (nonaqueous). We thus track two distinct phases, aqueous (hydrophilic) and nonaqueous (hydrophobic), on a soot surface in the model. Water is not considered in this activation process because direct adsorption of water on hydrophobic soot surfaces is believed to be very unfavorable (Brown et al. Citation1996), especially in the presence of sulfuric acid (Kärcher Citation1998). In addition to gaseous adsorption on soot, activation by collisions of nucleated liquid droplets on soot surfaces is also considered. This process, termed as scavenging, is modeled with Brownian coagulation between scavenged liquid droplets and soot particles. In summary, the activation of soot particles in the ith size bin is described in the model by:where Θaq,i and Θnon-aq,i are the activated aqueous and nonaqueous fractions of a soot surface,
and
are the mass accommodation coefficients for the adsorption of gaseous sulfuric acid and organic species j on soot (referred to as dry accommodation coefficients), which describe the sticking probabilities of vapor molecules on a bare soot surface,
and
are the mean thermal speed for the vapor phase sulfuric acid and organic species j,
,
, and
are the concentrations of vapor phase sulfuric acid, vapor phase SO3, and vapor phase organic species j, NA is the Avogadro's number, σ0 is the number of available adsorption sites per unit surface area on soot (which was set at 5 × 10¹⁸ m−2), Bijk is the Brownian coagulation kernel between liquid droplets of species j in the kth size bin (with a diameter of dk,j) and soot particles in the ith size bin (with a diameter of ds,i), and nk,j is the number density of liquid droplets of species j in the kth size bin. Note that in this equation, j is the species index and “a,” “ws,” and “ins” in the summation terms stand for sulfuric acid, water-soluble, and water-insoluble organic species.
Derived from Equation (2), the mass of sulfuric acid () and organic species j (
) on soot particles in the ith size bin due to activation and scavenging is calculated by:
where
,
, and
are the molecular weights of H2SO4, SO3, and organic species j, and
and
are the molecular weights of homogeneous liquid droplets of sulfuric acid-water and organic species j in the kth size bin, respectively.
2.1.2. Condensation Growth of Organic Vapors
In our model, condensation of volatile vapors can only occur on the activated parts of the soot surfaces. Our model assumes that only water, sulfuric acid, and water soluble organics can condense on the aqueous (hydrophilic) part of the surface, and only water insoluble organics can condense on the nonaqueous (hydrophobic) part. The total mass of sulfuric acid, water (), and organic species j on soot particles in the ith size bin due to condensation is calculated by:
where
is the molecular weight of water, DS, DW, and DOj are the diffusivities of the vapor phase sulfuric acid, water, and organic species j in air, PS, PW, and POj are the vapor pressure of sulfuric acid, water, and organic species j,
,
, and
are the saturation vapor pressure of sulfuric acid, water, and organic species j, κi is the Kelvin factor of the soot particles in the ith size bin, aS, aW, and aOj are the activity coefficients of sulfuric acid, water, and organic species j in the soot coating liquid mixtures, and
,
, and
are the correction factors for condensation of each species on soot particles in the ith size bin, calculated by (Pruppacher and Klett Citation1997; Seinfeld and Pandis Citation1998):
[5] where λ is the molecular mean free path in air, and
is the mass accommodation coefficient for the condensation of species j on soot (referred to as wet accommodation coefficients), which describes the sticking probability of a vapor molecule on the activated fraction of a soot surface.
As described in the equations above, the rate of activation of soot surfaces is proportional to the values of dry accommodation coefficients (i.e., and
), and the rate of condensation of volatile vapors on soot increases with larger wet accommodation coefficients (i.e.,
and
). For sulfuric acid and SO3, the dry accommodation coefficient was set to 0.018 (Zhang and Zhang Citation2005) and the wet accommodation coefficient was set to unity based on our previous study (Wong et al. Citation2008). For surrogate organic species, values of dry and wet accommodation coefficients are not typically available in the literature. As a result, sensitivity studies of our modeling results to these coefficients were performed in this work (discussed in Section 3.4). Experimental efforts are also being conducted in the laboratory to determine the values of dry and wet accommodation coefficients for selected organic surrogate species.
In our previous model treatment, the water-soluble and water-insoluble surface coverage would only increase due to surface activation and would not change because of vapor condensation on soot. This treatment may lead to liquid layers unrealistically piled up on an activated soot surface. In this study, we revised our model treatment by assuming that the contact angle of a coated soot particle remains constant and vapor condensation on soot can cause changes in the soot surface coverage. Using the geometry of a cap-shaped droplet on a partially activated surface, the rate of change of soot surface coverage (Θ) can be related to rate of change of condensation mass (m) on soot surfaces, as described in Equation (6), where a proportionality function containing surface coverage (Θ), density of the condensed liquid (ρ), the contact angle (θcont), and the core soot diameter (dc,i) can be derived:
[6]
The function can be derived assuming that the same contact angle is maintained throughout the wetting process (see the online supplemental information). Typical contact angles of water on soot surfaces are reported in the range of 60°−80° (Persiantseva et al. Citation2004), and the contact angle of H2SO4‒H2O droplets was measured as 64 ± 2° on regular graphite surfaces and 55 ± 2° on OH-treated graphite surfaces (Kärcher et al. Citation1996). In this work, a contact angle of 60° was used for vapor condensation on aviation soot particles.
2.1.3. Soot-Soot Coagulation
It is widely accepted that soot-soot coagulation is insignificant in aircraft emitted plumes. This is because mixing between the ambient air and the plume happens very quickly such that concentration of the soot particles (as high as 107 cm−3 at the engine exit plane) rapidly decreases. This is evidenced by the measurement results from recent field missions, where number-based emissions index of soot particles was shown to be insensitive to different downstream locations where the measurement probes were positioned (Lobo et al. Citation2007; Onasch et al. Citation2009). Modeling studies aimed at simulating aircraft emitted particle evolution at cruise also concluded that coagulation among soot particles can be neglected (Kärcher Citation1998). As a result, we do not consider soot-soot coagulation to be important and thus it is not included in our microphysical model.
2.2. Organic Surrogate Species
Since a wide variety of organic species are emitted from aircraft gas turbine engines, it is impractical to include every emitted organic species into our model simulations. Recent field measurements identified organic emissions as large as methylnaphthalene in the gas phase at idle (Knighton et al. Citation2007; Yelvington et al. Citation2007). Heavier, less volatile organic species that can be partitioning into the aerosol phase, however, were not easily identified due to their low concentration in the gas phase. We selected six organic surrogate species to efficiently simulate interactions of volatile organics and aircraft emitted soot particles in this work. Our selection of organic surrogates was based on the saturation vapor pressure in the typical range of saturation concentrations between 0.01 and 106 μg/m3 at room temperature, inline with the uniform basis set of saturation vapor pressure framework (Donahue et al. Citation2006; Robinson et al. Citation2007). We selected one water insoluble species for each two saturation concentration bins in this range, except for the most volatile bin where two species, one water-soluble and one water-insoluble, were selected. We only allow the most volatile bin to contain an oxygenated species because measurements performed directly at the engine exit plane show that oxygenated species were only present in small (<C5) molecules (Knighton et al. Citation2007; Yelvington et al. Citation2007). Larger species were found almost exclusively to be not oxygenated, and oxidation of these species by photochemical reactions requires much longer time than our interest. Surrogate species in the low volatility bins were assumed to be water insoluble because they represent typical organic species emitted from the engines in this volatility range, which are not oxygenated and possess very low water solubility. A list of organic surrogate species selected for our modeling work is provided in .
TABLE 1 Organic surrogate species selected in this work
2.3. Properties of Liquid Organic Mixtures
To include the organic surrogate species above in our microphysical model, approaches of estimating species’ physical and thermodynamic properties were implemented into the model. Boiling points and critical properties (i.e., critical temperature, pressure, volume, and compressibility factor) of the pure organic surrogate species are necessary for this estimation. In this work, experimentally measured boiling points and critical properties are used if they are available. The group contribution method by Nannoolal et al. (Citation2004, Citation2007) was used to calculate boiling points and critical properties otherwise. The density of a liquid mixture of sulfuric acid, water, and water-soluble organics (for the hydrophilic coverage) or a liquid mixture of water-insoluble organics (for the hydrophobic coverage) was estimated by the Rackett equation with the Li mixing rule (Poling et al. Citation2001). The empirical relationship developed by Brock and Bird was used to calculate surface tension of a pure organic surrogate species (Poling et al. Citation2001). Surface tension of a liquid mixture soot coating was assumed to be the molar averaged surface tension of all the species in the mixture. Activity coefficients of the components in liquid mixtures were evaluated following the principles given by Clegg and Seinfeld (Citation2006). Since two different phases, aqueous and nonaqueous, are tracked on a soot surface, the activity coefficients of sulfuric acid, water, and the organic species were calculated separately in two phases. For the aqueous fraction, the aqueous liquid mixture was further divided into two independent components (sulfuric acid-water solution and aqueous organic solution). We assume that the interactions between sulfuric acid-water solution and aqueous organic solution are negligible. The empirical relationship developed by Taleb et al. (Citation1996) was used for calculating activity coefficients of sulfuric acid and water in an aqueous sulfuric acid solution. The modified universal quasi-chemical functional-group activity coefficients (UNIFAC) group contribution model (Larsen et al. Citation1987) was used for calculating activity coefficients of organic species in both aqueous and nonaqueous organic solutions. Finally, experimental saturation vapor pressure of an organic surrogate species expressed as the Antoine Equation was used if available. For heavier organic species without experimental saturation vapor pressure, the group contribution method developed by Nannoolal et al. (Citation2008) for estimating vapor pressure of organic species was used due to its good agreements with measurement data for both water-soluble and water-insoluble organic species over a wide range of temperature, compared to other group contribution methods (Jensen et al. Citation1981; Asher and Pankow Citation2006; Pankow and Asher Citation2008).
3. RESULTS AND DISCUSSION
To exercise our model to understand the growth of liquid soot coatings in aircraft exhaust plumes in the presence of organic emissions, we selected to simulate the CFM56-2C1 engine studied in the Aircraft Particle Emissions eXperiment (APEX) at idle (7%) power (Wey et al. Citation2007). Soot emissions at the engine exit plane were set to the measurement values during APEX, which assumes a log-normal distribution with a geometric mean diameter of 16 nm, a total concentration of 8.5 × 106 cm−3, and a standard deviation of 1.3. A total of 10 log-normally distributed bins between 6 nm and 80 nm in diameter were used to simulate this soot particle size distribution.
In our simulations, the ambient temperature was varied in between 275 and 285 K. The ambient relative humidity was varied from 40% to 80%. The total concentration of organic emissions at the engine exit plane was varied from 200 to 600 ppb. To focus on the soot microphysics, binary nucleation of sulfuric acid and water was not considered in the simulations. As discussed earlier, understanding of the exact amount of organic emissions and speciation distribution remains limited, and this range was set to be as the best guess according to experimental measurements (Yelvington et al. Citation2007). The sensitivity of soot growth to ambient temperature, ambient relative humidity levels, organic concentration at the engine exit plane, and mass accommodation coefficients used in the model was further investigated in the parametric study discussed in this section.
3.1. Representative Modeling Results
To examine our model performance, a microphysical simulation following an exhaust centerline plume up to 1000 m downstream of a CFM56-2C1 engine operated at idle (7%) power was performed. In this simulation, the ambient temperature was set to 280 K, and ambient relative humidity was set to 60%. Total organic emissions at the engine exit plane were set at 400 ppb, and molar fraction of each surrogate species was set to the distribution shown in . The dry mass accommodation coefficients for sulfuric acid and organic species in Equations (2) and (3) were set to 0.018, and the wet mass accommodation coefficients for sulfuric acid and organic species in Equation (5) were set to unity, as described earlier.
FIG. 1. Modeled molar fraction of organic emissions at the engine exit plane.
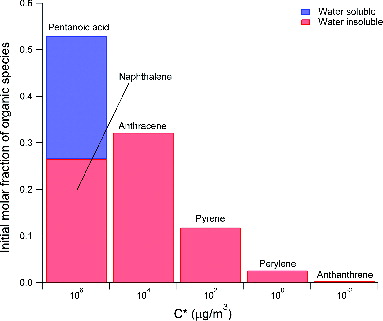
shows the results from this simulation. The composition of soot coatings as a function of downstream distance from the engine is shown in in terms of mass fraction of each species. Our simulation predicted that soot coatings are organic-rich within the first 10 m downstream of the engine. Organic species with higher initial concentrations in the more volatile vapor pressure bins are the major components. This suggests that activation of soot surfaces via adsorption of volatile vapors is the more dominant process than vapor condensation in this region, since the temperature of the exhaust plume is still too high for most species to condense. Note that although pentanoic acid, naphthalene, and anthracene are responsible for more than half of the soot coating mass in this region, total soot coating mass is still very small (). As the plume cools in the atmosphere, less volatile species, such as sulfuric acid, perylene, and anthanthrene begin to condense on soot surfaces and become the major components in soot coatings even though their initial concentrations are lower than the more volatile species. In summary, our simulation results suggest that activation of soot surfaces, whose rates are proportional to the species’ vapor phase concentrations, is more important immediately after the engine exit plane, whereas condensation of volatile vapors, whose rates are dependent on species’ saturation vapor pressure, is more important further downstream. Consequently, for sampling locations of more than 10 m downstream of an engine, soot coatings likely consist of sulfuric acid, water, and emitted organic species with low volatility (with a C* lower than 1 μg/m3).
FIG. 2. Representative modeling results following plume centerline trajectory up to 1000 m downstream: (a) soot coating composition as a function of downstream distance; (b) size-dependent surface coverage at 1000 m downstream; (c) size-resolved composition of soot coatings at 1000 m downstream; (d) size evolution of coated soot particles; (e) dilution factor as a function of downstream distance.
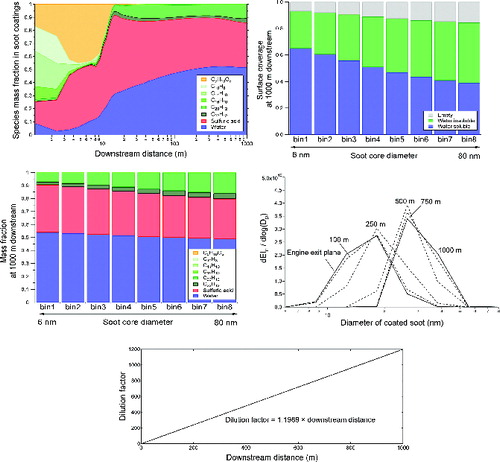
The size of emitted soot particles at the engine exit plane also has an impact on the composition of soot coatings. shows predicted hydrophilic and hydrophobic soot surface coverage at 1000 m downstream of the engine as a function of initial soot (core) sizes. As illustrated in the figure, larger soot cores result in smaller overall surface coverage (i.e., larger empty surface fractions). This can be explained by Equation (6), where the quantity is roughly inversely proportional to soot core diameter squared (because
is proportional to soot core diameter, as described in Equation (4), and
is inversely proportional to soot core diameter cubed, as described in the online supplemental information). Since sulfuric acid condenses earlier than any other species due to its low volatility (), the change in surface coverage starts with hydrophilic fraction first. As a result, smaller soot cores present less available soot surfaces for water insoluble organic species to condense on, causing soot surfaces to be more hydrophilic on smaller soot particles at 1000 m downstream. This difference in soot surface coverage also causes increased sulfuric acid mass fraction and decreased organic mass fraction with decreasing soot particle core size at 1000 m downstream of the engine, as depicted in . Note that actual hydrophobic or hydrophilic coverage on soot may be very different from model predictions, especially when coatings become thicker. Because modeling the complicated wetting process on soot is not the main focus of this work, our analysis on soot surface hydrophilicity in this section only serves as a mean to advance our understanding of soot microphysics and evolution of soot coating compositions.
The growth of soot coatings can be described as size distributions shown in . As depicted in the figure, the majority of the particle growth took place in between 100 and 500 m downstream of the engine. This suggests that the exhaust plume in this region has sufficiently low temperature to facilitate condensation before plume dilution becomes more important further downstream. Note that smaller particles have faster growth than the larger particles due to smaller available surface areas, resulting narrower particle size distributions. Particle growth after 500 m was modest. The final mean diameter of soot particles reached about 30 nm at 1000 m downstream. This can be viewed as an upper bound of soot growth at this condition, since binary homogeneous nucleation of sulfuric acid and water was not considered in this simulation, and a fraction of the soot coating mass is expected to be in the homogeneous nucleation mode particles and not in the soot coatings if this pathway is considered.
Our simulation shows that soot activation and condensation of sulfuric acid and organic vapors take place mostly in the first 500 m downstream of the engine, as clearly illustrated in Figures and . As described earlier, our model estimates dilution factor (total moles of gas in a unit plume volume divided by moles of gas originally emitted from the engine in the same volume) based on a semi-empirical, self-similar approach (Davidson and Wang Citation2002). Using this methodology, our model estimates that centerline plume dilution factor is linearly dependent on downstream distance (as illustrated in ), and plume dilution happens very rapidly in the first 1000 m, reaching a dilution factor of about 1200. To this reason, the only significant microphysical process further downstream is likely to be gas-particle partitioning of the volatile species depending on local saturation levels. Note that the dilution factor estimated from our model only considers ideal conditions in the plume centerline. This assumption was shown to be robust when the downstream distance of interest is less than 1000 m (Wong et al. Citation2008), since the plume is still in the strong jet, weakly advected region (Davidson and Wang Citation2002). Plume dilution factor more than 1000 m downstream is subject to many more variables (such as wind conditions, local air flows, temperature, and pressure gradient, etc.). This can be handled by state-of-the-art large scale models and is not the focus of our work.
3.2. Effects of Ambient Conditions
Ambient temperature and relative humidity levels were found to be important in PM formation microphysics in our previous modeling work where organic species were not included (Wong et al. Citation2008). To examine the sensitivity of soot microphysics to ambient conditions in the presence of organic species, several model simulations were performed using the same assumptions described in Section 3.1 but with different ambient temperature or relative humidity levels. Our simulation results suggest that higher ambient temperature suppresses soot microphysics, as evidenced by smaller soot coatings. Less amount of organic mass is converted into liquid soot coatings (as opposed to staying in the vapor phase) at higher ambient temperatures at 1000 m downstream of the engine (). This suppression is due to higher saturation vapor pressure at higher ambient temperature, which decreases the rates of condensation for volatile species. The suppression is also more marked for organic species than sulfuric acid due to the relative insensitivity of sulfuric acid saturation vapor pressure to temperature. This is also illustrated in where organic to sulfuric acid mass ratio and organic mass fraction on soot both decrease with increasing ambient temperature.
FIG. 3. Effect of (a) ambient temperature and (b) ambient relative humidity levels on the soot properties at 1000 m downstream of the engine.
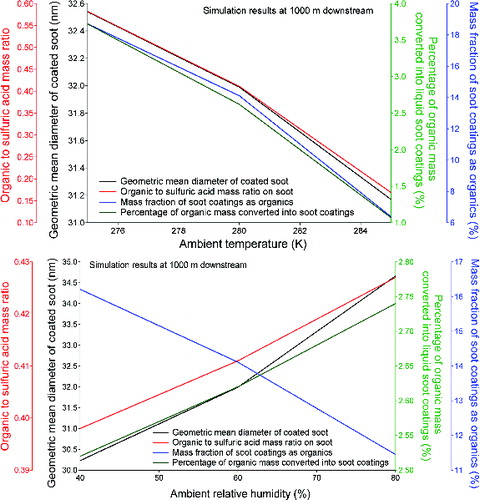
The effect of ambient relative humidity levels is more complex, as shown in . On one hand, higher relative humidity level slightly promotes the growth of soot coatings. This promotion is especially marked for organic species, as evidenced by increased percentage of organic mass converted into liquid soot coatings and increased organic to sulfuric acid mass ratio in soot coatings predicted at 1000 m downstream of the engine. However, mass fraction of soot coatings as organics decreases with increasing relative humidity levels. This suggests that even more water condenses on the activated fraction of soot surfaces at higher ambient relative humidity levels, and most of the difference in soot particle size resulted from ambient relative humidity levels is due to condensation of ambient water vapor.
Overall, our simulations with organic soot microphysics considered give the same trend that lower ambient temperature and higher ambient relative humidity would promote the formation of soot coatings. It was also observed from our runs that organic species are more sensitive to changes in ambient conditions than sulfuric acid.
3.3. Effects of Initial Organic Concentrations
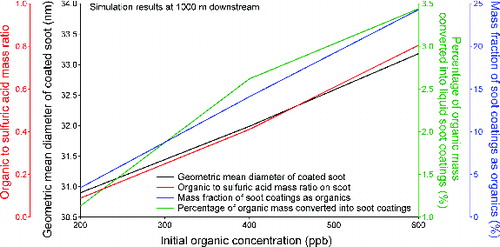
Since the exact amount of organic emissions and speciation distribution at the engine exit plane remains uncertain, a sensitivity study focusing on the effect of initial organic concentration will help determine uncertainties incurred in our simulations. Our first exercise was to vary total initial organic concentrations, from 200 to 600 ppb. As expected, higher organic emissions (i.e., higher initial organic concentration at the engine exit plane) resulted in larger soot coatings and higher percentage of organic mass converted into liquid soot coatings at 1000 m downstream of the engine, as shown in . The organic to sulfuric acid mass ratio and mass fraction of soot coatings as organics also increase linearly with increasing organic emissions. Compared to , however, the increase in soot particle size at higher initial organic concentrations is mostly due to condensation of semi-volatile organic vapors, as opposed to ambient water vapor.
FIG. 4. Effect of initial organic concentration in the vapor phase on the soot properties at 1000 m downstream of the engine.
The distribution of organic emissions at the engine exit plane may also play a role. Besides the baseline distribution we studied in , we examined four additional distributions of organic emissions at the engine exit plane, as shown in . Compared to the baseline case in , these distributions were either more water soluble (i.e., containing more pentanoic acid, ), more water insoluble (containing less pentanoic acid, ), more volatile (having more organics distributed in the higher C* bins, ), or less volatile (having more organics distributed in the lower C* bins, ). The total organic concentration, however, was set to be the same at 400 ppb for all five distributions for consistency.
FIG. 5. Additional distributions of organic concentrations at the engine exit plane selected for our parametric study for the effect of initial organic concentration.
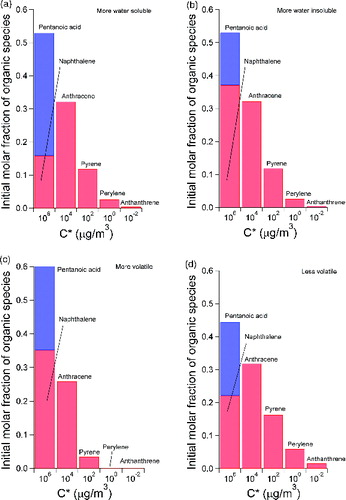
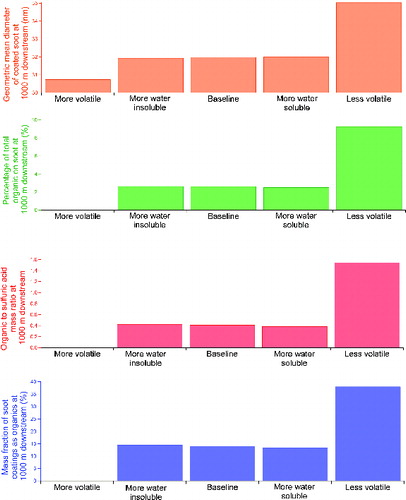
The predicted soot properties with different starting distributions of organic concentrations are shown in . It can be clearly seen that volatility is the most critical factor in affecting soot microphysics, and an initial concentration distribution with more organic molar fraction in the low volatility bins () gives significantly thicker soot coatings () and more condensed organic mass (). The composition of soot coatings at 1000 m downstream is also more organic rich, where the organic to sulfuric acid mass ratio in the coatings is about 1.5 () and the mass fraction of soot coatings as organics exceeds 35% (). On the other hand, the effect of water solubility of the organic emissions at the engine exit plane is very minor. Our simulation results in suggest that higher fraction of water insoluble organics in the first C* bin () only slightly promotes organic condensation on soot (Figures ), whereas the final soot particle size at 1000 m downstream remains similar for the three cases varying water solubility (). In summary, our parametric study on initial organic concentration suggests that the amount of organics in the low volatility bins, with a C* value lower than 1 μg/m3, is the strongest determining factor affecting soot mode PM growth in near field aircraft plumes.
FIG. 6. Effect of organic distribution at the engine exit plane on the soot properties at 1000 m downstream of the engine.
3.4. Effects of Mass Accommodation Coefficients
Mass accommodation coefficients used in our model play a critical role in determining rates of interactions between organic species and soot surfaces. Estimating the values of mass accommodation coefficients for the surrogate organic species, however, is a very challenging task since only limited information is available in the literature. Our model simulations used certain default values for mass accommodation coefficients, reflecting our best guesses based on literature data. To examine the sensitivity of our assumptions, a parametric study on the effect of mass accommodation coefficients was performed.
Two different types of mass accommodation coefficients exist in our model formulation: “dry” mass accommodation coefficient that is responsible for the surface activation process (Equations (2) and (3)), and “wet” mass accommodation coefficient that is responsible for the volatile vapor condensation process (Equations (4) and (5)). Each mass accommodation coefficient type can also be applied to either water soluble or water insoluble organic species, making a total of four variations. In our parametric study, mass accommodation coefficients of different species with the same type was set to the same value and varied within a reasonable range to understand their potential effects.
and depict predicted soot properties at 1000 m downstream of the engine when different values of mass accommodation coefficients were used in the model. As discussed earlier, the activation of soot surfaces by vapor molecules is directly affected by dry mass accommodation coefficients. Larger dry mass accommodation coefficients promote surface activation, resulting in more available soot surfaces for further vapor condensation. This explains why thicker soot coatings were predicted from our model when dry mass accommodation coefficient for water soluble organic species increased from 0 to 0.1 and when dry mass accommodation coefficient for water insoluble organic species increased from 0 to 0.01, as shown in . When dry mass accommodation coefficient for water insoluble organic species is greater than 0.01, however, the effect is more complex since enhanced activation of water insoluble species started to suppress condensation of sulfuric acid and water, resulting in a net effect on soot size close to zero. The effect of dry accommodation coefficients on soot compositions is also different between water soluble and water insoluble organic species. Increased dry mass accommodation coefficients for water soluble species promotes more water soluble vapors, including sulfuric acid and water itself, to condense on soot surfaces, resulting in decreases in organic to sulfuric acid mass ratio on soot, percentage of organic mass converted into liquid soot coatings, and mass fraction of soot coatings as organics at 1000 m downstream of the engine (). For water insoluble organic species, increased dry accommodation coefficients causes an opposite effect, since condensation of water insoluble organic species is in turn promoted. This promotion, as shown in , appears to be most rapid in the region where dry mass accommodation coefficients are less than 0.01, suggesting that any dry mass accommodation coefficients for water insoluble organic species larger than this value will not have significant impact on soot properties at 1000 m downstream of the engine.
FIG. 7. Effect of dry mass accommodation coefficients for (a) water soluble organic species and (b) water insoluble organic species on the soot properties at 1000 m downstream of the engine.
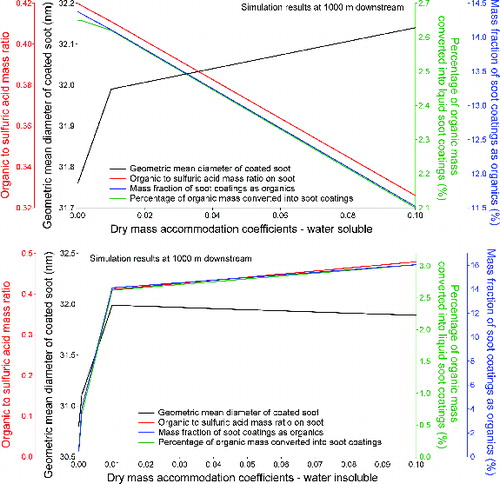
FIG. 8. Effect of wet mass accommodation coefficients for (a) water soluble organic species and (b) water insoluble organic species on the soot properties at 1000 m downstream of the engine.
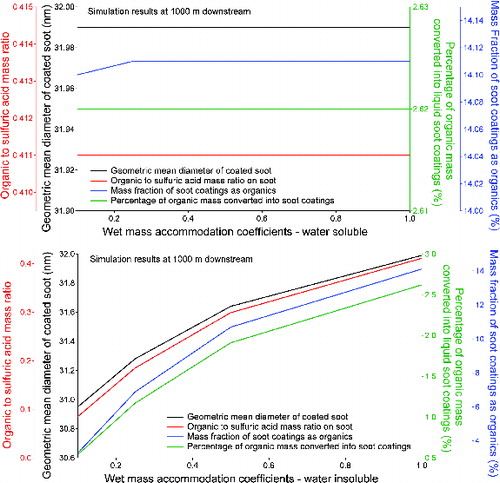
Since our model only considers water soluble organic species in the most volatile bin (with a C* value of 106 μg/m3), condensation of water soluble organic species is negligible in our model simulations. The effect of wet mass accommodation coefficients for water soluble organic species is therefore insignificant, as illustrated in . For water insoluble organic species, increased wet mass accommodation coefficients increases the condensation rates of organic vapors on soot surfaces. This results in thicker and more organic-rich soot coatings, as depicted in .
In summary, our parametric study on mass accommodation coefficients suggests that increased dry mass accommodation coefficients for both water soluble and water insoluble organic species promotes growth of soot coatings. Larger dry mass accommodation coefficients for water soluble organic species favors condensation of other water soluble species, such as sulfuric acid and water itself, whereas larger dry mass accommodation coefficients for water insoluble organic species favors condensation of water insoluble organic species and coatings to be more organic-rich. For wet mass accommodation coefficients, no significant effect was predicted for water soluble organic species since they are too volatile to condense. For water insoluble species, increased wet mass accommodation coefficients promotes condensation and increases soot coating size and organic mass on soot. Our calculation results were more sensitive to dry and wet mass accommodation coefficients for water insoluble organic species compared to those for water soluble organic species.
Note that the microphysical processes sensitive to the parameters investigated above are soot activation and vapor condensation. As mentioned earlier, both processes mostly take place within the first 500 m downstream of the engine. After 1000 m downstream of the engine, the only significant process is likely to be gas-particle partitioning of the volatile species depending on local saturation levels. To this reason, we expect the parametric sensitivity discussed in this section would be decreased with downstream distance.
4. CONCLUSIONS
A detailed microphysical model previously developed to study PM evolution in near field aircraft emitted plumes was extended to study soot microphysics in the presence of organic emissions. Our new formulation considers the activation and condensation processes of organic species. Several organic surrogate species representing organic emissions from modern gas turbine engines were selected for our modeling study. Methodologies were developed for estimating chemical and physical properties of the aerosols containing complex mixtures of sulfuric acid, water, and various organic molecules. A parametric study on ambient conditions, organic emissions levels, and mass accommodation coefficient values was performed to understand critical factors in volatile PM evolution in near field aircraft emitted plumes. Our simulation results suggest the following key findings:
Activation of soot surfaces is more important immediately after the engine exit plane whereas condensation of volatile vapors is more important further downstream. For sampling locations of more than 10 m downstream of an engine, soot coatings likely consist of sulfuric acid, water and emitted organic species with low volatility.
Sizes of soot cores have an effect on soot coating composition. Under the conditions we studied, coatings on larger soot cores are more organic-rich with larger hydrophobic (water insoluble) surface coverage even though the overall surface coverage (hydrophilic plus hydrophobic) is smaller.
The majority of soot coating growth takes place when the exhaust plume is sufficiently cooled but before plume dilution becomes significant.
Higher ambient temperature suppresses soot microphysics, and this suppression is more marked for organic species than sulfuric acid.
Higher ambient relative humidity promotes the growth of soot coatings, increasing the amount of emitted organic and ambient water condensation on soot particles.
For the effect of initial organic concentrations at the engine exit plane, our simulations suggest that the amount of organic emissions with a C* value lower than 1 μg/m3 is most critical to soot mode PM growth in near field aircraft plumes.
For the effect of mass accommodation coefficients, our simulations suggest that increased dry mass accommodation coefficients for both water soluble and water insoluble organic species promotes growth of soot coatings below certain values (0.01 under the conditions we studied). For wet mass accommodation coefficients, no significant effect was predicted for water soluble organic species, whereas increased wet mass accommodation coefficients for water insoluble organic species promotes condensation that increases soot coating size and organic mass on soot.
SUPPLEMENTAL MATERIAL
Supplemental data for this article can be accessed on the publisher's website.
Supplemental_Information.zip
Download Zip (82 KB)Additional information
Funding
REFERENCES
- Arunachalam, S., Woody, M., Rissman, J., Binkowski, F., Wong, H.-W., Jathar, S., and Robinson, A. (2014). An Enhanced Sub-Grid Scale Approach to Characterize Air Quality Impacts of Aircraft Emissions, in Air Pollution Modeling and Its Application XXII, D. G. Steyn, P. J. H. Builtjes, and R. M. A. Timmermans, eds. Springer Publications, Dordrecht, Netherlands, Chapter 55, pp. 327–332, ISBN: 978-94-007-5576-5.
- Asher, W., and Pankow, J. (2006). Vapor Pressure Prediction for Alkenoic and Aromatic Organic Compounds by a Unifac-Based Group Contribution Method. Atmos. Environ., 40:3588–3600.
- Brown, R. C., Miake-Lye, R. C., Anderson, M. R., Kolb, C. E., and Resch, T. J. (1996). Aerosol Dynamics in Near-Field Aircraft Plumes. J. Geophys. Res., 101:22939–22953.
- Clegg, S. L., and Seinfeld, J. H. (2006). Thermodynamic Models of Aqueous Solutions Containing Inorganic Electrolytes and Dicarboxylic Acids at 298.15 K. 1. The Acids as Nondissociating Components. J. Phys. Chem. A, 110:5692–5717.
- Davidson, M. J., and Wang, H. J. (2002) Strongly Advected Jet in a Coflow. J. Hydraulic Eng., 128:742–752.
- Donahue, N. M., Robinson, A. L., Stanier, C. O., and Pandis, S. N. (2006). Coupled Partitioning, Dilution, and Chemical Aging of Semivolatile Organics. Environ. Sci. Technol., 40:2635–2643.
- Jensen, T., Fredenslund, A., and Rasmussen, P. (1981). Pure-Component Vapor Pressures Using Unifac Group Contribution. Ind. Eng. Chem. Fundamen., 20:239–246.
- Jun, M. (2011). Microphysical Modeling of Ultrane Hydrocarbon-Containing Aerosols in Aircraft Emissions. PhD Thesis, Department of Aeronautics and Astronautics, Massachusetts Institute of Technology, Cambridge, MA.
- Kanakidou, M., Seinfeld, J. H., Pandis, S. N., Barnes, I., Dentener, F. J., Facchini, M. C., et al. (2005). Organic Aerosol and Global Climate Modelling: A Review. Atmos. Chem. Phys., 5:1053–1123.
- Knighton, W. B., Rogers, T. M., Anderson, B. E., Herndon, S. C., Yelvington, P. E., and Miake-Lye, R. C. (2007). Quantification of Aircraft Engine Hydrocarbon Emissions Using Proton Transfer Reaction Mass Spectrometry. J. Propul. Power, 23:949–958.
- Kärcher, B. (1998). Physicochemistry of Aircraft-Generated Liquid Aerosols, Soot, and Ice Particles. 1. Model Description. J. Geophys. Res.-Atmos., 103:17111–17128.
- Kärcher, B., Peter, T., and Biermann, U. (1996). The Initial Composition of Jet Condensation Trails. J. Atmos. Sci., 53:3066–3083.
- Kärcher, B., and Yu, F. (2009). Role of Aircraft Soot Emissions in Contrail Formation. Geophys. Res. Lett., 36:L01804, doi: 10.1029/2008GL036649.
- Larsen, B., Rasmussen, P., and Fredenslund, A. (1987). A Modified UNIFAC Group-Contribution Model for Prediction of Phase Equilibria and Heats of Mixing. Ind. Eng. Chem. Res., 26:2274–2286.
- Lobo, P., Hagen, D. E., Whitefield, P. D., Alofs, D. J. (2007). Physical Characterization of Aerosol Emissions From a Commercial Gas Turbine Engine. J. Propul. Power, 23:919–929.
- Nannoolal, Y., Rarey, J., and Ramjugernath, D. (2007). Estimation of Pure Component Properties Part 2. Estimation of Critical Property Data by Group Contribution. Fluid Phase Equilibria, 252:1–27.
- Nannoolal, Y., Rarey, J., and Ramjugernath, D. (2008). Estimation of Pure Component Properties Part 3. Estimation of the Vapor Pressure of Non-Electrolyte Organic Compounds via Group Contributions and Group Interactions. Fluid Phase Equilibria, 269:117–133.
- Nannoolal, Y., Rarey, J., Ramjugernath, D., and Cordes, W. (2004). Estimation of Pure Component Properties Part 1. Estimation of the Normal Boiling Point of Non-Electrolyte Organic Compounds via Group Contributions and Group Interactions. Fluid Phase Equilibria, 226:45–63.
- Onasch, T. B., Jayne, J. T., Herndon, S. C., Worsnop, D. R., Miake-Lye, R. C., Mortimer, I. P., et al. (2009). Chemical Properties of Aircraft Engine Particulate Exhaust Emissions. J. Propul. Power, 25:1121–1137.
- Pankow, J., and Asher, W. (2008). SIMPOL. 1: A Simple Group Contribution Method for Predicting Vapor Pressures and Enthalpies of Vaporization of Multifunctional Organic Compounds. Atmos. Chem. Phys., 8:2773–2796.
- Peck, J., Yu, Z., Wong, H.-W., Miake-Lye, R., Liscinsky, D., Jennings, A., and True, B. (2014). Experimental and Numerical Studies for Sulfate and Organic Condensation on Aircraft Engine Soot. Proceedings of ASME Turbo Expo 2014, GT2014–25227.
- Persiantseva, N., Popovicheva, O., and Shonija, N. (2004). Wetting and Hydration of Insoluble Soot Particles in the Upper Troposphere. J. Environ. Monitor., 6:939–945.
- Petzold, A., Gysel, M., Vancassel, X., Hitzenberger, R., Puxbaum, H., Vrochticky, S., et al. (2005). On the Effects of Organic Matter and Sulphur-Containing Compounds on the Ccn Activation of Combustion Particles. Atmos. Chem. Phys., 5:3187–3203.
- Poling, B. E., Prausnitz, J. M., and O’Connell, J. P. (2001). The Properties of Gases and Liquids. McGraw-Hill, New York, NY.
- Pope, C. A., and Dockery, D. (2006). Health Effects of Fine Particulate Air Pollution: Lines That Connect. J. Air & Waste Manage. Assoc., 56:709–742.
- Presto, A. A., Nguyena, N. T., Ranjana, M., Reedera, A. J., Lipskyb, E. M., Hennigana, C. J., et al. (2011). Fine Particle and Organic Vapor Emissions from Staged Tests of An In-Use Aircraft Engine. Atmos. Environ., 45: 3603–3612.
- Pruppacher, H. R., and Klett, J. D. (1997). Microphysics of Clouds and Precipitation. Kluwer Academic Publishers, Dordrecht, The Netherlands.
- Riemer, N., West, M., Zaveri, R. A., and Easter, R. C. (2009). Simulating the Evolution of Soot Mixing State with a Particle-Resolved Aerosol Model. J. Geophys. Res., 114:D09202.
- Robinson, A. L., Donahue, N. M., Shrivastava, M. K., Weitkamp, E. A., Sage, A. M., Grieshop, A. P., et al. (2007). Rethinking Organic Aerosols: Semivolatile Emissions and Photochemical Aging. Science, 315:1259–1262.
- Schwarz, J. P., Spackman, J. R., Fahey, D. W., Gao, R. S., Lohmann, U., Stier, P., et al. (2008). Coatings and Their Enhancement of Black Carbon Light Absorption in the Tropical Atmosphere. J. Geophys. Res.-Atmos., 113:D03203, doi: 10.1029/2007JD009042.
- Seaton, A., Godden, D., MacNee, W., and Donaldson, K. (1995). Particulate Air Pollution and Acute Health Effects. The Lancet, 345:176–178.
- Seinfeld, J. H., and Pandis, S. N. (1998). Atmospheric Chemistry and Physics - from Air Pollution to Climate Change. John Wiley & Sons, Inc., New York, NY.
- Taleb, D., Ponche, J., and Mirabel, P. (1996). Vapor Pressures in the Ternary System Water-Nitric Acid-Sulfuric Acid at Low Temperature: A Reexamination. J. Geophys. Res.-Atmos., 101:25967–25977.
- Tian, J., Riemer, N., West, M., Pfaffenberger, L., Schlager, H., and Petzold, A. (2014). Modeling the Evolution of Aerosol Particles in a Ship Plume Using PartMC-MOSAIC. Atmos. Chem. Phys., 14:5327–5347.
- Timko, M. T., Albo, S. E., Onasch, T. B., Fortner E. C., Yu, Z., Miake-Lye, R. C., et al. (2014). Composition and Sources of the Organic Particle Emissions from Aircraft Engines. Aerosol. Sci. Technol., 48:61–73.
- Timko, M. T., Fortner, E., Franklin, J., Yu, Z., Wong, H.-W., Onasch, T. B., Miake-Lye, R. C., and Herndon, S. C. (2013). Atmospheric Measurements of the Physical Evolution of Aircraft Exhaust Plumes. Environ. Sci. Technol., 47:3513–3520.
- Timko, M. T., Herndon, S. C., Wood, E. C., Onasch, T. B., Northway, M. J., Jayne, J. T., Canagaratna, M., Miake-Lye, R. C., and Knighton, W. B. (2010a). Gas Turbine Engine Emissions Part 1. Hydrocarbons and Nitrogen Oxides. ASME J. Eng. Gas Turbines Power, 132: 061504/061501-061504/061514.
- Timko, M. T., Onasch, T. B., Northway, M. J., Jayne, J. T., Canagaratna, M., Herndon, S. C., Wood, E. C., Miake-Lye, R. C., and Knighton, W. B. (2010b). Gas Turbine Engine Emissions Part 2. Chemical Properties of Particulate Matter. ASME J. Eng. Gas Turbines Power, 132:061505, doi: 10.1115/1.4000132.
- Wey, C. C., Anderson, B. E., Wey, C., Miake-Lye, R. C., Whitefield, P., and Howard, R. (2007). Overview on the Aircraft Particle Emissions Experiment. J. Propul. Power, 23:898–905.
- Wong, H.-W., Beyersdorf, A. J., Heath, C. M., Ziemba, L. D., Winstead, E. L., Thornhill, K. L., et al. (2013). Laboratory and Modeling Studies on the Effects of Water and Soot Emissions and Ambient Conditions on the Properties of Contrail Ice Particles in the Jet Regime. Atmos. Chem. Phys., 13:10049–10060.
- Wong, H.-W., and Miake-Lye, R. C. (2010). Parametric Studies of Contrail Ice Particle Formation in Jet Regime Using Microphysical Parcel Modeling. Atmos. Chem. Phys., 10:3261–3272.
- Wong, H.-W., Yelvington, P. E., Timko, M. T., Onasch, T. B., Miake-Lye, R. C., Zhang, J., et al. (2008). Microphysical Modeling of Ground-Level Aircraft-Emitted Aerosol Formation: Roles of Sulfur-Containing Species. J. Propul. Power, 24:590–602.
- Wong, H.-W., Yu, Z., Timko, M. T., Herndon, S. C., de la Rosa Blanco, E., and Miake-Lye, R. C. (2011). Design Parameters for an Aircraft Engine Exit Plane Particle Sampling System. ASME J. Eng. Gas Turbines Power, 133:021501, doi: 10.1115/1.4001979.
- Yelvington, P. E., Herndon, S. C., Wormhoudt, J. C., Jayne, J. T., Miake-Lye, R. C., Knighton, W. B., and Wey, C. (2007). Chemical Speciation of Hydrocarbon Emissions from a Commercial Aircraft Engine. J. Propul. Power, 23:912–918.
- Yu, Z., Liscinsky, D. S., True, B., Peck, J., Jennings, A. C., Wong, H.-W., et al. (2014) Uptake Coefficient of Some Volatile Organics Compounds by Soot and Their Application in Understanding Particulate Matter Evolution in Aircraft Engine Exhaust Plumes. ASME J. Eng. Gas Turbines Power, 136: 121501, doi: 10.1115/1.4027707.
- Zaveri, R. A., Easter, R. C., Fast, J. D., and Peters, L. K. (2008). Model for Simulating Aerosol Interactions and Chemistry (MOSAIC). J. Geophys. Res., 113:D13204.
- Zhang, D., and Zhang, R. (2005). Laboratory Investigation of Heterogeneous Interaction of Sulfuric Acid with Soot. Environ. Sci. Technol., 39:5722–5728.