Abstract
A new ultrasonic spray pyrolysis method, called carbon nanoparticle-addition ultrasonic spray pyrolysis (CNA-USP), is developed to synthesize nanoparticles of electrolyte material for solid oxide fuel cell applications. In CNA-USP, carbon nanoparticles are added in a precursor solution. First, Gd0.1Ce0.9O1.95 (GDC) particles were synthesized from an aqueous solution of Ce(NO3)3 6H2O and Gd(NO3)3 6H2O by using the CNA-USP method. The resulting synthesized GDC particles were agglomerated, porous, primary particles on the order of 10 nm in diameter. EDX images revealed uniform distributions of Ce, Gd, and O in these porous particles. Then, these agglomerated, porous submicron GDC particles were ground into primary nanoparticles by ball milling for 24 h. The average diameter of the ground GDC nanoparticles was about double of their average crystallite size.
Copyright 2014 American Association for Aerosol Research
INTRODUCTION
Solid oxide fuel cells (SOFCs) operated at temperatures of 1173–1273 K have been used primarily for stationary applications such as large-scale stationary power plants, because SOFCs (1) have high energy conversion efficiency, (2) do not require expensive catalysts, such as Pt, and (3) can use a wide range of fuels, including natural gas, propane, butane, and alcohols. However, high temperatures require the use of expensive ceramic components and preclude the use of less expensive metal components for any of the non-electrochemical components of the fuel cell, thus increasing the likelihood of cracks developing during thermal cycling. To permit the use of less expensive metal components in SOFCs, major research efforts have focused on reducing the operating temperature below 1073 K (Haile Citation2003). SOFCs consist of an anode, a cathode, and a dense electrolyte sandwiched between these electrodes. To reduce the operating temperature, it is important that the electrolyte material has high ionic conductivity and that thin films about 10–15 μm in thickness are used (Haile Citation2003). Recently, Ce1-xGdxO2-δ (GDC) and Ce1-xSmxO2-δ have been extensively investigated as potential electrolyte materials because they have high conductivity at intermediate temperatures of 873–973 K (Brandon et al. Citation2004a,Citationb). The cosintering process of electrolyte films and anode substrates (used as a support for electrolyte films) have been investigated as a fabrication method for intermediate-temperature SOFCs (i.e., IT-SOFC) because they do not use expensive and up-scaling difficult thin-film formation equipment such as CVD and PVD methods (Will et al. Citation2000; Brandon et al. Citation2004a,Citationb; Beckel et al. Citation2007; Liu et al. Citation2007). In the cosintering process, the anode substrate is coated by using a slurry in which a submicron-meter-sized powder of electrolyte material is suspended to form thin electrolyte films. For IT-SOFC it is optimum for the electrolyte film to be as thin as possible, such as a few hundred nanometers in thickness. However, it is difficult to prepare films thinner than a few microns by using slurry coating. Development of a new thin film formation process is, therefore, necessary to realize ultrathin electrolyte films.
We have proposed a novel process to form ultrathin electrolyte films as follows (Arastoo et al. Citation2012). First, porous submicron agglomerates of nanoparticles composed of electrolyte material are synthesized and broken up into individual nanoparticles by using liquid ball milling. Next, the electrolyte nanoparticles are suspended in a solvent and the suspension is spread on the anode substrate by using spin coating or spray coating to form a nanoparticle thin film. Finally, the nanoparticle film is annealed in a furnace to form a dense thin film. As a first step in the development of this process, we must develop a new method for synthesizing porous, submicron particles.
Ultrasonic spray pyrolysis (USP) has been typically used to prepare complex oxides of submicron particles because this method can form highly crystalline oxides from one solution in which three or four precursors are dissolved in stoichiometric ratios of complex oxides. Various oxides such as zirconia, yttria-stabilized zirconia, alumina/platinum composite, ZnO, BaO, ceria, NiO-ceria composite, and LiM2O4 have been prepared by using USP (Messing et al. Citation1993; Djurado and Meunier Citation1998; Okuyama and Lenggoro Citation2003; Gaudon et al., Citation2004; Matsuda and Taniguchi Citation2004; Chen et al., Citation2008). Additionally, complex oxides with high crystallinity can be continuously prepared during one passage of source mist in a flow-type reactor. Therefore, USP is a strong candidate as an inexpensive synthesis process for SOFC materials. Recently, Suda et al. (Citation2006) and Kawano et al. (Citation2011) used USP to synthesize NiO-Sm0.2Ce0.8O1.9 (NiO-SCO) composite particles for use as SOFC anode materials. Mesguich et al. (Citation2010) used USP to synthesize Nd2NiO4+δ particles for use as SOFC cathode materials. Our research group also synthesized Gd0.1Ce0.9O1.95, NiO-Gd0.1Ce0.9O1.95 composites, and La0.8Sr0.2Co3 (LSC) particles for use as electrolyte, anode, and cathode materials, respectively (Kinoshita and Adachi Citation2014). Taken together, these processes represent a new USP method for synthesizing porous submicron GDC particles that we call carbon nanoparticle-addition ultrasonic spray pyrolysis (CNA-USP) (Arastoo et al. Citation2012).
In this study, we describe a method for first synthesizing porous submicron GDC particles using the CNA-USP method, and then grinding with a liquid ball mill to prepare the nanoparticle suspension for use in the spin-coating method.
CNA-USP METHOD
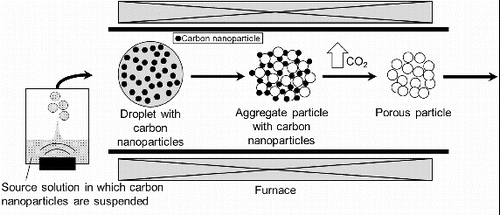
shows the concept of the CNA-USP method (Arastoo et al. Citation2012). First, the aqueous solution of dissolved precursors and suspended carbon nanoparticles is atomized by using an ultrasonic nebulizer, which forms micron-sized droplets. Droplets containing carbon nanoparticles are sent to a furnace via a carrier gas. In the furnace, the complex of precursors is deposited in droplets, and then evaporation of the water causes the formation of either solid or amorphous submicron particles containing carbon nanoparticles. Next, the material is produced from the precursor complex by thermal decomposition and crystallization by further heating of the submicron particles. Finally, carbon nanoparticles in crystallized submicron particles are oxidized to CO2 gas by combustion and then evaporated from the submicron particles. As a result, porous submicron particles are formed.
EXPERIMENT
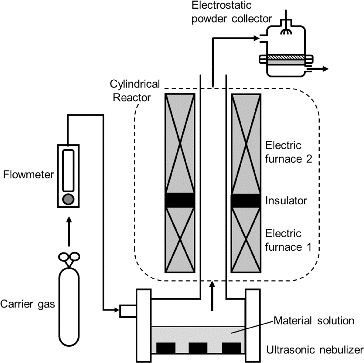
shows a schematic of the experimental apparatus for the CNA-USP method, consisting of (1) an ultrasonic nebulizer to convert from the precursor solution to micron-sized droplets; (2) a cylindrical furnace to form complex oxide particles by thermal decomposition; and (3) an electrostatic precipitator to collect product particles. In the nebulizer, a precursor solution was vibrated by six ultrasonic oscillators at a frequency of 2.4 MHz (Honda Electronics, HM-2412) and was converted to mist droplets a few microns in diameter. The droplets were then carried into the cylindrical reactor (a ceramic tube of 50 mm inner diameter and 640 mm total length) with air at a flow rate Q = 5 L min−1. The reactor was heated by two electric furnaces; an upper flow side furnace (Furnace 1; 130 mm in length) kept at TL = 673 K, and a lower flow side furnace (Furnace 2; 400 mm in length) set at various TH from 873 to 1473 K. Both furnaces were set at an interval of 110 mm and the rector tube between both furnaces was covered by the insulator. The average residence time in the reactor zone heated by the Furnace 2 (tr = 9.4 s at Q = 5 L min−1) was used as the reaction time in CNA-USP method because we thought that the oxidization of carbon nanoparticles and the thermal decomposition of precursor occurred in the high temperature zone. We used the preheating temperature of TL = 673 K because the temperature of the reactor zone heated by the Furnace 2 did not attain to TH when the Furnace 1 was not used. In the reactor, solid particles were produced by thermal decomposition of precursors after the evaporation of the solvent and precipitation of the solute in droplets. The synthesized particles were collected by using an electrostatic particle precipitator (EPP) (Okuyama et al. Citation1993), which was kept at 403 K using an electric heater to prevent the condensation of water on its walls. The crystalline phase of the synthesized particles was characterized by powder X-ray diffraction (XRD, RIGAKU RINT1500) and the particle shape by scanning electron microscopy (SEM, Hitachi S-4500). The local distributions of metals and oxygen in the particles were evaluated based on energy dispersive X-ray spectrometry (EDX) images. The size distributions of agglomerate particles were measured by dynamic light scattering spectrophotometry (DLS, Otsuka Electronics, ELSZ-2ON). The thermalgravimetric (TG) analysis was carried by thermo gravimetry analyzer (Bruker, MS9610) to evaluate the mass of carbon remaining in synthesized particles. The data were measured in helium gas at the heating rate of 10 K min−1.
FIG. 2. Apparatus for synthesizing SOFC electrolyte material particles using ultrasonic spray pyrolysis (CNA-USP).
The precursor solution was prepared by dissolving Ce(NO3)3·6H2O and Gd(NO3)3·6H2O in pure water at a stoichiometric ratio of Gd0.1Ce0.9O1.95. The concentration of total metal ions Ctotal was kept at 0.02 mol L−1. Carbon nanoparticles with carboxyl group on their surfaces (commercial name is Aqua-Black 162, Tokai Carbon Co.) were selected as the carbon source because they are hydrophilic. The average diameter of carbon nanoparticles measured by DLS (Nikkiso, UPA-EX) was 100 nm. Different concentrations of carbon nanoparticles Cc were evaluated from 0 to 24 g L−1. The maximum production rate of the apparatus and yield calculated from the volume of the sprayed precursor solution and the mass of the collected particles were about 3 g h−1 and 70–80% at the synthesis condition of Q = 5 L min−1 and Ctotal = 0.02 mol L−1, respectively.
Synthesized particles were then ground by using a tumbling ball mill to qualitatively estimate the toughness of the particles. Particles (100 mg) were suspended in ethanol (70 mL). The suspension (70 mL) was then put in a polypropylene pot (61 mm deep, 57 mm inner diameter) together with zirconia balls (70 g balls of 3.0-mm-diameter). The pot was rotated at 108 rpm and different grinding times tg were varied from 0.5 to 24 h. The shapes of the particles before and after grinding were observed by SEM and their size distributions by DLS. The specific surface areas of particles before and after grinding were determined by N2 adsorption using a volumetric adsorption measurement instrument (Bel Japan, Belsorp-18).
Concentrations of Ce3+ and Gd3+ ions, CCe3+ and CGd3+, in the precursor solution were measured by using an inductively coupled plasma (ICP) analyzer (Seiko Instruments Inc., SPS7800) to clarify the effects of the adsorption of metal ions onto carbon nanoparticles in the precursor solution. Carbon nanoparticles were suspended in a precursor solution for 24 h to adsorb metal ions. They were then removed from the precursor solution by using centrifugal sedimentation at 26,200 rpm for 3 h, to prepare a solution devoid of carbon nanoparticles. Concentrations of metal ions in this carbon-nanoparticle-free precursor solution were measured by using ICP elemental analysis.
RESULTS AND DISCUSSION
shows SEM images of particles synthesized from aqueous solutions of carbon nanoparticle suspensions with Cc = 0, 8, 16, and 24 g L−1, with TH = 1273 K. When Cc = 0 g L−1, the particles were dense spheres and did not have pores. When Cc = 8, 16, or 24 g L−1, the particles seem to be porous spheres. We measured BET analysis to make clear whether the morphology on particle surfaces in is due to actual pores or not. shows the specific surface areas Sw obtained from BET analysis of N2 adsorption isotherms for Gd0.1Ce0.9O1.95 particles synthesized at TH = 1073 K, Cc = 0, and 16 g L−1. The addition of carbon nanoparticles increased Sw from 6.31 to 15.1 m2 g−1, indicating that the morphology on particle surfaces is actual pores.
TABLE 1 Specific surface areas Sw obtained from N2 adsorption isotherms of Gd0.1Ce0.9O1.95 particles before and after 24-h grinding; particles were synthesized at TH = 1073 K, Cc = 0, and 16 g L−1
FIG. 3. SEM images of particles synthesized using CNA-USP method from aqueous solutions of Ce(NO3)3 6H2O and Gd(NO3)3 6H2O dissolved in stoichiometric ratios of Gd0.1Ce0.9O1.95 at Cc = (a) 0, (b) 8, (c) 16, and (d) 24 g L−1, at Ctotal = 0.02 mol L−1, TH = 1273 K, and tr = 9.4 s.
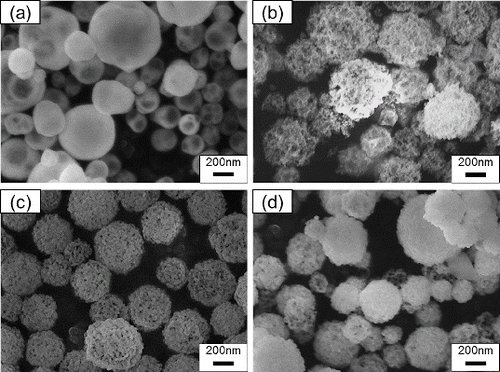
shows the geometric mean diameter Dpg and geometric standard deviation σg determined from the SEM images in . When Cc was increased from 0 to 16 g L−1, Dpg increased from 212 to 263 nm, respectively. This increase occurs because the combustion of carbon nanoparticles created pores in the submicron particles. In contrast, when Cc was increased further from 16 to 24 g L−1, Dpg decreased from 263 to 224 nm. The decrease in Dpg was caused by (1) the decrease in Cc in the droplets and (2) the decrease in Ctotal in the source solution. For the cause (1), a portion of the carbon nanoparticles coagulated and formed agglomerates by the ultrasonic vibration when the Cc was high. The agglomerates deposited on the bottom of the nebulizer by gravitational sedimentation, thus causing a decrease in Cc in the droplets. As the results, the diameter Dpg of porous submicron particles decreased because their pore spaces decreased. For the cause (2), it is considered that Ce3+ and Gd3+ ions in the precursor solution are adsorbed onto the surface of the carbon nanoparticles because used carbon nanoparticles (Aqua Black 162) have carboxyl groups on their surface and carboxyl groups bind metal ions. Concentrations of Ce3+ and Gd3+ ions, CCe3+ and CGd3+, in the precursor solution were measured by ICP elemental analysis to clarify the effects of the adsorptions onto the carbon nanoparticles. shows CCe3+ and CGd3+ in the precursor solution when carbon nanoparticles with Cc = 0–24 g L−1were added. Both CCe3+ and CGd3+ decreased with increasing Cc. At Cc = 24 g L−1, CCe3+ and CGd3+ decreased to about 60% of their initial values (i.e., for Cc = 0 g L−1). These results suggest that Ce3+ and Gd3+ ions were adsorbed on the surface of the carbon nanoparticles, probably due to the carboxyl groups on the surface of nanoparticles. In the CNA-USP method, the increase in particles size with increasing porosity and the decrease with decreasing Ctotal in the solution and Cc in mist droplets occur simultaneously. The former is dominant in the synthesis at Cc = 8 and 16 g L−1 and the latter is at Cc = 24 g L−1, resulting that Dpg decreases at Cc = 24 g L−1.
TABLE 2 Geometric mean diameter Dpg and geometric standard deviation σg obtained from SEM images for Gd0.1Ce0.9O1.95 particles shown in Figure 3; particles were synthesized at Cc = 0–24 g L−1 and TH = 1273 K
TABLE 3 Concentrations of Ce3+ and Gd3+, CCe3+ and CGd3+, and atomic ratios of Ce3+ : Gd3+ in precursor solutions to which carbon nanoparticles were added
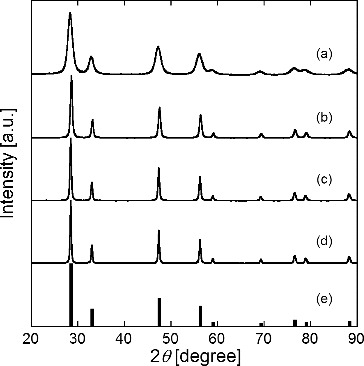
shows XRD patterns of particles synthesized at different TH = 873, 1073, 1173, and 1473 K compared to JCPDS data of Gd0.1Ce0.9O1.95 (JCPDS 75-0161). The total metal ion concentration Ctotal was 0.02 mol L−1, carbon nanoparticle concentration Cc was 16 g L−1, and reaction time tr was 9.4 s. The XRD patterns for TH = 1073K, 1173K, and 1473K agree with the JCPDS data of GDC and don't have any peaks except shown in it. Particles synthesized with the CNA-USP method were not affected by the carbon nanoparticles although the Ctotal in the solution decreased with increasing Cc as shown in . The molar ratios of Ce3+ and Gd3+ are shown in to make clear the cause. The ratios for Cc = 8–24 g L−1 were similar to the ratio for Cc = 0 g L−1 of 9:1, thus causing that XRD patterns were not affected by the carbon nanoparticles. The XRD pattern for particles synthesized using the CNA-USP method at TH = 873 K shows peaks at similar locations as for JCPDS data of GDC, although the peaks are broader, indicating that the particles synthesized at TH = 873 K were amorphous. shows that average crystallite size Dcry calculated from the most intense reflection peak by using Scherrer's formula. The crystallite size Dcry of GDC increased from = 31.8 to 48.3 nm with increasing TH from 1073 to 1473 K, indicating that particles synthesized at TH ≥ 1073 K were highly crystalline.
TABLE 4 Average crystallite size Dcry obtained from XRD patterns of Gd0.1Ce0.9O1.95 particles shown in Figure 4, geometric mean diameter Dpg and geometric standard deviation σg obtained from SEM images shown in Figure 5; particles were synthesized at TH = 873–1473 K and Cc = 16 g L−1
FIG. 4. XRD patterns of particles synthesized using CNA-USP method from aqueous solutions of Ce(NO3)3 6H2O and Gd(NO3)3 6H2O dissolved in stoichiometric ratios of Gd0.1Ce0.9O1.95 at TH = (a) 873 K, (b) 1073 K, (c) 1273 K, and (d) 1473 K compared to (e) JCPDS data for Gd0.1Ce0.9O1.95, at Ctotal = 0.02 mol L−1, Cc = 16 g L−1, and tr = 9.4 s.
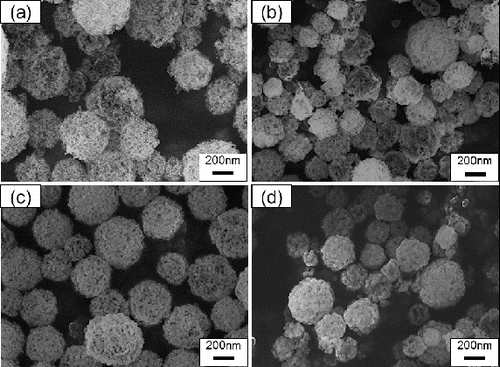
shows SEM images of GDC particles synthesized at different TH = 873, 1073, 1173, and 1473K, and at Ctotal = 0.02 mol L−1, Cc = 16 g L−1, and tr = 9.4 s. Synthesized particles were porous spheres a few hundred nanometers in diameter. SEM images indicate that for TH ≥ 873K, many pores were made on the surface of submicron particles. shows Dpg and σg determined from SEM images shown in , for which 210 < Dpg < 309 nm and 1.37 < σg < 1.54. indicates that Dpg decreased with increasing TH, due to the higher temperature sintering between primary particles in the porous submicron particles.
FIG. 5. SEM images of Gd0.1Ce0.9O1.95 particles synthesized using CNA-USP method at TH = (a) 873 K, (b) 1073 K, (c) 1273 K, and (d) 1473 K, at Ctotal = 0.02 mol L−1, Cc = 16 g L−1, and tr = 9.4 s.
The TG data were measured to examine whether carbon nanoparticles remains in porous particles shown in or not. shows the TG curves of (a) GDC particles used in and (b) carbon nanoparticles added in the precursor solutions. The sample particles were heated in the helium gas and the measuring temperatures TM was increased from 300 to 1400 K at the rate of 10 K min−1. The ordinates of figures are weight ratio normalized by the initial weight. The weight ratio of GDC particles synthesized at TH = 873 decreases gently from 89.2% to 84.4% at TM = 400–1200 K after the sharp reduction at TM = 300–400 K and decreases sharply at TM ≥ 1200 K. The weights for TH = 1073 and 1273 K decrease slightly from 100% to 99.5% and 99.6% to 98.5%, respectively, at TM = 400–1200 K and decrease sharply at TM ≥ 1200 K. The weight for TH = 1473 K decreases slightly from 96.3% to 95.6% at TM = 400–1200 K after the sharp reduction at TM = 300–400 K and decreases sharply at TM ≥ 1200 K. The sharp reductions for TH = 873 and 1473 K at TM = 300–400 K are due to the evaporation of moisture adsorbed on the particle surface. The TG curve of carbon nanoparticles was measured to make clear the cause of the weight losses at TM = 400–1200 K. The weight ratio decreases linearly at TM ≥ 400 K after the sharp reduction at TM = 300–400 K as shown in , indicating that this weight loss of carbon nanoparticles is the cause for weight losses of the porous GDC particles at TM = 400–1200 K. This means that the carbon remains in the porous GDC particles. We think that the cause of sharp reductions at TM ≥ 1200 K are the deoxidization of GDC by the reaction between the remaining carbon and oxygen in the GDC because the reduction ratios increase with weight losses at TM = 300–400 K.
FIG. 6. TG data of (a) Gd0.1Ce0.9O1.95 particles synthesized using CNA-USP method at TH = 873 K, 1073 K, 1273 K, and 1473 K, at Ctotal = 0.02 mol L−1, Cc = 16 g L−1, and tr = 9.4 s and (b) carbon nanoparticles added in the precursor solutions.
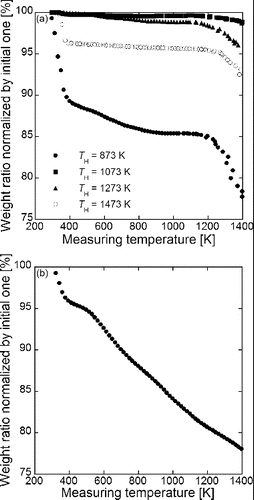
The amount ratios of remaining carbon to carbon added in the solutions can be evaluated from the weight losses at TM = 400–1200 K. The remaining carbon ratios calculated from the weight losses of 4.8, 0.5, 1.1, and 0.7% are 0.46, 0.03, 0.09, and 0.05% for TH = 873, 1073, 1273, and 1473 K, respectively. Effects of the remaining carbon on the electrochemical properties of the electrolyte film should be investigated although the remaining carbon in GDC nanoparticles can be removed by the high temperature annealing at around 1473 K in the electrolyte film formation process.
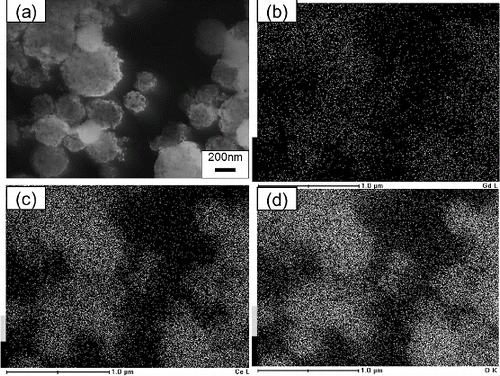
The performance of GDC as an electrolyte depends strongly on the local distribution of components in the GDC particle. The local distribution of Ce, Gd, and O in particles synthesized by using CNA-USP was observed by using EDX. shows (a) SEM images of GDC particles prepared at Cc = 16 g L−1 and EDX images of Gd, Ce, and O in these particles at Ctotal = 0.02 mol L−1, TH = 1073 K, and tr = 9.4 s. These EDX images show that Ce, Gd, and O were distributed uniformly in the particles.
FIG. 7. (a) SEM images of Gd0.1Ce0.9O1.95 particles synthesized using CNA-USP method at Cc = 16 g L−1 and EDX images of (b) Gd, (c) Ce, and (d) O contained in them, at Ctotal = 0.02 mol L−1, TH = 1073 K, and tr = 9.4 s.
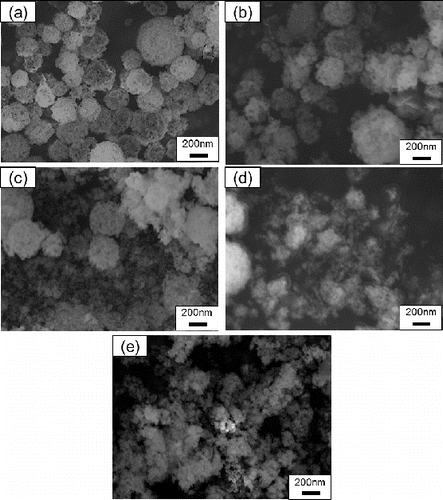
In our proposed process for formation of ultrathin electrolyte films, GDC nanoparticles were produced from porous submicron particles by liquid ball milling. Then, porous GDC submicron particles were suspended in pure water and the suspension was ground with the ball mill. shows SEM images of Gd0.1Ce0.9O1.95 particles before and after the ball milling for 30 min, 1 h, 5 h, and 24 h for particles synthesized at Cc = 16 g L−1, Ctotal = 0.02 mol L−1, TH = 1073K, and tr = 9.4 s. These SEM photographs showed that the only an insignificant quantify of porous submicron particles were ground after 30 min of ball milling, whereas a significant quantity were ground after 1 and 5 h, and most were ground after 24 h.
FIG. 8. SEM images of Gd0.1Ce0.9O1.95 particles (a) before and after (b) 0.5 h, (c) 1 h, (d) 5 h, and (e) 24 h of ball-mill grinding of particles synthesized using CNA-USP method at Cc = 16 g L−1, Ctotal = 0.02 mol L−1, TH = 1073 K, and tr = 9.4 s.
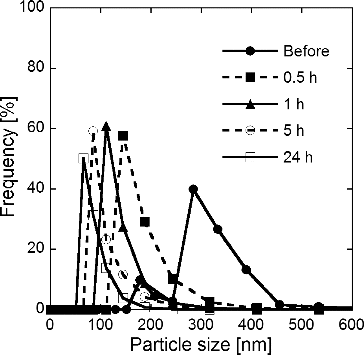
shows size distributions of GDC particles measured by DLS before and after ball milling. The size distribution of porous submicron particles before the ball milling showed two peaks, a minor peak at Dp = 180 nm and a major peak at Dp = 290 nm. The particle diameter of the major peak, Dp = 290 nm, is almost the same as that obtained from SEM photographs, Dpg = 271 nm (). After 30 min of ball milling, a single peak appeared at Dp = 140, although the original peaks at Dp = 180 and 290 nm disappeared. After 1 h and 5 and 24 h of ball milling, the single peak shifted to Dp = 110, 85, and 65 nm, respectively. The Dp = 65 nm after 24 h of ball milling is about double of the Dcry = 31.8 nm determined from XRD pattern (), which suggests that porous GDC submicron particles synthesized by the CNA-USP method were ground into near crystallite sizes after 24 h of ball milling.
FIG. 9. Size distributions of Gd0.1Ce0.9O1.95 particles measured by DLS before and after 0.5, 1, 5, and 24 h of ball-mill grinding of particles synthesized using CNA-USP method at Cc = 16 g L−1, Ctotal = 0.02 mol L−1, TH = 1073 K, and tr = 9.4 s.
The specific surface areas Sw obtained from BET analysis for the particles synthesized at TH = 1073 K and Cc = 16 g L−1 before and after 24-h milling are shown in . By ball milling, Sw slightly increased from 15.1 to 22.9 m2 g−1. The increase in Sw is due to grinding of submicron particles to nanometer-sized particles.
Above results suggest that GDC nanoparticles prepared by CNA-USP method are suitable materials for our proposed process in which ultrathin electrolyte film is formed on the anode substrate by spin or spray coating and sintering of electrolyte nanoparticle suspension if carbon or carbon dioxide generated from carbon nanoparticles don't affect the electrochemical properties of the electrolyte film. The characterization of electrochemical properties and the development of the film formation process are needed to use the GDC nanoparticles as the electrolyte film material.
CONCLUSIONS
For IT-SOFC, A new ultrasonic spray pyrolysis method called carbon nanoparticle-addition ultrasonic spray pyrolysis (CNA-USP) is proposed for synthesizing nanoparticles of electrolyte materials used in solid oxide fuel cells (SOFCs). A key step in CNA-USP is the addition of carbon nanoparticles to a precursor solution. The first step in CNA-USP is the synthesis of Gd0.1Ce0.9O1.95 (GDC) particles from an aqueous solution of Ce(NO3)3·6H2O and Gd(NO3)3·6H2O. In our study, GDC particles synthesized at a furnace temperature TH between 873 and 1473 K and at a carbon nanoparticle concentration Cc between 0 and 24 g L−1 were porous particles between 210 and 309 nm in diameter and between 12 and 48 nm in crystallite size. EDX images of the porous GDC particles showed that Ce, Gd, and O were distributed uniformly in particles. The second step is to grind the porous GDC particles by using a ball mill. In our study, GDC particles prepared at TH = 1073 K and Cc = 16 g L−1 were ground into nanoparticles by ball milling for about 24 h. The average diameter of the GDC nanoparticles after 24 h grinding was about 65 nm, about the double of the average crystallite size of 32 nm of porous submicron GDC particles.
ACKNOWLEDGMENTS
The authors appreciate Professor T. Nagaoka and Associate Professor H. Shiigi in the Department of Applied Chemistry at Osaka Prefecture University for the use of their TG analyzer and especially thank their student, Mr. M. Takai, for his efforts at measuring TG.
Additional information
Funding
REFERENCES
- Arastoo, A., Kinoshita, T., and Adachi, M. (2012). Nanoparticle Synthesis for the SOFC Electrolyte Materials by Carbon Nanoparticles-Addition Ultrasonic Spray Pyrolysis. Proceedings of the First China-Japan Aerosol Symposium, pp. 72–74 ( Sep. 27–30, Kanazawa, Japan).
- Beckel, D., Bieberle-Hutter, A., Harvey, A., Infortuna, A., Muecke, U. P., Prestat, M., Rupp, J. L., and Gauckler, L. J. (2007). Thin Films for Micro Solid Oxide Fuel Cells. J. Power Source, 173:325–345.
- Brandon, N. P., Blake, A., Corcoran, D., Cummimg, D., Duckett, A., El-Koury, K., Haigh, D., Kidd, C., Leah, D., Lewis, G., Matthews, C., Maynard, N., Oishi, N., McColm, T., Trezona, R., Selcuk, A., Schmidt, M. and Verdugo, L. (2004a). Development of Metal Supported Solid Oxide Fuel Cells for Operation at 500–600 C. J. Fuel Cell Sci. Technol., 1–1:61–65.
- Brandon, N. P., Corcoran, D., Cummins, D., Duckett, A., El-Khoury, K., Haigh, D., Leah, R., Lewis, G., Maynard, N., McColm, T., Trezona, R., Selcuk, A., and Schmidt, M. (2004b). Development of Metal Supported Solid Oxide Fuel Cells for Operation at 500–600 C. J. Mater. Eng. Perform. 13:253–256.
- Chen, C. Y., Tseng, T. K., Tsai, S. C., Lin, C. K., and Lin, H. M. (2008). Effect of Precursor Characteristics on Zirconia and Ceria Particle Morphology in Spray Pyrolysis. Ceram. Int., 34:409–416.
- Djurado, E. and Meunier, E. (1998). Synthesis of Doped and Undoped Nanopowders of Tetragonal Polycrystalline Zirconia (TPZ) by Spray-Pyrolysis. J. Solid State Chem., 141:191–198.
- Gaudon, M., Djurado, E., and Menzler, N. H. (2004). Morphology and Sintering Behavior of Yttria Stabilized Zirconia (8-YSZ) Powders Synthesized by Spray Pyrolysis. Ceram. Int., 30:2295–2303.
- Haile, S. M. (2003). Fuel Cell Materials and Components. Acta Material., 51:5981–6000.
- Kawano, M., Yoshida, H. and Inagaki, T. (2011). Synthesis of Anode Material for Solid Oxide Fuel Cell by Spray Pyrolysis and its Cell Performance. J. Soc., Powder Technol. Japan, 48:376–380.
- Kinoshita, T. and Adachi, M. (2014). Submicron Particle Synthesis of Gd0.1Ce0.9O1.95, NiO-Gd0.1Ce0.9O1.95 and La0.8Sr0.2CoO3 by Ultrasonic Spray Pyrolysis. J. Chem. Eng. Jpn, (accepted).
- Liu, Y., Hashimoto, S., Nishino, H., Takei, K., Mori, M., Suzuki, T., and Funahashi, Y. (2007). Fabrication and Characterization of Micro-Tubular Cathode-Supported SOFC for Intermediate Temperature Operation. J. Power Source, 174:95–102.
- Matsuda, K. and Taniguchi, I. (2004). Relationship Between the Electrochemical and Particle Properties of LiMn2O4 Prepared by Ultrasonic Spray Pyrolysis. J. Powder Sources, 132:156–160.
- Mesguich, D., Bassat, J. M., Aymonier, C. and Djurado, E. (2010). Nanopowder Synthesis of the SOFC Cathode Material Nd2NiO4+δ by Ultrasonic Spray Pyrolysis. Solid State Ionics, 181:1015–1023.
- Messing, G. L., Zhang, S. C., and Jayanthi, G. V. (1993). Ceramic Powder Synthesis by Spray Pyrolysis. J. Am. Ceram. Soc., 76:2707–2726.
- Okuyama, K. and Lenggoro, I. W. (2003). Preparation of Nanoparticles via Spray Route. Chem. Eng. Sci., 58:537–547.
- Okuyama, K., Shimada, M., Adachi, M. and Tohge, N. (1993). Preparation of Ultrafine Superconductive Bi-Ca-Sr-Cu- Particles by Metalorganic Chemical Vapor Deposition. J. Aerosol Sci., 24:357–366.
- Suda, S., Takahashi, S., Kawano, M., Yoshida, H., and Inagaki, T. (2006). Effects of Atomization Conditions on Morphology and SOFC Anode Performance of Spray Pyrolyzed NiO-Sm0.2Ce0.8O1.9 Composite Particles. Solid State Ionics, 177:1219–1225.
- Will, J., Mitterdorfer, A., Kleinlogel, C., Perednis, D., Gauckler, L.J. (2000). Fabrication of Thin Electrolytes for Second-Generation Solid Oxide Fuel Cells. Solid State Ionics, 131:79–91.

