
Abstract
Terrorist attacks using pathogenic bioaerosols pose a significant public-health threat. Modeling the risk associated with such attacks is valuable from the standpoint of disaster preparedness. To attain greater flexibility in bioterrorism risk modeling, we have developed an open-source lung deposition code based on the International Committee for Radiological Protection (ICRP) Publication 66 (ICRP 1994). This article describes modifications to ICRP's lung deposition model to fit the bioaerosol context and discusses the impact of exposure from a few monodisperse pathogenic toxins such as botulinum toxin, influenza virus, and Bacillus anthracis to infants and adults. As most existing commercial lung deposition codes are not open-source, this code provides users a platform template that can be modified to meet their needs.
1. INTRODUCTION
Risk modeling is an important aspect of the preparation for possible acts of bioterrorism (Haas Citation2002). Development of risk models is considerably complicated, as factors such as the size of the city population and its distribution, wind speed and direction, aerosol characteristics, temperature and humidity, population distribution within age groups, lung deposition pattern, and types of prophylaxes (e.g., vaccines, protective medical devices such as respirators) used are all factors that should be considered (Isukapalli et al. Citation2008). This article focuses on one critical aspect of risk assessment: deposition of bioaerosols in the lungs. In this regard, we define a bioaerosol as a single unit of an active pathogen in aerosolized form and distinguish it from an aerosol that may contain multiple bioaerosols inside it. As aerosol deposition, irrespective of material type, is intrinsically complex, it may be advantageous to leverage models previously developed to predict radiation exposure.
One of the most popular models was developed in 1994 by the International Committee of Radiological Protection (ICRP) for calculating radiation doses in humans (ICRP Citation1994). In 1997, the National Council on Radiation Protection and Measurements also came up with an alternate model (NCRP 1997). Both these models have the capability of calculating region-specific deposition of any aerosol particle in the lungs, along with amount of clearance through different regions of the lungs postdeposition. Although there are a number of differences between the two models (discussed elsewhere, Yeh et al. Citation1996), the major difference, especially in the context of lung deposition modeling, is that the ICRP model follows a holistic approach by dividing the lungs into three compartments: the extrathoracic region, the tracheobronchial region, and the alveolar region. The ICRP model then calculates the deposition by using empirical correlations for each of these compartments. On the other hand, the NCRP model is more meticulous and follows a stochastic approach by dividing the lungs down to several airway generations. Thus, the NCRP model includes considerably more detail of the lung geometry than the ICRP model. Besides the ICRP and NCRP models, there are other models such as trumpet models (Yu Citation1978), deterministic models such as multiple pathway particle dosimetry (MPPD) (Asgharian et al. Citation2001), stochastic models (Koblinger and Hofmann Citation1985), or models that implement computational fluid and particle dynamics (Zhang et al. Citation2008; Ma et al. Citation2009). A review of these models can be found elsewhere (Rostami Citation2009; Hofmann Citation2011; Hussain et al. Citation2011). Although the deterministic, stochastic models and fluid and particle dynamic simulations are particularly useful in capturing the finer details of the deposition mechanisms in the lungs, we kept our overall project goal of risk assessment in our minds while selecting our model. Because clinical data on patterns of deposition of specific biopathogens in the lungs is sparse, we felt that comprehensive lung models such as NCRP, MPPD, etc. that can provide lung-generation specific data would yield little benefit in overall risk assessment of a bioaerosol exposure to the general population. Rather, compartment-specific information as provided by ICRP model should suffice. Additionally, recent reviews of lung deposition models suggest that despite being simple, the ICRP model captures deposition in the lungs as well as other more complex models (Rostami Citation2009; Hofmann Citation2011).
In this article, we enhance the ICRP model for bioaerosols and implement the model equations in software that is free and easily modifiable by the user and we refer to it as bioaerosol adaptation of ICRP's lung-deposition model (BAIL). With regard to software implementation of the exposure models, a commercial software implementation of the ICRP model is available (referred to as the LUDEP code, from ACJ and Associates Citation2013). The additional features of BAIL are as follows:
While the ICRP and LUDEP require that the shape factor of nonspherical particles be input into the model, we include a modification that automatically calculates the shape-factor for nonspherical particles based on the diameter and length of aerosols (Section 2.2).
The ICRP and LUDEP assume log-normal distributions for particles. While this is applicable for chemical or radionuclide aerosols, purified bioaerosols have narrow distributions that can be modeled as normal, as discussed later in this article. Thus, we also include a modification that enables implementation of normal size distributions of purified monomers of bioaerosols (Section 2.3 and the online supplementary information [SI] Section S1).
The ICRP and LUDEP determine aerosol deposition in the lungs for certain discrete age groups (e.g., 3-month old, 5-year old, 10-year old, 15-year old, adults). By developing correlation of height with age, we convert this dependency into a continuous function, allowing lung deposition in all subjects as a function of height rather than age (Section 2.4).
Based on ICRP recommendations, our program captures intersubject variability by calculating 5th percentile, 50th percentile (average), and 95th percentile of the lung deposition for each specific height group (Section 2.5). LUDEP does not have the capability to handle this variability.
Besides these major additions, the SI Section S2 also discusses a minor change in calculation of deposition of aerosol when breathing through the mouth. The equations from the original ICRP lung-deposition model along with the modifications made by us were all programmed using MATLAB. While LUDEP has been used in the past for determining deposition in the lungs for various bioaerosols (Reponen et al Citation2001; Cho et al. Citation2005), this is the first known effort to modify the ICRP's lung deposition model for bioaerosols and make it available in an open-source format. Because of space restrictions, we do not provide any detailed discussion on the physiology of the lungs and the depositional equations in the ICRP model. Instead, we focus only on the sections we have modified.
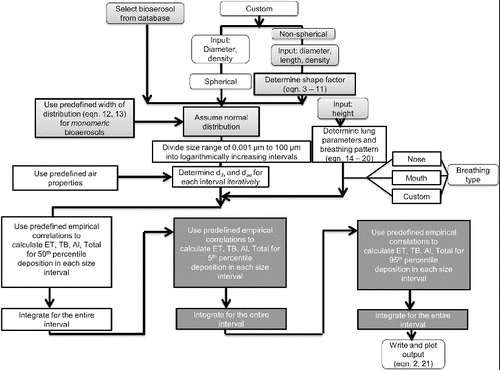
A schematic of our lung-deposition code is shown in . Readers of this article can either contact the authors to obtain the code or download and install it from the following link: http://www.mathworks.com/matlabcentral/fileexchange/47868-bail-fda-ver-beta-2014-m. Those interested in modifying BAIL are strongly encouraged to refer to Chapter 5 and Appendix D of ICRP Citation1994 before making changes to the code.
FIG. 1. Schematic of the BAIL. ET: Extrathoracic; TB: tracheobronchial; Al: alveolar region. The boxes in light gray indicate features not in the original ICRP model added into BAIL. The boxes in darker gray indicate features that are discussed in the ICRP model but not available in LUDEP and implemented in BAIL. Users can either choose a bioaerosol from a database in BAIL (discussed in Section 3) or can input customizable bioaerosol information. The online supplementary information provides brief instructions for operating BAIL.
2. ICRP's LUNG-DEPOSITION MODEL AND OUR MODIFICATIONS
2.1. Summary of the ICRP's Lung-Deposition Model
Briefly, the ICRP model is a semiempirical approach for determining the deposition of aerosols within the regions of the lungs. It is based on algebraic equations that have been derived by fitting experimental and theoretical results. In the ICRP, the lung is divided into the extrathoracic, bronchi, bronchiolar, and alveolar regions or compartments. The ICRP model divides the empirical correlations broadly into two subcategories: those governed by the aerodynamic diameter (for larger aerosols that are impaction- or interception-driven) and represented by the activity median aerodynamic diameter (AMAD), and those governed by thermodynamic diameter (for smaller aerosols driven by thermodynamic diffusion) and represented by the activity median thermodynamic diameter (AMTD). Considering each lung compartment as a filter, the filtration efficiency for each of these sections is represented empirically by (ICRP Citation1994):[1]
Here ηi is the filtration efficiency of the ith region, R is a function of the type of flow (laminar or turbulent), the residence time in each lung compartment (which is governed by the lung geometries), the scaling factors for different groups (e.g., adults or children) and either the aerodynamic or thermodynamic diameters. In Equation (1), a and p are constants. Further, it can be shown that the deposition in each section i (DEi) can then be determined using (ICRP Citation1994):[2]
Here, DEi is a dimensionless quantity representing the fraction of the total amount of aerosols entering the mouth and nose that are deposited in the ith compartment. The parameter ϵi is also a dimensionless parameter that takes into account the varying volumes in the respective sections of the lungs. The i – 1 subscript appears in this equation since the amount of deposition in the ith section will depend on the amount that has filtered through in the i –1th section.
Before setting out to enhance the ICRP model for bioaerosol applications, to ensure that we were implementing the existing ICRP model accurately, we replicated the ICRP model by developing in-house codes in MATLAB and then compared our results with ICRP predictions. The SI Section S3 discusses the details of how well our replication of ICRP model corroborated with ICRP predictions. Briefly, for a variety of breathing conditions, subjects, and size regimes, our predictions matched ICRP with a maximum deviation in total deposition being less than 6% for a variety of different sizes, breathing patterns, and age groups. After this validation test, we set to enhance the ICRP model through the modifications discussed next.
2.2. Determination of the Shape Factor
The deposition of aerosols in the lungs depends on particle size. For spherical particles, the description of size is straightforward, as the size is uniquely determined by the diameter of the particle. However, nonspherical particles may need more than one descriptor. For example, a rod is uniquely defined by its length and diameter, and an ellipse by its major and minor axes. Traditionally, for such nonspherical particles, the shape factor χ is used in conjunction with some form of diameter (either an equivalent volume diameter or aerodynamic diameter) to describe the particle and calculate the deposition in the lungs. For example, the ICRP recommends a shape factor of 1.5 for work-related aerosols, whereas in reality bioaerosols can have any value greater than 1 (Sturm and Hofmann Citation2009). Commercially available ICRP code such as LUDEP requires the user to calculate and input shape factors for nonspherical aerosols. We modify this shortcoming by including a segment in BAIL that automatically calculates the shape factor of nonspherical bioaerosols based on the length and diameter of the bioaerosol entered by the user ().
Determining analytical expressions for shape factors of nonspherical aerosols is fairly complicated. Because of the way air molecules interact with aerosols in general, analytical equations for the shape factor vary based on the geometry of the particles (example: prolate spheroids and rods) and based on the flow regimes (free molecular, transitional, and continuum). Shape factors of nonspherical particles in the transitional regime can be fairly well-predicted using expressions for shape factors used in the free molecular regime (Li et al. Citation2013). Thus, in this section, we provide analytical expressions for shape factors in two regimes: free molecular and continuum. As most rigid nonspherical bioaerosols can be assumed to be prolate spheroid or rod-shaped (examples: coccus, bacillus, Tobacco mosaic virus), thus under each flow regime we provide two sets of equations: one set for each shape.
Considering a prolate spheroid in continuum regime, if Lf and df are the characteristic length and diameters, then, the aspect ratio (β) is given by > 1. The perpendicular projection of this particle yields one shape while the parallel projection yields another. This leads to two shape factors,
in the perpendicular direction and
in the parallel (Kasper Citation1982; Su and Cheng Citation2005; Sturm and Hofmann Citation2009) in the continuum regime:
[3]
[4]
When >> 1, i.e., for nanorods in the continuum regime (Cheng Citation1991),
[5]
[6] where
.
In the free molecular regime, for prolate spheroids we can derive from Li et al. (Citation2012)[7]
[8]
where, , λ = 0.0712 μm (mean free path of air),
, and f = 0.868 (Li et al. Citation2014). For nanorods with
>> 1 in free molecular regime, it can be shown from Li et al. (Citation2012) that
[9]
[10]
where . The random shape factor (χ) is then given by (Kasper Citation1982; Su and Cheng Citation2005; Sturm and Hofmann Citation2009):
[11]
Depending on the dimensions that a user provides for a custom bioaerosol, either of the Equations (3)–(10) are used in conjunction with Equation (11) by BAIL to determine the random shape factor ().
2.3. Size Distribution and Width of Monodisperse Bioaerosols
It is common to represent the polydisperse aerosols occurring in chemical, radionuclide, workplace, or environmental exposures with a log-normal distribution (ICRP Citation1994). Monodisperse aerosols in theory are supposed to be all of same size, but in reality, have a finite width and are expressed with normal distribution functions given by (Hinds Citation1999):[12]
where de is the equivalent spherical mean diameter, σ is the normal standard deviation for a normal distribution (expressed in same units as the diameter) and di varies over the size range of interest. Monomeric bioaerosols can be better represented by such normal, monodisperse distributions rather than polydisperse lognormal distributions. To determine the pdf for a monomer of a bioaerosol having the equivalent spherical mean diameter de with an unknown σ, we assimilated several examples of size distributions of bioaerosol monomers from literature. Details are provided in the SI Section S4. We defined where,
[13]
Here, de is expressed in μm where a = 0.02, b = 0.045, c = 100, and f = 1.2. Thus, Equations (12) and (13) can be combined to predict the size distribution function of bioaerosols indicated in for which the width of the distribution may be unknown.
2.4. Correlation Between Height and Lung Parameters
In order to determine the deposition of aerosols in the lungs in different age groups, different lung function parameters need to be expressed as a continuous function of at least one variable such as age, height, weight, etc. From the literature, it is evident that different research groups have used different variables for this purpose. For example, ICRP (Citation1994), used both height and age to describe the variation of functional residual capacity or total lung capacity. On the other hand, Altes et al. (Citation2006), expressed growth of different lung parameters solely as a function of age. Phalen et al. (Citation1985), based on a comprehensive study conducted by Mortensen et al. (Citation1983), chose to express lung parameters as a function of height. In the absence of any comprehensive review article addressing which of the three variables—height, weight, and age is most appropriate for defining different lung parameters, we choose to express lung parameters as a function of standing height since this approach continues to be used to this day (Rosenthal et al. Citation1993; Ip et al. Citation2000; Neve et al. Citation2002; Farkas et al. Citation2006; Strum Citation2012). Thus, staying consistent with this approach, we correlate all breathing parameters and lung volumes with subject height. Height is thus a required input parameter for BAIL ().
We correlate the breathing parameters, compartmental lung volumes, and the different generations of the trachea from Table 15 (page 50) of ICRP (Citation1994) with height (expressed in cm). We find that the extrathoracic (ET), bronchi (BB), and bronchiolar (bb) volumes, and the functional residual capacity, are well-represented by exponential functions of height (a). The growth of the 0th, 9th, and 16th airway generations are represented by linear functions of height (b). The regression coefficients for all the previous parameters were found to exceed 0.98. Similarly, the functional residual capacity FRC(h) was found to increase exponentially with height:[14]
FIG. 2. (a) The variation of the extrathoracic volume (VD(ET)), bronchi volume (VD(BB)), and bronchiolar volume (VD(bb)) as a function of height. The fits were with R2 = 0.9875 (dashed lines),
with R2 = 0.9939 (dashed dotted), and
with R2 = 0.9948 (dotted). (B) The variation of the 0th (d0), 9th (d9), and 16th (d16) airway generations as a function of age. The fits were
with R2 = 1 (dashed lines),
with R2 = 0.9995 (dashed dotted), and
with R2 = 0.9907 (dotted).
The flow rate Q(h) through the lungs and the tidal volume V(h) not only depend on height but also on the activity. Using prefixes sleeping, sitting, and light-exercise, we find Q(h) to increase linearly with height and V(h) to increase exponentially with height:[15]
[16]
[17]
[18]
[19]
[20]
Because the Q(h) and V(h) data are sparse as a function of height for heavy activity, we have not correlated these parameters with height.
The dimensions of the airway generations (b) are used for determining the scaling factors SFT (scaling factor for trachea), SFB (scaling factor for bronchiolar region), and SFA (scaling factor for alveoli) which are defined by the ratio of the 0th, 9th, and 16th generation airways of the reference Caucasian adult male (Table 15, p. 50 of ICRP [Citation1994]) divided by the dimensions of the 0th, 9th, and 16th generation airways of the subject concerned. All the parameters discussed in this subsection impact R and ϵi in Equations (1) and (2), respectively.
2.5. Intersubject Variability
There is a large amount of variation in the deposition pattern of aerosols in different subjects (ICRP Citation1994; Asgharian et al. Citation2001). To capture this variability, ICRP recommends use of upper and lower 95% confidence bounds for predicting the deposition in various compartments of the lungs in an individual subject. Consistent with the ICRP model, we calculate the 5th percentile, 50th percentile (i.e., average), and the 95th percentile by either multiplying or dividing a in Equation (1) by different constants provided in Table 14, p. 49, Chapter 5 of ICRP (Citation1994) specific to different size regimes and compartments of the lungs.
3. APPLICATIONS
We now consider some specific examples to compare the lung deposition for different bioaerosols in different age groups. Three different bioaerosols: a protein, a virus, and a bacterium are considered. Botulinum toxin (BTX) is a tier-1 pathogenic protein (CDC and APHIS Citation2013) for which the most common pathway of infection is through ingestion (Arnon et al. Citation2001). Nevertheless, this toxin is interesting in the context of bioaerosols as it lies in the lower end of size regime and thus the pattern of deposition represents that of any small toxin. In absence of any existing information on the size of BTX, we use molecular weight-size correlations to derive the size. Molecular weight (Mw) can be easily determined for most proteins. It has been shown, using electrospray-differential mobility analysis that for a large number of proteins the molecular weight and the mobility diameter are correlated (Bacher et al. Citation2001). Using this correlation for BTX with a molecular weight of ∼150 kDa and assuming the mobility diameter equals the equivalent spherical diameter (i.e., shape factor = 1), the equivalent spherical diameter is determined to be ∼9 nm. Further, most proteins within a wide molecular weight range have a density that ranges between 1.2 and 1.4 gm/cc (Fischer et al. Citation2004). We assume BTX to have a density of 1.3 gm/cc.
Influenza virus is chosen as an example virus as it is ubiquitous. For influenza virus, we assume an equivalent spherical diameter of 90 nm (Booy et al. Citation1985) and shape factor of 1.0. In the absence of any specific density value for influenza virus, and knowing that its primary ingredients are water and proteins, we assume its density to be 1.2 gm/cc.
Lastly, we consider anthrax causing bacteria B. anthracis, a tier-1 pathogenic agent of particular interest because it has been used as a bioterrorist weapon in the United States in the past (Jernigan et al. Citation2001). Transmission electron microscopy reveals it to have prolate spheroid-shaped structure with mean diameter of 0.8 μm and mean length around 1.5 μm (Carrera et al. Citation2007). Using Equations (3), (4), and (11), we find the shape factor to be ∼1.04, i.e., it behaves as a nearly spherical particle. We assume its density to be 1.1 gm/cc, consistent with other bacteria (Bratbak and Dundas Citation1984). The dimensions, densities, and shape factors discussed here are included in the bioaerosol database associated with BAIL. The results obtained for one case study (60-cm tall infant's inhalation of B. anthracis) are provided in Figure S4 (SI Section S4).
In order to understand the relative effect of the aforementioned bioaerosols in different subjects, we consider a 176-cm tall average adult, (a) and a 60-cm tall 3-month-old infant (b), both nose breathers. We hypothesize a bioterrorist attack at night, when both subjects are sleeping. Deposition calculations for a specified bioaerosol and subject typically took less than 10 s using a 4 GB RAM and 2.5 GHz processor. The error bars in a and b correspond to 5th percentile and 95th percentile depositions. For adults, we find that the average amount of deposition decreases with increasing bioaerosol size (BTX < Influenza virus < B. anthracis), with the 95th percentile deposition being around 90% for BTX and 95th percentile deposition around 40% for B. anthracis. For infants, however, this trend is slightly different. The maximum deposition occurs with the smallest bioaerosols (∼90%), but then the next highest deposition is of B. anthracis (∼70%) because of higher deposition in the extrathoracic region. Thus, from a and b, the effects of the three toxins can be summarized as BTX > Influenza virus > B. anthracis for adults and BTX > B. anthracis > Influenza virus, for infants. It should be pointed out that if instead of using BAIL, LUDEP was used with properties (density, shape factor, and geometric standard deviation) appropriate for workplace aerosols, then, deposition of the larger bioaerosols such as B. anthracis would be significantly overpredicted for both the 60-cm and the 176-cm subjects. Because of space constraints, this is discussed in greater detail in the SI Section S5.
FIG. 3. (a) Deposition of three bioaerosols in different lung compartments in a sleeping 176-cm adult nose breather. (b) Deposition of three bioaerosols in different lung compartments in a sleeping 60-cm infant nose breather. (ET: Extrathoracic = ET1 + ET2, TB: tracheobronchiole = BB + bb, Al: Alveolar, and TD: total deposition = ET1 + ET2 + BB + bb + Al). The error bars represent 5th and 95th percentile. (c) The maximum dose received by the pediatric population normalized by the maximum dose received by the adult population. (d) The maximum dose per unit surface area of the lungs received by infant population normalized by the maximum dose per unit surface area received by the adult population. The dotted line in this figure represents the scenario in which an infant dose/unit area is the same as an adult dose/unit area.
Dose is calculated by taking into account both volumetric flow rate and bioaerosol density. Expressing dose in grams per bioaerosol we can write:[21]
Here, j denotes the size intervals with the limits of the integration being from 0.001 μm to 100 μm and i denote the different compartments of the lungs as discussed in Equation (2). The total dose is obtained by multiplying this quantity with the total concentration to which a subject is exposed for a certain duration.
The BAIL code calculates up to Equation (21). However, in this article, in order to further quantify the relative bioaerosol deposition in a child (60-cm infant) compared to an adult (176 cm), we normalize the deposition in an infant with that in an adult to get the relative dose (RD) at section i:[22]
For simplicity, we plot only the upper bounds of the dose in c. Given the significantly lower breathing flow rates in infants, the normalized dose ET, TB, Al, and TD are lower for all bioaerosols. However, infants and children have significantly smaller lung and lung area compared to adults (ICRP Citation1994; Ginsberg et al. Citation2005, Citation2008, Citation2010). Thus to compare the lung loading among infants and adults, the numerator and denominator of Equation (22) are divided with the respective lung surface areas (Ai) to get the normalized relative dose per unit area (NRDA) at section i:
[23]
The surface areas of the extrathoracic, tracheobronchial, and alveolar regions for 176 cm adults are 160, 2363, and 777417 cm2, respectively, while for 60-cm infants they are 40, 1570, 37704 cm2, respectively (Ginsberg et al. Citation2005, Citation2010). Again, as in c, the upper bounds of NRDAi are plotted for three different bioaerosols in d.
From our results in d, it is evident that the extrathoracic (ET) and alveolar dose per unit area (Al) are higher in infants than adults in case of B. anthracis. For children, because of their lower breathing rates, the dose to the extrathoracic regions (c) is low (except for B. anthracis). A fourfold reduced surface area increases the risk for infants compared to adults only slightly, unless it is a larger pathogen such as B. anthracis. The reason that the ET dose/unit area for B. anthracis is almost three times as high in infants (d) is because the dose of anthrax in infants is comparable to adults to start with (c), and the relative ET areas in infants is four times smaller than in adults (d). With the smaller doses in infants (c), the TB dose/unit area for infants remains low compared to adults (d). In the alveolar region, the dose for infants is small (c) but as the surface area in adults is significantly higher, the Al dose/unit area is higher (d) in infants. Following the same rationale, for B. Anthracis, the total dose (TD) in infants is almost half of adults (c), but as the total surface area of adults is significantly higher than infants the normalized dose/unit area for infants is significantly higher (d). It is evident from d that infants, for all pathogens studied here, appear to be at a greater risk compared to adults. These findings for infants are consistent with prior studies done with polydisperse radionuclides using the ICRP model (Ginsberg et al. Citation2005) and reactive gases using the NCRP model (Ginsberg et al. Citation2008). Interestingly, our studies are also consistent with Cho et al. (Citation2005) who found significantly more deposition of different species of fungi in the lower airways of infants compared to adults.
These results, however, need to be interpreted with caution as several biological factors add more complexity. For example, although d demonstrates higher relative ET dose/unit area of B. anthracis in infants, qualitatively one can argue that the majority of the deposition in this region can be easily cleared through mucociliary clearance and thus only the increased alveolar deposition in infants compared to adults is harmful (Schlesinger Citation1985; Radyuk et al. Citation2003). Age itself also complicates matters as the response of biopathogens can vary with age; for some pathogens, elderly people are more susceptible (Simonsen et al. Citation1998; Toth et al. Citation2013) while for others, infants or children are more susceptible because of their weaker immunity (Watanabe et al. Citation2010).
Nevertheless, the results in d constitute an important component in a more comprehensive risk assessment model that would account for additional factors such as risk of infection and the role of personal protective equipment. Qualitatively based on d, we can argue that given the increased dose per unit area for infants compared to adults, barriers such as face masks that are more effective than adult respirators might help ameliorate the increased risks, although it remains to be seen as to how such face masks can be designed while keeping pediatric comfort in mind.
Unfortunately, because of the high morbidity and mortality associated with some of the pathogens chosen in this article, it is not possible to directly validate our numerical predictions. However, given that deposition fractions are independent of type of bioaerosol (ICRP Citation1994), and that our implementation of ICRP model is accurate (in the SI Section S3), we have confidence that our predictions are plausible. However, there are other elements of BAIL that need to be improved:
BAIL depends on lung volumes and dimensions that were derived by ICRP committee members in the 1970s and 1980s. With the increase in anatomical information on the evolution of the lungs with age and the availability of additional morphological information (Perzl et al. Citation1996; Howatson Tawhai et al. Citation2000), it might be worthwhile to update and consolidate the ICRP information on lung geometries. It remains to be seen how this information will impact our results.
The history of bioterrorism or accidental release of bioaerosols has shown that polydisperse or purified monodisperse distributions constituting mainly monomers are possible (Inglesby et al. Citation1999; Cole Citation2003; Wilkening Citation2006). Compared to monodisperse and or monomeric distributions which we address in this article, polydisperse and multimodal bioaerosol distributions are more complex because of the quantized nature of aerosols as the bioaerosol load per aerosol can vary depending on method of dispersal (Duncan et al. Citation2009; Yang et al. Citation2011; Zuo et al. Citation2013).
The ICRP model treats clearance of radionuclide aerosols from the respiratory system and redistribution in different organs (ICRP Citation1994). Such a treatment for bioaerosols might have some similarities and other dissimilarities. For example, the ICRP model assumes that clearance is independent of size; while this may be valid for bioaerosol deposition in the respiratory tract, the subsequent germination of biopathogens adds complexity (Gutting et al. Citation2008). Also, while radionuclides would be harmful even after dispersal to other organs such as lymph nodes, digestive tracts, etc., the pathogenesis of bioaerosols is more complicated, may vary from toxin to toxin, and may produce different response from the immune system (especially if the subject has been vaccinated or has been infected before) (Tellier Citation2006; Gutting et al. Citation2008). Thus, for bioaerosols, it might be more convenient to treat clearance on a case by case basis. Such a treatment is beyond the scope of this article.
BAIL does not consider hygroscopic bioaerosols at this point. While some polydisperse bioaerosols appear to grow in humid environments (Lee et al. Citation2002) others do not (Reponen et al. 1996). Further, some bioaerosols have been found to grow in size with time (Westphal et al. Citation2002) as well. Because the survivability of bioaerosols (particularly influenza virus, Pyankov et al. Citation2012) can be a function of humidity and time, it adds another layer of complexity.
4. CONCLUSIONS
In summary, we have adapted ICRP's popular lung deposition model for bioaerosols. Changes include the expression of size distributions using narrow normal distributions and addition of a module that can determine shape factor of nonspherical aerosols. Dependence of lung parameters upon age correlates well with dependence upon height, enabling users to calculate lung deposition for different age groups. In addition, our code also provides 5th percentile, 50th percentile/average, and 95th percentile deposition for a human subject of a certain height for any bioaerosol of interest. After performing certain validation tests, we compared the deposition of some highly pathogenic bioaerosols among adults and infants and found that the deposition per unit surface area of the respiratory system can be much higher for infants than adults. The ability to make these types of calculations can be valuable in evaluating infection risk for different populations. Our open source code can also meet additional application needs such as deposition of nonspherical engineered nanoparticles (e.g., gold-nanorods and carbon nanotubes) in lungs, which is gaining recent interest.
SUPPLEMENTAL MATERIAL
Supplemental data for this article can be accessed on the publisher's website.
Supplemental_Information.zip
Download Zip (2.6 MB)ACKNOWLEDGMENTS
Dr. Suvajyoti Guha is a research participant at the US Food and Drug Administration via Oak Ridge Associated Universities. The authors would like to thank Dr. Alan Birchall for clarifying certain aspects of LUDEP, Dr. Michael Bailey for sharing his thoughts on clearance of biopathogens through respiratory tract, Professor Donald Milton for helpful discussions on pathogenesis, and Ms. Jing Yan for conducting literature searches on biopathogens. Views and opinions expressed in this article are solely the authors’ and should not be construed as the official position of the Food and Drug Administration or the Department of Health and Human Services. The authors declare no conflict of interest.
FUNDING
The authors would like to thank the Medical Countermeasures Initiative team for funding this project (MCM2DXXXXX20511, MCM2JXXXXX270HT).
Related Research Data
REFERENCES
- ACJ and Associates. (2013). IMBA. Available at: http://homepage.ntlworld.com/alan.birchall/IMBA/index.htm.
- Altes, T. A., Mata, J., de Lange, E. E., Brookeman, J. R., and Mugler, J. P. (2006). Assessment of Lung Development Using Hyperpolarized Helium-3 Diffusion MR Imaging. J. Magn. Reson. Imag., 24:1277–1283.
- Arnon, S. S., Schechter, R., Inglesby, T. V., Henderson, D. A., Bartlett, J. G., et al. (2001). Botulinum Toxin as a Biological Weapon: Medical and Public Health Management. JAMA, 285:1059–1070.
- Asgharian, B., Hofmann, W., and Bergmann, R. (2001). Particle Deposition in a Multiple-Path Model of the Human Lung. Aerosol Sci. Technol., 34:332–339.
- Bacher, G., Szymanski, W. W., Kaufman, S. L., Zollner, P., Blaas, D., et al. (2001). Charge-Reduced Nano Electrospray Ionization Combined with Differential Mobility Analysis of Peptides, Proteins, Glycoproteins, Noncovalent Protein Complexes and Viruses. J. Mass Spectrom., 36:1038–1052.
- Booy, F. P., Ruigrok, R. W. H., and van Bruggen, E. F. J. (1985). Electron Microscopy of Influenza Virus: A Comparison of Negatively Stained and Ice-Embedded Particles. J. Mol. Biol., 184:667–676.
- Bratbak, G., and Dundas, I. (1984). Bacterial Dry Matter Content and Biomass Estimations. Appl. Environ. Microbiol., 48(4):755–757.
- Carrera, M., Zandomeni, R. O., Fitzgibbon, J, and Sagripanti, J. L. (2007). Difference Between the Spore Sizes of Bacillus Anthracis and Other Bacillus Species. J. Appl. Microbiol., 102:303–312.
- CDC and APHIS. (2013). National Select Agent Registry. Available at: www.selectagents.gov/Select%20Agents%20and%20Toxins%20List.html. accessed 12-17-2013.
- Cheng, Y. S. (1991). Drag Forces on Nonspherical Aerosol Particles. Chem. Eng. Commun., 108:201–223.
- Cho, S.-H., Ceo, S.-H., Schemechel, D., Grinshpun, S. A., and Reponen, T. (2005). Aerodynamic Characteristics and Respiratory Deposition of Fungal Fragments. Atmos. Environ., 39:5454–5465
- Cole, L. (2003). The Anthrax Letters: A Medical Detective Story. Joseph Henry Press, Washington, DC, 267 p.
- de la Mora, J. F., de Juan, L., Eichler, T., and Rosell, J. (1998). Differential Mobility Analysis of Molecular Ions and Nanometer Particles. Trends Anal. Chem., 17(6):328–339.
- Duncan, E. J., Kournikakis, B., Ho, J., and Hill, I. (2009). Pulmonary Deposition of Aerosolized Bacillus Atrophaeus in a Swine Model Due to Exposure from a Simulated Anthrax Letter Incident. Inhal. Toxicol., 21:141–152.
- Farkas, A., Balashazy, I., and Szocs, K., (2006). Characterization of Regional and Local Deposition of Inhaled Aerosol Drugs in the Respiratory System by Computational Fluid and Particle Dynamic Methods. J. Aerosol. Med., 19(3):329–343.
- Fischer, H., Polikarpov, I., and Craievich, A. F. (2004). Average Protein Density Is a Molecular-Weight-Dependent Function. Protein. Sci., 13:2825–2828.
- Ginsberg, G., Foos, B., Dzubow, R. B., and Firestone, M. (2010). Options for Incorporating Children's Inhaled Dose Into Human Health Risk Assessment. Inhal. Toxicol., 22:627–647.
- Ginsberg, G. L., Asgharian, B., Kimbell, J. S., Ultman, J. S., and Jarabek, A. M. (2008). Modeling Approaches for Estimating the Dosimetry of Inhaled Toxicants in Children. J. Toxicol. Environ. Health. A., 71:166–195.
- Ginsberg, G. L., Foos, B. P., and Firestone, M. P. (2005). Review and Analysis of Inhalation Dosimetry Methods for Application to Children's Risk Assessment. J. Toxicol. Environ. Health A, 68:573–615.
- Gutting, B., Channel, S. R., Berger, A. E., Gearhert, J. M., Andrews, G. A., et al. (2008). Mathematically Modeling Inhalation Anthrax. Microbe, 3(2):78–85.
- Haas, C. N. (2002). The Role of Risk Analysis in Understanding Bioterrorism. Risk Anal., 22(4):671–677.
- Hinds, W. C. (1999). Aerosol Technology: Properties, Behavior, and Measurements of Airborne Particles. John Wiley & Sons Inc., New York.
- Hogan, C. J., Jr., Kettleson, E. M., Lee, M. H., Ramaswami, B, Angenent, L. T., et al. (2005). Sampling Methodologies and Dosage Assessment Techniques for Submicrometre and Ultrafine Virus Aerosol Particles. J. Appl. Microbiol., 99:1422–1434.
- Hofmann, W. (2011). Modeling Inahled Particle Deposition in the Human Lung—A Review. J. Aerosol. Sci., 42:693–724.
- Howatson Tawhai, M., Pullan, A. J., and Hunter, P. J. (2000). Generation of an Anatomically Based Three-Dimensional Model of the Conducting Airways. Ann. Biomed. Eng., 28:793–802.
- Hussain, M., Madl, P., and Khan, A. (2011). Lung Deposition Predictions of Airborne Particles and the Emergence of Contemporary Diseases Part-I. The Health, 2(2):51–59.
- ICRP. (1994). Annals of the ICRP. Publication 66.
- Ip, M. S. M., Karlberg, E. M., Karlberg, J. P. E., Luk, K. D. K., and Leong, J. C. Y. (2000). Lung Function Reference Values in Chinese Children and Adolescents in Hong Kong. Am. J. Respir. Crit. Care Med., 162:424–429.
- Inglesby, T. V., Henderson, D. A., Bartlett, J. G., Ascher, M. S., Eitzen, E., et al. (1999). Anthrax as a Biological Weapon. J. Am. Med. Assoc., 281(18):1735–1745.
- International Commission on Radiological Protection. (1994). Annals of the ICRP: Human Respiratory Tract Model for Radiological Protection. Elsevier Sc. Ltd., Oxford, pp. 36–54.
- Isukapalli, S. S., Lioy, P. J., and Georgopoulos, P. G. (2008). Mechanistic Modeling of Emergency Events: Assessing the Impact of Hypothetical Releases of Anthrax. Risk Anal., 28(3):723–740.
- Jernigan, J. A., Stephens, D. S., Ashford, D. A., Omenaca, C., Topiel M. S., et al. (2001). Bioterrorism-Related Inhalational Anthrax: The First 10 Cases Reported in the United States. Emerg. Infect Dis., 7:933–944.
- Kasper, G. (1982). Dynamics and Measurement of Smokes. I Size Characterization of Nonspherical Particles. Aerosol Sci. Technol., 1:187–199.
- Koblinger, L., and Hofmann, W. (1985). Analysis of Human Lung Morphometric Data for Stochastic Aerosol Deposition Calculations. Phys. Med. Biol., 30:541–556.
- Lee, B. K., Kim, S. H., and Kim, S. S. (2002). Hygroscopic Growth of E. coli and B. Subtilis Bioaerosols. Aerosol Sci., 33:1721–1723.
- Li, M., You, R., Mulhollan, G. W., and Zachariah, M. R., (2013). Evaluating the Mobility of Nanorods in Electric Fields. Aerosol Sci. Technol., 47(3):1101–1107.
- Li, M., Mulhollan, G. W., and Zachariah, M. R., (2012). The Effect of Orientation on the Mobility and Dynamic Shape Factor of Charged Axially Symmetric Particles in an Electric Field. Aerosol. Sci. Technol., 46(9):1035–1044.
- Li, M., Mulhollan, G. W., and Zachariah, M. R., (2014). Understanding the Mobility of Nonspherical Particles in the Free Molecular Regime. Phy. Rev. E, 89(2):022112-01–022112-13.
- Ma, B, Ruwet, V, Corieri, P, Theunissen, R, Riethmuller, M, et al. (2009). CFD Simulation and Experimental Validation of Fluid Flow and Particle Transport in a Model of Alveolated Airways. J. Aerosol. Sci., 40:403–141.
- Mortensen, J. D., Schaap, R. N., Bagley, B., Stout, L., Young, J. D., et al. (1983). A Study of Age Specific Human Respiratory Morphometry. UBTL Division, University of Utah Research Institute, Lake City, Utah, USA.
- National Council on Radiation Protection and Measurements. (1997). NCRP Report No. 125: Deposition, retention and dosimetry of inhaled radioactive substances. NCRP, pp. 50–70.
- Neve, V., Girard, F., Flahault, A., and Boule, M. (2002). Lung and Thorax Development During Adolescence: Relationship with Pubertal Status. Eur. Respir. J., 20:1292–1298.
- NRC. (2008). A Framework for Assessing the Health Hazard Posed by Bioaerosols. Academic Press, New York.
- Perzl, M. A., Schultz, H., Paretzke, H. G., Englmeier, K. H., and Heyder, J. (1996). Reconstruction of the Lung Geometry for the Simulation of Aerosol Transport. J. Aerosol. Med., 9:409–418.
- Phalen, R. F., Oldham, M. J., Beaucage, C. B., Crocker, T. T, and Mortensen, J. D. (1985). Postnatal Enlargement of Human Tracheobronchial Airways and Implications for Particle Deposition. Anat. Rec., 212:368–380.
- Pyankov, O. V., Pyankova, O. G., and Agranovski, I. E. (2012). Inactivation of Airborne Influenza Virus in the Ambient Air. J. Aerosol Sci., 53:21–28.
- Radyuk, S. N., Mericko, P. A., Popova, T. G., Grene, E, and Alibek, K. (2003). In Vitro-Generated Respiratory Mucosa: A New Tool to Study Inhalational Anthrax. Biochem. Biophys. Res. Commun., 305:624–632.
- Reponen, T, Grinshpun, S. A., Conwell, K. L., Wiest, J., and Anderson, M. (2001). Aerodynamic Versus Physical Size of Spores: Measurement and Implication for Respirator Depostion. 40(3):119–125.
- Reponen, T., Willeke, K., Ulevicius, V., Reponen, A., and Grinshpun, S. A. (1996). Effect of Relative Humidity on the Aerodynamic Diameter and Respirator Deposition of Fungal Spores. Atmospheric Environment, 30(23):3967–3974.
- Rosenthal, M., Bain, S. H., Cramer, D., Helps, P., Denison, D., et al. (1993). Lung Function in White Children Aged 4 to 19 Years: I—Spirometry. Thorax, 48:794–802.
- Rostami, A. A. (2009). Computational Modeling of Aerosol Deposition in Respiratory Tract: A Rreview. Inhal. Toxicol., 21:262–290.
- Schlesinger, R. B. (1985). Clearance from the Respiratory Tract. Fundam. Appl. Toxicol., 5:435–450.
- Simonsen, L., Clarke, M. J., Schonberger, L. B., Arden, N. H., Cox, N. J., et al. (1998). Pandemic Versus Epidemic Influenza Mortality: A Pattern of Changing Age Distribution. J. Infect. Dis., 178:53–60.
- Sturm, R, and Hofmann, W. (2009). A Theoretical Approach to the Deposition and Clearance of Fibers With Variable Size in the Human Respiratory Tract. J. Hazard. Mater., 170:210–218.
- Strum, R. (2012). Theroretical Models of Carcinogenic Particle Deposition and Clearance in Children's Lungs. J. Thoracic. Dis., 4(4):368–376.
- Su, W.-C., and Cheng, Y. S. (2005). Deposition of Fiber in the Human Nasal Airway. Aerosol Sci. Technol., 39(9):888–901.
- Tellier, R. (2006). Review of Aerosol Transmission of Influenza A Virus. Emerg. Infect. Dis., 12(11), 1657–1662.
- Toth, D. J., Gundlapalli, A. V., Schell, W. A., Bulmahn, K, Walton, T. E., et al., (2013). Quantitative Models of the Dose-Response and Time Course of Inhalational Anthrax in Humans. PLoS Pathogens, 8:e1003555.
- Watanabe, T., Bartrand, T. A., Weir, W. H., Omura, T., and Haas, C. N. (2010). Development of a Dose-Response Model for SARS Coronavirus. Risk Anal., 30(7):1129–1138.
- Weis, C. P, Intrepido, A. J., Miller, A. K., Cowin, P. G., Durno, M. A., Gebhardt, J. S., and Bull, R. (2002). Secondary Aerosolization of Viable Bacillus Anthracis Spores in a Contaminated US Senate Office. J. Am. Med. Assoc., 288(22):2853–2858.
- Westphal, A. J., Price, P. B., Leighton, T. J., and Wheeler, K. E. (2002). Kinetics of Size Changes of Individual Bacillus Thuringiensis Spores in Response to Changes in Relative Humidity. Proc. Natl. Acad. Sci., 100:3461–3466.
- Wilkening D. A. (2006). Sverdlovsk Revisited: Modeling Human Inhalation Anthrax. Proc. Natl. Acad. Sci., 103:7589–7594.
- Yang, W., Elankumaran, S., and Marr, L. C. (2011). Concentrations and Size Distributions of Airborne Influenza A Viruses Measured Indoors at a Health Centre, a Day-Care Centre and on Aeroplanes. J. R. Soc. Inter., 8:1176–1184.
- Yeh, H-C, Cuddihy, R. G., Phalen, R. F., and Chang, I-Y. (1996). Comparisons of Calculated Respiratory Tract Deposition of Particles Based on the Proposed NCRP Model and the New ICRP66 Model. Aerosol Sci. Technol., 25:134–140.
- You, R, Li, M., Guha, S., Mulholland, G. W., Zachariah, M. R. (2014). Bionanoparticles as Candidate Reference Materials for Mobility Analysis of Nanopartices. Anal. Chem., 86:6836–6842.
- Yu, C. P. (1978). Exact Analysis of Aerosol Deposition During Steady Breathing. Powder Technol., 21:55–62.
- Zhang, Z., Kleinstreuer, C., and Kim, C. S. (2008). Airflow and Nanoparticle Deposition in a 16-Generation Tracheobronchial Airway Model. Ann. Biomed. Eng., 36:2095–2110.
- Zuo, Z., Kuehn, T. H., Verma, H., Kumar, S., Goyal, S. M., et al. (2013). Association of Airborne Virus Infectivity and Survivability with Its Carrier Particle Size. Aerosol Sci. Technol., 47:373–382.