
Abstract
Ice nucleating particles (INP) initiate heterogeneous ice nucleation in mixed-phase clouds, influencing cloud phase and onset temperatures for ice formation. Determination of particle types contributing to atmospheric INP populations requires isolation of the relatively rare INP from a total particle sample, typically followed by time-consuming single-particle characterization. We propose a method to estimate the contributions of light-absorbing, primarily refractory black carbon (rBC), particles to INP populations by selectively removing them prior to determination of INP concentrations. Absorbing particles are heated to their vaporization temperature using laser induced incandescence in a single particle soot photometer (SP2) and the change in INP number concentrations, compared to unheated samples, is assessed downstream in the CSU Continuous Flow Diffusion Chamber (CFDC). We tested this approach in the laboratory using strongly-absorbing and nonabsorbing aerosol types to confirm effective removal of rBC INP and to explore the impact of the processing on non-light-absorbing INP. An INP-active rBC particle type was efficiently removed, while nonabsorbing kaolinite and a soil-based INP were not affected by laser exposure. Results for the products of wiregrass combustion indicated that absorbing particles, primarily rBC, accounted for about 40% of all INP, consistent with electron microscopy of INP emitted during prescribed burns of this fuel type. However, kaolinite internally mixed with rBC exhibited reduced activity after passing through the SP2, suggesting that the validity of the method for realistic internal mixtures needs additional research. The sensitivity of the CFDC presently limits applicability of the method to relatively high INP number concentration samples.
Copyright 2014 American Association for Aerosol Research
1. INTRODUCTION
Heterogeneous ice nucleating particles (INP) are required for ice crystal formation in clouds at temperatures warmer than about −36°C that do not contain pre-existing ice particles (DeMott et al. Citation2010). In the absence of any INP, cloud droplets must cool to temperatures colder than this threshold before freezing homogeneously, that is, without a nucleating surface. The presence, and abundance, of INP in the troposphere is crucial for the development of mixed phase and glaciated clouds with resulting impacts on precipitation and cloud radiative properties (Levin and Cotton Citation2009). Despite their important role in cloud and precipitation formation, however, there is still considerable uncertainty as to the chemical composition and sources of particles capable of initiating heterogeneous ice nucleation (Murray et al. Citation2012). This uncertainty is partly due to the rarity of atmospheric INP, which typically have concentrations ranging from below 0.1 to more than 100 L−1 (DeMott et al. Citation2010; Murray et al. Citation2012), leading to difficulty in measuring INP and isolating these unique particles for further analysis of composition and morphology.
Because of the uncertainties concerning INP, many laboratory and field experiments have studied specific aerosol types to determine their potential role in ice formation. Several particle types have been identified as contributing to INP populations at temperatures warmer than −36°C (Murray et al. Citation2012). Primary among these INP types are crustal material, such as desert soil particle mixtures of specific clays like kaolinite (Luond et al. Citation2010) and specific mineral phases of feldspar (Atkinson et al. Citation2013), and some species of bacteria, most notably pseudomonas syringae (Maki et al. Citation1974).
Soot, or black carbon, has also been suggested as a potential INP due to its insolubility in water and complex fractal morphology, potentially providing an oxidized surface with suitable geometry and chemical bonds for ice nucleation (Gorbunov et al. Citation2001). Laboratory studies investigating the potential role of soot as an INP, however, have produced varied results, with selected types primarily active in the deposition mode below −36°C (Karcher et al. Citation2007). Investigation of ice nucleation by acetylene (DeMott Citation1990) and kerosene (Diehl and Mitra Citation1998) soot established the onset of immersion mode heterogeneous freezing at temperatures as warm as −20 to −22°C, with as many as 1 in 1000 of the particles initiating freezing at these temperatures. Gorbunov et al. (Citation2001) suggested that soot from benzene and toluene combustion could be as effective as some metal oxides, specifically Al2O3 and ZnO, in catalyzing ice crystal formation. Using the data from DeMott (Citation1990) and Diehl and Mitra (Citation1998) expressed in terms of ice nucleation active sites per surface area (Niemand et al. Citation2012), Murray et al. (Citation2012) concluded that soot could be as important as dust in a global, annually averaged, INP inventory. However, a number of other studies in the literature do not support such efficient ice nucleation by soot particles. Dymarska et al. (Citation2006) found no ice nucleation by a variety of soot types at temperatures warmer than −25°C, and onset of ice formation in only a few cases below about −30°C. Friedman et al. (Citation2011) were unable to detect heterogeneous ice nucleation by propane soot particles even at temperatures as low as −30°C. Kanji et al. (Citation2011) found no ice nucleation by a common laboratory graphitic soot at temperatures warmer than −38°C, and Koehler et al. (Citation2009) could not confirm heterogeneous ice nucleation at temperatures warmer than −40°C by combustion-produced soots representing a range of hydrophilicity.
It is possible that the laboratory experiments using relatively simple soot systems do not represent the behaviors of atmospheric black carbon particles well. Several studies, discussed below, have implicated black carbon as a potential INP source in environments with more complex soot or black carbon containing aerosol present. Twohy et al. (Citation2010) found statistically significant positive correlations between black carbon (BC) concentrations present in air feeding orographic clouds and ice crystal concentrations observed in the clouds. These results have now been reproduced by one existing parameterization attributing INP specifically to soot sources (Phillips et al. Citation2013), albeit at lower efficiency than assumed by Murray et al. (Citation2012). Measured INP concentrations were also correlated with BC and ice concentrations in the Twohy et al. (Citation2010) study, although at much lower significance levels. Highest INP concentrations in the same study were associated with direct sampling of prescribed biomass burning plumes, although the INP could not be specifically attributed to soot, as was also the case in biomass burning affected mixed phase clouds in a separate study by Stith et al. (Citation2011). Enhanced INP concentrations were also observed in some smoke plumes from prescribed burning and wildfires (Prenni et al. Citation2012) as well as laboratory combustion of a range of biomass fuels (Petters et al. Citation2009). However, both of these studies observed considerable variability in the fraction of emitted particles capable of nucleating ice, even for the same biomass fuel, and in many cases no INP were detectable. McCluskey et al. (Citation2014) confirmed the specific contribution of INP having soot morphology and composition, derived from burning of natural longleaf pine understories dominated by wiregrass fuels, via aerodynamic collection of activated ice crystals formed on INP and electron microscopy analyses of the residual nuclei. Prenni et al. (Citation2012) measured INP concentrations in smoke plumes from both prescribed burns and wildfires in Colorado forests and observed increased concentrations during more intensely flaming combustion, when black carbon emissions are dominant (McMeeking et al. Citation2009).
While the above studies suggest that aerosol rich in soot or BC can be active in ice nucleation, the only method presently demonstrated for practically identifying BC-containing particles specifically as INP is by separation of activated ice crystals from INP instruments or from clouds using impaction methods and subsequent analyses of the residual INP by electron microscopy and single particle mass spectrometry (Richardson et al. Citation2007; Pratt et al. Citation2010; Cziczo et al. Citation2013; McCluskey et al. Citation2014). This method of ice crystal separation and collection is difficult to perform at high efficiency in practice, and the postanalyses are time consuming and somewhat subjective as each residual INP in the TEM images must be identified and classified individually (McCluskey et al. Citation2014). It is also possible to select ice crystals for real-time analysis via virtual impaction (Boulter et al. Citation2006; Kulkarni et al. Citation2011; Shingler et al. Citation2012; Cziczo and Froyd Citation2014). However, care must be taken to ensure that the size cut of the impactor excludes all non-INP aerosol, as even a small number of non-INP can dominate the signal. Even under ideal conditions, smaller particles can still pass through the inertial barrier in the wake of larger activated crystals or via collision and coalescence with these larger particles (Pekour and Cziczo Citation2011).
Here we present and evaluate a new real-time measurement approach to determine the ice nucleating potential of light-absorbing particles. Our proposed technique selects for light-absorbing particles via laser induced incandescence (LII), utilizing a single particle soot photometer (SP2), and measures the resulting changes in aerosol and INP concentrations. To be consistent with the recent literature (Schwarz et al. Citation2010), we use the term “refractory black carbon” (rBC) to refer to the measured species; further details regarding this measurement are in the following section. In this article we report on a number of laboratory tests performed to explore if the technique removes rBC-containing particles and their INP activity, and whether it affects the ice nucleating potential of non-rBC-containing particles. We also demonstrate the use and effectiveness of this technique with data taken during the fourth Fire Lab at Missoula Experiment (FLAME 4) where we measured emissions from the combustion of biomass fuels in a semicontrolled, laboratory setting (Stockwell et al. Citation2014).
2. METHODS
2.1. Description of the SP2 and the CFDC
Our measurement technique utilizes a SP2 (Droplet Measurement Technologies) as a prefilter to select for light-absorbing particles in the sample upstream of the Colorado State University Continuous Flow Diffusion Chamber (CFDC). The SP2 uses a continuous, 1064 nm Nd:YAG laser to heat absorbing material, primarily rBC, to its vaporization temperature of 3700–4300 K (Schwarz et al. Citation2006). By detecting scattered laser light as well as incandescent light emitted by vaporizing absorbing material, the SP2 provides the number and mass of incandescing particles and the numbers of purely scattering particles in the sample (Schwarz et al. Citation2006). Particles with an incandescing component smaller than ∼70 nm in diameter will not heat up sufficiently to incandesce and be detected, and thus 70 nm is a typical lower detection limit for the SP2 incandescence measurements (Schwarz et al. Citation2010). Non-absorbing particles will scatter light as they pass through the laser but will not absorb any energy and should exit the optical cavity unchanged. In its normal sampling configuration, the SP2 uses two diaphragm pumps to draw in 0.12 VLPM of sample flow and supply 1 VLPM of filtered, dried sheath flow, which confines the sample to the centerline of the laser. Both flows are exhausted together from the SP2 optical cavity. When sampling in the SP2-CFDC coupled configuration, we disconnect the pump from the SP2 exhaust port, replacing it with the CFDC sample line, while the SP2 pump still provides the sheath air. This alters the standard flow ratio in the SP2, increasing the sample flow to about 0.2–0.3 VLPM and the sheath flow to 1.2–1.3 VLPM. All flow rates are recorded automatically at 1 Hz by the SP2, and thus dilution of aerosol concentrations entering the CFDC from the SP2 can be accounted for.
The majority of incandescing material in the atmosphere that has been detected by SP2 instruments has vaporization temperatures consistent with rBC. Subramanian et al. (Citation2010) found that over 80% of incandescing material in air over and downwind of Mexico City was consistent with rBC. Schwarz et al. (Citation2006) found no difference in the vaporization temperature distributions measured for ambient rBC over Houston, Texas and laboratory-generated rBC. However, non-rBC materials, such as certain metals, can also absorb at 1064 nm and incandesce. Laboratory tests have shown the SP2 responds to niobium, silicon, chromium, tungsten, nickel, and aluminum but that many of these materials have distinct vaporization temperature ranges, thus allowing their contribution to the incandescing aerosol concentration to be assessed (Stephens et al. Citation2003; Schwarz et al. Citation2006). Several weakly absorbing materials such as volcanic ash and hematite have also exhibited a limited incandescence signal in the SP2 (Heimerl Citation2011). The mixing state of rBC in the atmosphere is often a complex mixture of embedded, partially coated, or bare particles of varying morphologies (Adachi et al. Citation2007; China et al. Citation2013). However, studies have shown the SP2 capable of detecting rBC coated in up to 50 nm of oleic acid or anthracene (Slowik et al. Citation2007) and connected to other solid aerosol particle types (Moteki et al. Citation2014).
Downstream of the SP2, ice nucleating particles were measured with the CFDC (Rogers et al. Citation2001; Petters et al. Citation2009). The CFDC consists of two concentric ebonized (for wettability) copper pipes creating an annular column through which the sample flow (1.5 VLPM) passes constrained in a lamina within a sheath flow (8.5 VLPM total, divided inside and outside of the aerosol lamina). Flow is recirculated by the CFDC pump to maintain the sheath flow while exhausting an amount equivalent to the sample flow. The inner and outer walls of the annular region are ice coated and temperature controlled at separate temperatures within the upper growth region of the chamber (70% of the flow distance). In the growth region, temperature and relative humidity are calculated to approach nearly steady conditions in the sample lamina along the sample flow path (Rogers Citation1988). By increasing the temperature gradient between the two walls the RH can be increased to values several percent above water saturation. At these conditions, most aerosol particles introduced into the instrument are expected to take up water and grow to cloud droplet size (Rogers Citation1988; Petters et al. Citation2009). If the particle is capable of ice nucleation within the approximately 5 s residence in the growth region, the super-cooled droplet will freeze and form an ice crystal. Both walls are held at the cold wall temperature in the lower 30% of the column, the evaporation section, allowing the RH in the annular gap to relax toward ice saturation, leading to the evaporation of liquid droplets. Activated INP, however, remain as crystals and are readily detected with an optical particle counter (CLIMET 3100) due to their large size relative to the unactivated aerosol, which are limited in diameter by a 2.4 μm impactor on the inlet. The operational lower limit of the OPC detector is ∼500 nm. The number concentrations of aerosol particles with diameters greater than 500 nm (N500) are thus obtained by summing the total OPC counts, while the INP number concentrations (NINP) are obtained by summing counts above the ice threshold size (3 μm) for specified times and thus sample volumes. Uncertainties in CFDC INP concentrations are defined by the measured INP counts as well as the instrument background counts, characterized by intermittent sampling of filtered air (Petters et al. Citation2009). Background counts, which are due to ice crystals flaking off the CFDC walls during normal operation, can range from ∼<1 to a few per liter, and represent the threshold against which ice formation can be detected. For 5 min sampling cycles at 1.5 L/min, and assuming the validity of Poisson counting statistics (Petters et al. Citation2009), measured concentrations of 1/L and 10/L exceeding the background values have relative uncertainties of 73 and 23%, respectively, assuming two standard deviations of variability around the mean value. For all the experiments presented here, we operated the CFDC at −30°C and 105% RHw (relative humidity with respect to water).
2.2. Laboratory Tests
We hypothesized that passing particles through the SP2 with the laser on would lead to the selective removal of rBC particles while nonabsorbing particles would pass through the instrument unchanged. A similar approach is used in the Soot Photometer Aerosol Mass Spectrometer (SP-AMS, Aerodyne Research Inc.) to vaporize rBC containing particles. Like the SP2, the SP-AMS employs a 1064 nm Nd:YAG laser, although the laser is operated at a higher power and particles are exposed to the laser beam for a shorter time period than in the SP2 and under vacuum conditions (Onasch et al. Citation2012). To examine the extent of rBC volatilization in the SP2, CitationAiken et al. (in prep.) used two SP2s in series to measure the changes in rBC due to LII in the SP2 optical cavity. They found almost complete removal of rBC calibration standard particles larger than 100 nm. Here, we further investigate the effect of the SP2 laser on various aerosol types, specifically in relation to aerosol size and ice nucleating ability. We performed a number of laboratory tests using polystyrene latex (PSL; Thermo Fisher Scientific Inc.) spheres, Aquadag (Acheson Industries), a commercially available graphitic carbon commonly used for SP2 calibration (Gysel et al. Citation2011) and Arizona Test Dust (ATD, Powder Technology Inc), as well as two aerosol types known to act in some proportion as INP: kaolinite (Clay Mineral Society, KGa-1b) and soil from an organic alfalfa field (Tobo et al. Citation2014). These test particles were passed through the SP2 and then sent to a Scanning Mobility Particle Sizer (SMPS; consisting of TSI 3081 and TSI 3010) to measure particle size distributions (particle diameters, d = 10–445 nm for Aquadag and 14–685 nm for PSL and ATD) downstream of the SP2 laser, or to the CFDC to determine NINP and N500. The experimental setup is diagrammed in .
FIG. 1. Experimental setup. Components inside the dashed line were not used during every test.
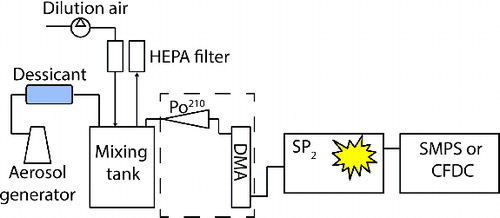
Two aerosol generation systems were used depending on the aerosol type. Kaolinite, soil and ATD aerosol samples were dry generated by passing ∼2 LPM of dry, HEPA-filtered air through a glass flask containing ∼2 g of the desired aerosol source material, following the methods of Tobo et al. (Citation2014). The flask was partially submerged in an ultrasonic bath which continually agitated the sample. The flow containing the sample aerosol was then sent to a 10-L stainless steel mixing tank to dampen fluctuations in the aerosol source, and that also permitted addition of clean dilution air to achieve aerosol concentrations of ∼5000 cm−3. Aquadag and PSL aerosol were wet generated from aqueous solutions using a standard medical nebulizer. After the nebulizer, sample flow was passed through two silica gel diffusion dryers to remove water and was then sent into the mixing tank. For some tests we first size selected the test particles before passing them through the SP2 using a differential mobility analyzer (DMA; TSI 3081) operating at a 5:1 sheath to sample flow rate. When size selecting the sample we did not add dilution air to the mixing tank.
For all laboratory tests, the sample aerosol was passed through the SP2 optical cavity and then measured by the detecting instrument, either the SMPS or CFDC. For certain tests, aerosol concentrations were also measured in parallel with the CFDC using a condensation particle counter (CPC; TSI 3776). We manually cycled the SP2 laser power on and off, allowing several minutes at each setting, and then compared the changes in the measured aerosol and INP number concentrations. Since the only difference in the experimental configuration was laser power, we assume that any changes in measured NINP or N500 were due to the heating and volatilization of absorbing aerosol passing through the laser. For SP2-SMPS tests we measured 3-min size distributions and averaged over three distributions for each laser on:off cycle. For SP2-CFDC tests we averaged NINP and N500 over 5 min for each cycle. Because we were only concerned with the differences in aerosol and INP concentrations with the SP2 laser on and off we did not characterize particle losses when passing the sample through the SP2, assuming they were similar whether the laser was on or off.
2.3. FLAME 4
The SP2-CFDC setup was also deployed during the fourth Fire Laboratory at Missoula Experiment (FLAME 4) described by Stockwell et al. (Citation2014) to determine the ice nucleating potential of rBC containing particles emitted from biomass combustion, a major source of atmospheric rBC and a potentially important INP source (Petters et al. Citation2009; Prenni et al. Citation2012; McCluskey et al. Citation2014). A number of globally relevant biomass fuels were burned during FLAME 4, held during October to November, 2012, at the USDA Fire Sciences Laboratory (FSL) in Missoula, Montana. The main combustion laboratory at the FSL is a ∼3000 m3 room in which smoke from biomass combustion can be held for extended sampling periods or exhausted through a large stack outfitted with sampling ports (Yokelson et al. Citation2008; McMeeking et al. Citation2009). The experimental setup and combustion methods were similar to those of previous FLAME experiments (McMeeking et al. Citation2009; Levin et al. Citation2010). The SP2-CFDC measurements were made during “room burn” experiments, during which 300–2000 g of fuel were burned and fire emissions were held in the combustion lab for about 3 h. Comprehensive analysis of the results from FLAME 4 will not be described in this article. Here we report data from one burn, 1400 g of wiregrass (Aristida stricta) from South Carolina, to demonstrate the application of the SP2-CFDC measurement method for environments dominated by carbonaceous aerosol.
3. RESULTS AND DISCUSSION
3.1. Laboratory Tests
3.1.1. SP2-SMPS
shows SMPS measured size distributions for 400 nm PSL (panel a), Aquadag (b) and ATD (c) test particles with the SP2 laser off (blue) and on (red) averaged over three on:off cycles each. For all three particle types in the tests shown, the SP2 sampled aerosol directly from the mixing tank without size selection. Polysterene latex is purely light scattering, nonabsorbing, and thus should pass through the SP2 laser without any heating or incandescence. In fact for PSL, the fraction of particles detected by the SP2 with an incandescence signal (finc) was only 0.0003 (), and this was likely due to minor contamination in the aerosol generation system or sampling lines. With the laser on, the peak diameter of the main PSL size mode was unchanged although peak height did decrease, likely due to the variability of the aerosol source used during the course of these tests. Summed over the entire size distribution, there was a 5% increase in total number concentration and 10% decrease in total volume concentration when the SP2 laser was turned on ().
TABLE 1 Fraction of particles with an incandescence signal (finc). Ratio of total number and volume concentrations as well as number and volume concentrations for particles less than 70 nm and more than 100 nm in diameter with the laser on to off for the SP2-SMPS tests. All values were averaged over three on:off cycles
FIG. 2. Number size distribution of PSL (a), Aquadag (b), and ATD (c) sampled through the SP2 with laser off (blue) and on (red).
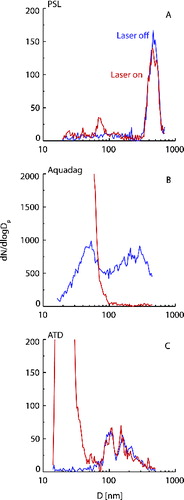
Unlike PSL, rBC is light absorbing at the laser wavelength used and interacted strongly with the SP2 beam (finc = 0.999). There was a sharp drop off in aerosol number concentrations at sizes above ∼70 nm, consistent with the range of measurement sensitivity for the SP2, with a 93% reduction in particle number for diameters larger than 100 nm, and 99% above 160 nm. However, we also observed the appearance of a high number concentration mode at the smallest diameters measured by the SMPS, and extending up to about 70 nm. This increase in aerosol concentration at small sizes could be due to fragmentation of the larger particles or condensation of gases from vaporized particles as discussed by CitationAiken et al. (in prep.). The effects of the SP2 laser on total number and volume concentrations, as well as those <70 nm or >100 nm in diameter, are shown in . The removal of larger particles, and creation of a new nucleation mode, resulted in a one hundred-fold increase in total number concentration, although there was a decrease in particle number concentrations above 100 nm. Total volume concentration for the Aquadag test was reduced by 78%.
Arizona test dust is primarily light scattering at 1064 nm with a measured finc of 0.005 (). Particles with a detectable incandescence signal exhibited a weak incandescence response, especially relative to their size as determined from the light scattering signal measured in the SP2. In all cases there was no evidence of sublimation of the entire particle based on the sustained Gaussian scattering signal occurring after the incandescence pulse was detected. We suspect the incandescence occurred from surface inclusions of incandescent material on the dust particles based on the available data. Similar to the PSL tests, no change in the ATD size distribution was detected when the laser was on for particles greater than ∼70 nm in diameter. However, with the laser on, a particle mode with high number concentrations, centered around 20–30-nm diameter, was observed, resulting in a more than a 5-fold increase in total number concentration. As with the Aquadag tests, this small size mode is likely the result of vaporization and recondensation of the incandescing material detected when the SP2 laser was on.
The SP2-SMPS tests confirmed that larger (d > 100 nm), rBC particles are vaporized or fragmented by the SP2 laser, while nonlight-absorbing particles will pass through the instrument essentially unchanged in size. However, even a small fraction of incandescing particles, as seen in the ATD test, will result in the formation of a nucleation mode with much higher number concentrations than the original sample, leading to increases in total number concentration. Given the small size of these newly formed particles, and thus the limited area for any ice active surface sites, it is unlikely that these newly formed nucleation mode particles are an important contributor to NINP. For example, Marcolli et al. (Citation2007) state, based on experimental and theoretical considerations, that ATD particles must have a diameter of at least 100 nm to exhibit on average one immersion freezing active site. DeMott et al. (Citation2010) discuss other observational evidence suggesting a similar size below which most natural INP are not observed, and the fact that average atmospheric INP sizes are on the order of 500 nm. However, given the large number concentration enhancement when the SP2 laser was turned on for samples with incandescing particles, it was necessary to confirm that these small particles do not lead to increases in NINP. Further, it was necessary to confirm that passing the sample through the SP2 laser does not alter surface properties and ice nucleating potential of the aerosol. For example, we observed the formation of a nucleation mode from the condensation of vaporized incandescent material. If a nonabsorbing particle was present, however, this material could also condense to the surface, potentially altering IN activity. A further case of interest is when nonabsorbing material is internally mixed with some rBC components that will heat up during laser exposure, again potentially altering the surface of the nonabsorbing component. To investigate these potential issues we directly tested the effect of the SP2 laser on the ice nucleating ability of several aerosol types by passing the sample through the SP2, cycling laser power on and off, and measuring NINP and N500 downstream with the CFDC.
3.1.2. SP2-CFDC
For the SP2-CFDC tests we generated polydisperse particles of kaolinite, a clay mineral, soil from an organic alfalfa field, in which the ice nucleating particles included organics (∼80% by number at a size of 600 nm) and a combination of minerals or organo-mineral complexes (∼20% by number at a size of 600 nm) for the CFDC processing conditions used (Tobo et al. Citation2014), as well as size-selected Aquadag particles. For all aerosol types we monitored NINP and N500 for 5 min each with the SP2 laser on and off. This cycle was repeated five times. Average NINP and N500 were determined for laser on and off cycles over five consecutive laser cycles for the soil and Aquadag tests. For the kaolinite test, we compared concentrations with the laser on and off during two separate periods to account for the nonsteady Ntotal generated during this test. shows the fractional change in NINP and N500 when the SP2 laser was turned on for all aerosol types tested in this manner. Error bars in show average uncertainty calculated from the standard error of the mean for each averaging period. This represents variability in aerosol concentration during each laser on or off measurement period.
FIG. 3. Fractional change due to SP2 laser processing in NINP (light blue symbols) and N500 (black symbols) for test particles of kaolinite, organic alfalfa soil, 600 nm Aquadag, mixed 600 nm kaolinite and Aquadag, and smoke from the laboratory combustion of wiregrass during FLAME 4. Error bars represent variability calculated from the standard error of the mean during the averaging period.
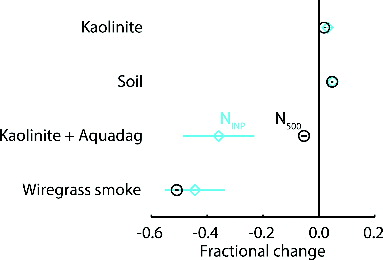
For both kaolinite and agricultural soil, there was an increase in both NINP and N500 when the SP2 laser was turned on. We assume that the increases in N500 were not due to particle formation as no increase in number concentration of particles larger than 100 nm was observed during the SP2-SMPS tests. Also, for both the soil and kaolinite tests the increases in N500 and NINP were similar, that is there was no change in the fraction of particles, referenced to those larger than 500 nm, capable of nucleating ice. Therefore, it is likely that the changes observed during these tests were due to changes in the aerosol source fluctuations and not due to processing by the SP2 laser.
The kaolinite particles had a near-zero incandescent fraction, however for the soil tests finc = 0.012. As with the SP2-SMPS tests above, this absorbing material could have led to the formation of a new particle mode. In samples where a nucleation mode was observed to form after SP2 processing of the aerosol, it is certainly the case that some recondensation of volatilized material was also occurring in competition with the nucleation process. Some condensation could have occurred onto particles present in the optical cavity or SP2 exhaust stream; however, we note that the interior surfaces of the instrumentation represent large surface areas for condensational sinks, and the frequent observation of a nucleation mode suggests that condensation alone was not effective in quickly reducing vapor concentration. We also note that we observed a new particle mode for the ATD case in which only 0.5% particles incandesced, so that even for the case with a much larger nonabsorbing than absorbing component, new particle formation was still a favored process over condensation for at least some of the volatilized material. Further, for the soil test where rBC volatilization was clearly occurring based on the detection of an incandescence signal in the SP2, no changes in INP activity were detectable, suggesting significant recondensation onto INP was either not occurring or had minimal impact on INP activity. We are not aware of any studies in the literature suggesting that carbonaceous coatings might deactivate INP active in the mixed-phase regime; only treatment with sulfuric acid appeared to affect INP activity, and this was interpreted as resulting from chemical reaction of the acid with certain mineral constituents (Sullivan et al. Citation2010). Despite these potentially complicating factors, however, no changes due to SP2 laser processing were observable by the CFDC method for the ice nucleating potential of a clay mineral (kaolinite) or the organic carbon and mineral types of INP found in many soils.
Test experiments with the CFDC revealed that, as generated, Aquadag particles possessed some ice nucleating potential with an ice nucleation efficiency for 600-nm size selected particles, calculated as the ratio of NINP to total aerosol concentration measured by a CPC, of 2.3 × 10⁻⁴ (± a factor of 2). This IN efficiency is roughly 40% of that calculated for 600-nm kaolinite at this temperature (Tobo et al. Citation2014). Strongly light absorbing particles are likely to be undersized in optical measurements (Hand and Kreidenweis Citation2002), and the OPC on the CFDC was largely unable to detect the Aquadag particles with a measured ratio of N500 to the total number concentration of size selected particles of 0.04. When sampling with the SP2-CFDC setup, and the SP2 laser on, however, the particles detected by the OPC were removed with a fractional change in N500 of −0.99 (). The ice nucleation activity of Aquadag particles was also reduced when the laser was turned on, with a fractional change in ice nuclei concentrations of −0.96 on average. As with the SP2-SMPS Aquadag test, we were likely generating a large nucleation mode when the SP2 laser was on; however, we detected no impact on N500 or NINP from these newly formed particles.
A final case of interest for atmospheric sampling is internal mixing of nonabsorbing INP with rBC, which may lead to destruction or alteration of the INP by exposing them to the high temperatures achieved during rBC incandescence. To test this, we generated mixed kaolinite and Aquadag particles with an overall mobility diameter of 600 nm and passed these through the SP2, again measuring downstream with the CFDC. Each particle type was generated separately as polydisperse particles using the methods described above and the two sample streams were combined through a ¼-inch stainless steel tee fitting that then entered a 75.7 L stainless steel mixing tank. Flow was continuous and provided an average residence time of 50 min in the stainless mixing tank. Sampling was begun 1 h after starting aerosol generation. The sample was drawn from the mixing tank, size selected using a DMA operating at a 5:1 sheath to sample flow ratio and sent to the SP2-CFDC.
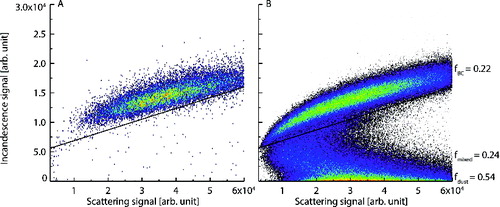
To determine the mixing state of the sample aerosol, we examined the peak heights of the low gain scattering and incandescence signals measured by the SP2. We used these instead of the high gain signals as the latter were saturated by the 600-nm particles. This analysis differs from the leading-edge only analysis used to give quantitative information on rBC coatings as we were only interested in basic mixing state information for our tests. shows peak heights of the broad band low gain (BBLG) incandescence signal plotted against the peak heights of the scattering low gain (SCLG) signal, colored by point density. These signals are shown for both unmixed, 600-nm Aquadag as well as the mixed Aquadag/kaolinite sample. For the latter aerosol, two distinct modes are discernable in , separated by a line, one in which scattering and incandescence increased roughly linearly and one in which incandescence was unrelated to scattering. Schwarz et al. (Citation2006) showed that for pure rBC particles, scattering and incandescence are positively, linearly correlated, and we thus assumed the particles in this mode were unmodified Aquadag. This mode also corresponds to the signals measured during calibration using pure 600-nm Aquadag. The particles for which there was no detectable incandescence signal we assumed were unmodified kaolinite. All particles that did not fall into one of these two unmodified aerosol modes we assumed to be some mixture of Aquadag and kaolinite. Using these three classifications we calculated the fractional contribution of unmodified Aquadag (fBC = 0.22), unmodified kaolinite (fdust = 0.54), and mixed particles (fmixed = 0.24). The value for fmixed is likely a lower limit as any mixed particle containing an rBC aggregated particle smaller than ∼70 nm would not have a detectible incandescence signal. Further, an rBC particle attached to a larger kaolinite particle could be shaded by the nonabsorbing component and pass through the laser undetected. This would again lead to an underestimation of the mixed fraction. However, clearly we were able to achieve some mixing of the two aerosol types, which was the goal for this semiquantitative test.
FIG. 4. Incandescence versus scattering signal peak heights measured by the SP2 for 600 nm Aquadag (a) and mixed 600 nm kaolinite and Aquadag (b) test particles. Red colors indicate high-point density and blue low-point density. The solid line indicates the local minimum between the unmixed Aquadag and mixed aerosol modes.
Averaged over four laser on:off time periods, the fractional change in N500 was −0.05 for the mixed aerosol case (). Assuming the OPC on the CFDC was only able to detect 4% of the unmodified Aquadag particles, as seen above, the removal of these particles by the SP2 laser would only account for a 1% reduction in N500. The remaining observed decrease in N500 was likely due to the removal of mixed particles, since unmodified kaolinite should have been unaffected. However, the small decrease in N500 relative to fmixed indicates that the mixed particles were for the most part not removed due to vaporization of their rBC component. Moteki et al. (Citation2014) used the SP2 to determine the mixing state of rBC containing particles and were able to distinguish between coated rBC and rBC attached to other solid aerosol species. For this second aerosol type they observed a scattering signal persisting after the rBC component had vaporized, indicating that the scattering component was not completely destroyed due to heating. We observed similar scatting signals in our analysis, and given the small change in N500 relative to the mixed aerosol fraction, conclude that most of the mixed particles were not completely removed from the sample.
We observed a larger decrease in NINP than in N500 for the mixed aerosol case with a fractional change of −0.36 (). Given the aerosol type fractions and IN efficiencies reported above, and assuming that the unmixed kaolinite particles passed through the SP2 unaffected, based on previous tests, this measured decrease in NINP indicates that at least 74% of the of the mixed INP were deactivated following exposure to the SP2 laser. Since the scattering signal suggests that these particles were largely not removed by the heating of their rBC fraction, this result suggests that the surface of the kaolinite in the mixed particles was altered enough due to heating to inhibit ice nucleation. Deactivation or destruction of INP due to heating will likely depend on the amount of rBC associated with the particle, and thus the amount of heat energy transferred to the aerosol during LII, as well as the surface characteristics of the non-rBC INP. Thus, future testing will be needed to fully explore and quantify the effects of SP2 processing on internally mixed aerosol.
As shown by the Aquadag/kaolinite test, the SP2-CFDC configuration could lead to the removal of non-rBC INP in certain cases. However, atmospheric BC containing particles are typically assumed to contain a core of BC surrounded by other condensed components, such as organic or sulfate compounds (Adachi et al. Citation2010), and many ambient studies have supported this view. For example, Moteki et al. (Citation2014) found that in a polluted Tokyo environment, 90% of rBC containing aerosol were coated, while only 10% contained rBC attached to some other solid particle, which was not necessarily dust. Adachi and Buseck (Citation2008) found that 4% or less of the soot-containing particles in Mexico City were attached to dust particles, with the majority of soot particles either bare or coated by some condensed material. Since the condensed material in these types of particles is generally water soluble it is likely not active in ice nucleation, although the condensed species could change the aerosol hygroscopicity and thus the potential for the rBC to act as an immersion freezing nuclei. Therefore, for typical core/shell particle types, any changes in INP concentrations detected using the SP2-CFDC method could still be attributed to the nonsoluble, rBC component. However, internally mixed dust/BC particles have also been observed, for example in Asian outflow regions after mixing of dust plumes with biomass burning emissions or anthropogenic pollution (Clarke et al. Citation2004; Arimoto et al. Citation2006). While mixed dust/BC particles accounted for a small fraction of the BC containing particles in those studies, application of our SP2-CFDC method in environments in which such particles are present will require further analysis to interpret observed changes in NINP after LII. One possibility is to use the SP2 time-dependent response signal to determine rBC mixing state as done by Moteki at al. (Citation2014).
3.2. FLAME 4
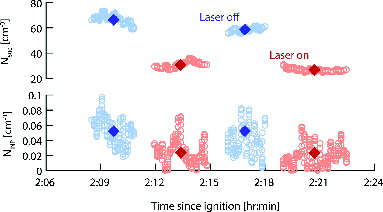
The FLAME 4 experiments offered ideal circumstances to test the SP2-CFDC technique on biomass combustion aerosols that are dominated by carbonaceous material, with black carbon accounting for a larger fraction of total aerosol carbon as combustion efficiency increases (Levin et al. Citation2010). In the example test reported here, we burned 1400 g of wiregrass arranged on the fuel bed so that ∼2/3rd of the fuel was standing, with the remainder lying flat, to mimic natural burning conditions. The fire was dominated by flaming combustion with a fire integrated modified combustion efficiency of 0.97; values above 0.9 are typically assumed to indicate a predominance of flaming combustion (Yokelson et al. Citation2008; McMeeking et al. Citation2009). The fraction of total emitted aerosol particles for the wiregrass burn that were determined to be INP, at the measurement conditions, was 2.5 × 10⁻⁶.
We measured with the SP2-CFDC for two laser on:off cycles, allowing for 3 min at each laser setting (). To account for the decrease in aerosol concentration in the combustion lab over time, evident in the N500 concentrations shown in , we linearly fit both N500 and NINP and used the ratio between the fits during laser on:off periods to determine the fractional changes shown in . When the laser was turned on, reductions in both NINP and N500 were observed, with fractional changes of −0.44 and −0.51, respectively. These results indicate that rBC or rBC-containing particles in the smoke contribute to the INP produced, and could thus represent an important emission source of INP during prescribed fires or wildfires. These conclusions regarding the role of rBC as INP are fully consistent with detailed electron microscope inspection of INP measured from prescribed fires of predominately wiregrass fuel reported by McCluskey et al. (Citation2014).
FIG. 5. N500 (top) and NINP (bottom) during a FLAME 4 wiregrass burn measured with SP2 laser off (blue) and on (red). Filled points indicate averages for each laser off or on time period, while open symbols are 1 Hz CFDC data.
4. APPLICATION
While initial tests with simple particle types, and relatively high number concentrations, indicate that the SP2-CFDC system can determine the contribution of incandescent particles to INP loadings, the ultimate purpose of our proposed technique is to determine the contribution of rBC or rBC-containing particles to INP loadings in various environments and at various temperature and RH conditions. While this will be the topic of future research, here we seek to identify the range of conditions where the potential signal-to-noise is high enough to obtain valid data using the SP2-CFDC setup. Ambient concentrations of both INP and rBC aerosol types are highly variable. Measurements and model estimates of background black carbon number concentrations for the northern hemispheric troposphere range from ∼1–10,000 cm−3 (Hoose et al. Citation2010; Murray et al. Citation2012; Bond et al. Citation2013; Phillips et al. Citation2013; Reddington et al. Citation2013). Estimates of the fraction of these particles that can act as INP at −30ºC and above water saturation are also broad. Phillips et al. (Citation2013) estimate an ice active fraction of 1×10⁻³, consistent with SP2 measurements of rBC and ice particle concentrations measured during flights through wave clouds, while Murray et al. (Citation2012) assumed that 1 in 100 BC particles can initiate ice formation based on laboratory experiments using the most active BC types ever assessed (in a laboratory setting) at these conditions. Petters et al. (Citation2009) measured an ice active fraction for biomass combustion smoke, in which rBC likely contributed to the INP concentration but were not necessarily the only component, of <1×10⁻⁴ to 1×10⁻¹. McCluskey et al. (Citation2014) measured ice active fractions ∼1×10⁻⁵ for biomass combustion smoke from prescribed and wild fires. Finally, Pratt et al. (Citation2009) measured INP concentrations and the composition of ice crystal residuals during an aircraft campaign in Wyoming. They measured INP concentrations of ∼2–10 L−1 with 4% of ice crystal residuals (limited by method to sizes above about 200 nm) having soot composition. Phillips et al. (Citation2013), however, estimate that up to 30% of INP could be soot for typical background tropospheric conditions.
Based on these previous estimates, Figure 6 summarizes the potential rBC-INP concentrations per liter based on the ranges of rBC number concentrations and the INP fraction of these particles. The region where the contribution of rBC particles to INP concentrations could be detectable by the CFDC, based on the measurement uncertainty discussed in Section 2.1, dependent on the stability of the INP concentration and composition, is shown. For scenarios with lower concentrations of rBC or less active rBC it could be possible to use particle concentration methods such as that used by Tobo et al. (Citation2013), or employ an alternate detection method for INP such as collection of bulk aerosol samples (Garcia et al. Citation2012) downstream of the SP2 with subsequent analysis via immersion freezing techniques (Hill et al. Citation2014). This approach would allow for longer sampling periods and larger integrated sample volumes and thus allow for detection of smaller fractional contributions of rBC to INP populations. However, extending sampling times increases the possibility that the contribution of rBC to INP could change from the laser on to off periods.
FIG. 6. rBC-INP number concentrations [L−1] as a function of rBC active fraction and rBC total number concentration in various expected atmospheric situations.
![FIG. 6. rBC-INP number concentrations [L−1] as a function of rBC active fraction and rBC total number concentration in various expected atmospheric situations.](/cms/asset/78af1c0c-8394-43a8-a8a3-4a5ae58b309d/uast_a_977843_f0006_oc.jpg)
5. CONCLUSIONS
Our tests show that the SP2 can be used as a filtering device to selectively remove incandescent material, which is primarily rBC, allowing us to quantify the contribution of these particles to INP loadings. This method has many potentially useful applications in areas with high rBC, such as smoke plumes from biomass burning or polluted urban environments. By selectively removing rBC-containing particles, and leaving other aerosol components unchanged, it can be determined if, and to what extent, the rBC particles are contributing to the INP concentration. Using the SP2 as a filter for a specific particle type could also have other applications besides ice nucleation studies, although account must be taken in any particular application for the possible influences of the large nucleation mode which is generated when the SP2 laser is on (CitationAiken et al. in prep.). While SP2-CFDC tests were unambiguous for individual particle types, such as soil, clay mineral or graphitic carbon, mixed kaolinite/Aquadag tests indicated the possibility of false positive attribution to ice nucleation by rBC in some cases.
Application of the method during the FLAME 4 study showed that the SP2-CFDC setup can potentially provide useful insight to sources of INP in areas impacted by biomass burning emissions. For the test case presented here, in which emissions from the combustion of wiregrass were sampled, we observed a decrease in NINP of 44% due to laser processing, indicating a large contribution of incandescent particles to the INP population. Given the locally very high concentrations of rBC particles in smoke plumes, these results indicate that fires could be a significant source of INP to clouds, at least locally.
FUNDING
This work was funded by NASA Earth Science Division award NNX12AH17G, with additional partial support from NOAA Atmospheric Composition Program award NA10OAR4310103.
REFERENCES
- Adachi, K., and Buseck, P. R. (2008). Internally Mixed Soot, Sulfates, and Organic Matter in Aerosol Particles from Mexico City. Atmos. Chem. Phys., 8:6469–6481.
- Adachi, K., Chung, S. H., and Buseck, P. R. (2010). Shapes of Soot Aerosol Particles and Implications for Their Effects on Climate. J. Geophys. Res.-Atmos., 115.
- Adachi, K., Chung, S. H., Friedrich, H., and Buseck, P. R. (2007). Fractal Parameters of Individual Soot Particles Determined using Electron Tomography: Implications for Optical Properties. J. Geophys. Res.-Atmos., 112.
- Arimoto, R., Kim, Y. J., Kim, Y. P., Quinn, P. K., Bates, T. S., Anderson, T. L., Gong, S., Uno, I., Chin, M., Huebert, B. J., Clarke, A. D., Shinozuka, Y., Weber, R. J., Anderson, J. R., Guazzotti, S. A., Sullivan, R. C., Sodeman, D. A., Prather, K. A. and Sokolik, I. N. (2006). Characterization of Asian Dust During ACE-Asia. Global Planet. Change, 52:23–56.
- Aiken, A. C., McMeeking, G. R., Dubey, M. K., DeMott, P. J., Levin, E. J. T. and Kreidenweis, S. M. (in prep.). A New Method for the Online Removal of Submicron Black Carbon using Laser-Induced Incandescence in the Single Particle Soot Photometer.
- Atkinson, J. D., Murray, B. J., Woodhouse, M. T., Whale, T. F., Baustian, K. J., Carslaw, K. S., Dobbie, S., O’Sullivan, D. and Malkin, T. L. (2013). The Importance of Feldspar for Ice Nucleation by Mineral Dust in Mixed-Phase Clouds. Nature, 498:355–358.
- Bond, T. C., Doherty, S. J., Fahey, D. W., Forster, P. M., Berntsen, T., DeAngelo, B. J., Flanner, M. G., Ghan, S., Karcher, B., Koch, D., Kinne, S., Kondo, Y., Quinn, P. K., Sarofim, M. C., Schultz, M. G., Schulz, M., Venkataraman, C., Zhang, H., Zhang, S., Bellouin, N., Guttikunda, S. K., Hopke, P. K., Jacobson, M. Z., Kaiser, J. W., Klimont, Z., Lohmann, U., Schwarz, J. P., Shindell, D., Storelvmo, T., Warren, S. G. and Zender, C. S. (2013). Bounding the Role of Black Carbon in the Climate System: A Scientific Assessment. J. Geophys. Res.-Atmos., 118:5380–5552.
- Boulter, J. E., Cziczo, D. J., Middlebrook, A. M., Thomson, D. S., and Murphy, D. M. (2006). Design and Performance of a Pumped Counterflow Virtual Impactor. Aerosol Sci. Technol., 40:969–976.
- China, S., Mazzoleni, C., Gorkowski, K., Aiken, A. C., and Dubey, M. K. (2013). Morphology and Mixing State of Individual Freshly Emitted Wildfire Carbonaceous Particles. Nat. Commun., 4.
- Clarke, A. D., Shinozuka, Y., Kapustin, V. N., Howell, S., Huebert, B., Doherty, S., Anderson, T., Covert, D., Anderson, J., Hua, X., Moore, K. G., McNaughton, C., Carmichael, G. and Weber, R. (2004). Size Distributions and Mixtures of Dust and Black Carbon Aerosol in Asian Outflow: Physiochemistry and Optical Properties. J. Geophys. Res.-Atmos., 109.
- Cziczo, D. J., and Froyd, K. D. (2014). Sampling the Composition of Cirrus Ice Residuals. Atmos. Res., 142:15–31.
- Cziczo, D. J., Froyd, K. D., Hoose, C., Jensen, E. J., Diao, M. H., Zondlo, M. A., Smith, J. B., Twohy, C. H. and Murphy, D. M. (2013). Clarifying the Dominant Sources and Mechanisms of Cirrus Cloud Formation. Science, 340:1320–1324.
- DeMott, P. J. (1990). An Exploratory-Study of Ice Nucleation by Soot Aerosols. J. Appl. Meteorol., 29:1072–1079.
- DeMott, P. J., Prenni, A. J., Liu, X., Kreidenweis, S. M., Petters, M. D., Twohy, C. H., Richardson, M. S., Eidhammer, T. and Rogers, D. C. (2010). Predicting Global Atmospheric Ice Nuclei Distributions and Their Impacts on Climate. Proc. Nat. Acad. Sci. USA, 107:11217–11222.
- Diehl, K., and Mitra, S. K. (1998). A Laboratory Study of the Effects of a Kerosene-Burner Exhaust on Ice Nucleation and the Evaporation Rate of Ice Crystals. Atmos. Environ., 32:3145–3151.
- Dymarska, M., Murray, B. J., Sun, L. M., Eastwood, M. L., Knopf, D. A., and Bertram, A. K. (2006). Deposition Ice Nucleation on Soot at Temperatures Relevant for the Lower Troposphere. J. Geophys. Res.-Atmos., 111, doi:10.1029/2005JD006627
- Friedman, B., Kulkarni, G., Beranek, J., Zelenyuk, A., Thornton, J. A. and Cziczo, D. J. (2011). Ice Nucleation and Droplet Formation by Bare and Coated Soot Particles. J. Geophys. Res.-Atmos., 116.
- Garcia, E., Hill, T. C. J., Prenni, A. J., DeMott, P. J., Franc, G. D. and Kreidenweis, S. M. (2012). Biogenic Ice Nuclei in Boundary Layer Air Over Two U.S. High Plains Agricultural Regions. J. Geophys. Res.-Atmos., 117, doi:10.1029/2012JD018343
- Gorbunov, B., Baklanov, A., Kakutkina, N., Windsor, H. L., and Toumi, R. (2001). Ice Nucleation on Soot Particles. J. Aerosol Sci., 32:199–215.
- Gysel, M., Laborde, M., Olfert, J. S., Subramanian, R., and Grohn, A. J. (2011). Effective Density of Aquadag and Fullerene Soot Black Carbon Reference Materials Used for SP2 Calibration. Atmos. Meas. Tech., 4:2851–2858.
- Hand, J. L., and Kreidenweis, S. M. (2002). A New Method for Retrieving Particle Refractive Index and Effective Density from Aerosol Size Distribution Data. Aerosol Sci. Technol., 36:1012–1026.
- Heimerl, K. E. (2011). Characterisation of the DLR Single Particle Soot Photometer and its Sensitivity to Different Absorbing Aerosol Types, in Department of Physics, Ludwig-Maximilians-Universität, Munich.
- Hill, T. C. J., Moffett, B. F., DeMott, P. J., Georgakopoulos, D. G., Stump, W. L. and Franc, G. D. (2014). Measurement of Ice Nucleation-Active Bacteria on Plants and in Precipitation by Quantitative PCR. Appl. Environ. Microbiol., 80:1256–1267.
- Hoose, C., Kristjansson, J. E., Chen, J. P., and Hazra, A. (2010). A Classical-Theory-Based Parameterization of Heterogeneous Ice Nucleation by Mineral Dust, Soot, and Biological Particles in a Global Climate Model. J. Atmos. Sci., 67:2483–2503.
- Kanji, Z. A., DeMott, P. J., Mohler, O., and Abbatt, J. P. D. (2011). Results from the University of Toronto Continuous Flow Diffusion Chamber at ICIS 2007: Instrument Intercomparison and Ice Onsets for Different Aerosol Types. Atmos. Chem. Phys., 11:31–41.
- Karcher, B., Mohler, O., DeMott, P. J., Pechtl, S., and Yu, F. (2007). Insights Into the Role of Soot Aerosols in Cirrus Cloud Formation. Atmos. Chem. Phys., 7:4203–4227.
- Koehler, K. A., DeMott, P. J., Kreidenweis, S. M., Popovicheva, O. B., Petters, M. D., Carrico, C. M., Kireeva, E. D., Khokhlova, T. D. and Shonija, N. K. (2009). Cloud Condensation Nuclei and Ice Nucleation Activity of Hydrophobic and Hydrophilic Soot Particles. Phys. Chem. Chem. Phys., 11:7906–7920.
- Kulkarni, G., Pekour, M., Afchine, A., Murphy, D. M., and Cziczo, D. J. (2011). Comparison of Experimental and Numerical Studies of the Performance Characteristics of a Pumped Counterflow Virtual Impactor. Aerosol Sci. Technol., 45:382–392.
- Levin, E. J. T., McMeeking, G. R., Carrico, C. M., Mack, L. E., Kreidenweis, S. M., Wold, C. E., Moosmuller, H., Arnott, W. P., Hao, W. M., Collett, J. L. and Malm, W. C. (2010). Biomass Burning Smoke Aerosol Properties Measured During Fire Laboratory at Missoula Experiments (FLAME). J. Geophys. Res.-Atmos., 115.
- Levin, Z., and Cotton, W. R. (2009). Aerosol Pollution Impact on Precipitation a Scientific Review, Springer, London.
- Luond, F., Stetzer, O., Welti, A., and Lohmann, U. (2010). Experimental Study on the Ice Nucleation Ability of Size-Selected Kaolinite Particles in the Immersion Mode. J. Geophys. Res.-Atmos., 115.
- Maki, L. R., Galyan, E. L., Changchi. Mm and Caldwell, D. R. (1974). Ice Nucleation Induced by Pseudomonas-Syringae. Appl. Microbiol., 28:456–459.
- Marcolli, C., Gedamke, S., Peter, T., and Zobrist, B. (2007). Efficiency of Immersion Mode Ice Nucleation on Surrogates of Mineral Dust. Atmos. Chem. Phys., 7:5081–5091.
- McCluskey, C. S., DeMott, P. J., Prenni, A. J., Levin, E. J. T., McMeeking, G. R., Sullivan, A. P., Hill, T. C. J., Nakao, S., Carrico, C. M. and Kreidenweis, S. M. (2014). Characteristics of Atmospheric Ice Nucleating Particles Associated With Biomass Burning in the US: Prescribed Burns and Wildfires. J. Geophys. Res.
- McMeeking, G. R., Kreidenweis, S. M., Baker, S., Carrico, C. M., Chow, J. C., Collett, J. L., Hao, W. M., Holden, A. S., Kirchstetter, T. W., Malm, W. C., Moosmuller, H., Sullivan, A. P. and Wold, C. E. (2009). Emissions of Trace Gases and Aerosols During the Open Combustion of Biomass in the Laboratory. J. Geophys. Res.-Atmos., 114.
- Moteki, N., Kondo, Y., and Adachi, K. (2014). Identification by Single-Particle Soot Photometer of Black Carbon Particles Attached to Other Particles: Laboratory Experiments and Ground Observations in Tokyo. J. Geophys. Res.: Atmos.
- Murray, B. J., O’Sullivan, D., Atkinson, J. D., and Webb, M. E. (2012). Ice Nucleation by Particles Immersed in Supercooled Cloud Droplets. Chem. Soc. Rev., 41:6519–6554.
- Niemand, M., Mohler, O., Vogel, B., Vogel, H., Hoose, C., Connolly, P., Klein, H., Bingemer, H., DeMott, P., Skrotzki, J. and Leisner, T. (2012). A Particle-Surface-Area-Based Parameterization of Immersion Freezing on Desert Dust Particles. J. Atmos. Sci., 69:3077–3092.
- Onasch, T. B., Trimborn, A., Fortner, E. C., Jayne, J. T., Kok, G. L., Williams, L. R., Davidovits, P. and Worsnop, D. R. (2012). Soot Particle Aerosol Mass Spectrometer: Development, Validation, and Initial Application. Aerosol Sci. Technol., 46:804–817.
- Pekour, M. S., and Cziczo, D. J. (2011). Wake Capture, Particle Breakup, and Other Artifacts Associated with Counterflow Virtual Impaction. Aerosol Sci. Technol., 45:758–764.
- Petters, M. D., Parsons, M. T., Prenni, A. J., DeMott, P. J., Kreidenweis, S. M., Carrico, C. M., Sullivan, A. P., McMeeking, G. R., Levin, E., Wold, C. E., Collett, J. L. and Moosmuller, H. (2009). Ice Nuclei Emissions from Biomass Burning. J. Geophys. Res.-Atmos., 114, doi:10.1029/2008JD011532
- Phillips, V. T. J., Demott, P. J., Andronache, C., Pratt, K. A., Prather, K. A., Subramanian, R. and Twohy, C. (2013). Improvements to an Empirical Parameterization of Heterogeneous Ice Nucleation and its Comparison with Observations. J. Atmos. Sci., 70:378–409.
- Pratt, K. A., DeMott, P. J., French, J. R., Wang, Z., Westphal, D. L., Heymsfield, A. J., Twohy, C. H., Prenni, A. J. and Prather, K. A. (2009). In situ Detection of Biological Particles in Cloud Ice-Crystals. Nat. Geosci., 2:397–400.
- Pratt, K. A., Heymsfield, A. J., Twohy, C. H., Murphy, S. M., DeMott, P. J., Hudson, J. G., Subramanian, R., Wang, Z. E., Seinfeld, J. H. and Prather, K. A. (2010). In Situ Chemical Characterization of Aged Biomass-Burning Aerosols Impacting Cold Wave Clouds. J. Atmos. Sci., 67:2451–2468.
- Prenni, A. J., DeMott, P. J., Sullivan, A. P., Sullivan, R. C., Kreidenweis, S. M., and Rogers, D. C. (2012). Biomass Burning as a Potential Source for Atmospheric Ice Nuclei: Western Wildfires and Prescribed Burns. Geophys. Res. Lett., 39, doi:10.1029/2012GL051915
- Reddington, C. L., McMeeking, G., Mann, G. W., Coe, H., Frontoso, M. G., Liu, D., Flynn, M., Spracklen, D. V. and Carslaw, K. S. (2013). The Mass and Number Size Distributions of Black Carbon Aerosol Over Europe. Atmos. Chem. Phys., 13:4917–4939.
- Richardson, M. S., DeMott, P. J., Kreidenweis, S. M., Cziczo, D. J., Dunlea, E. J., Jimenez, J. L., Thomson, D. S., Ashbaugh, L. L., Borys, R. D., Westphal, D. L., Casuccio, G. S. and Lersch, T. L. (2007). Measurements of Heterogeneous Ice Nuclei in the Western United States in Springtime and Their Relation to Aerosol Characteristics. J. Geophys. Res.-Atmos., 112, doi:10.1029/2006JD007500
- Rogers, D. C. (1988). Development of a Continuous Flow Thermal Gradient Diffusion Chamber for Ice Nucleation Studies. Atmos. Reas., 22:149–181.
- Rogers, D. C., DeMott, P. J., Kreidenweis, S. M., and Chen, Y. L. (2001). A Continuous-Flow Diffusion Chamber for Airborne Measurements of Ice Nuclei. J. Atmos. Ocean. Technol., 18:725–741.
- Schwarz, J. P., Gao, R. S., Fahey, D. W., Thomson, D. S., Watts, L. A., Wilson, J. C., Reeves, J. M., Darbeheshti, M., Baumgardner, D. G., Kok, G. L., Chung, S. H., Schulz, M., Hendricks, J., Lauer, A., Karcher, B., Slowik, J. G., Rosenlof, K. H., Thompson, T. L., Langford, A. O., Loewenstein, M. and Aikin, K. C. (2006). Single-Particle Measurements of Midlatitude Black Carbon and Light-Scattering Aerosols from the Boundary Layer to the Lower Stratosphere. J. Geophys. Res.-Atmos., 111, doi:10.1029/2006JD007076
- Schwarz, J. P., Spackman, J. R., Gao, R. S., Perring, A. E., Cross, E., Onasch, T. B., Ahern, A., Wrobel, W., Davidovits, P., Olfert, J., Dubey, M. K., Mazzoleni, C. and Fahey, D. W. (2010). The Detection Efficiency of the Single Particle Soot Photometer. Aerosol Sci. Technol., 44:612–628.
- Shingler, T., Dey, S., Sorooshian, A., Brechtel, F. J., Wang, Z., Metcalf, A., Coggon, M., Mulmenstadt, J., Russell, L. M., Jonsson, H. H. and Seinfeld, J. H. (2012). Characterisation and Airborne Deployment of a New Counterflow Virtual Impactor Inlet. Atmos. Meas. Techn., 5:1259–1269.
- Slowik, J. G., Cross, E. S., Han, J. H., Kolucki, J., Davidovits, P., Williams, L. R., Onasch, T. B., Jayne, J. T., Kolb, C. E. and Worsnop, D. R. (2007). Measurements of Morphology Changes of Fractal Soot Particles using Coating and Denuding Experiments: Implications for Optical Absorption and Atmospheric Lifetime. Aerosol Sci. Technol., 41:734–750.
- Stephens, M., Turner, N., and Sandberg, J. (2003). Particle Identification by Laser-Induced Incandescence in a Solid-State Laser Cavity. Appl. Opt., 42:3726–3736.
- Stith, J. L., Twohy, C. H., DeMott, P. J., Baumgardner, D., Campos, T., Gao, R. and Anderson, J. (2011). Observations of Ice Nuclei and Heterogeneous Freezing in a Western Pacific Extratropical Storm. Atmos. Chem. Phys., 11:6229–6243.
- Stockwell, C. E., Yokelson, R. J., Kreidenweis, S. M., Robinson, A. L., DeMott, P. J., Sullivan, R. C., Reardon, J., Ryan, K. C., Griffith, D. W. T. and Stevens, L. (2014). Trace Gas Emissions from Combustion of Peat, Crop Residue, Biofuels, Grasses, and Other Fuels: Configuration and FTIR Component of the Fourth Fire Lab at Missoula Experiment (FLAME-4). Atmos. Chem. Phys. Discuss., 14:10061–10134.
- Subramanian, R., Kok, G. L., Baumgardner, D., Clarke, A., Shinozuka, Y., Campos, T. L., Heizer, C. G., Stephens, B. B., de Foy, B., Voss, P. B. and Zaveri, R. A. (2010). Black Carbon Over Mexico: The Effect Of Atmospheric Transport on Mixing State, Mass Absorption Cross-Section, and BC/CO Ratios. Atmos. Chem. Phys., 10:219–237.
- Sullivan, R. C., Minambres, L., DeMott, P. J., Prenni, A. J., Carrico, C. M., Levin, E. J. T. and Kreidenweis, S. M. (2010). Chemical Processing Does Not Always Impair Heterogeneous Ice Nucleation of Mineral Dust Particles. Geophys. Res. Lett., 37.
- Tobo, Y., DeMott, P. J., Hill, T. C. J., Prenni, A. J., Swoboda-Colberg, N. G., Franc, G. D. and Kreidenweis, S. M. (2014). Organic Matter Matters for Ice Nuclei of Agricultural Soil Origin. Atmos. Chem. Phys., 14:9705–2014.
- Tobo, Y., Prenni, A. J., DeMott, P. J., Huffman, J. A., McCluskey, C. S., Tian, G. X., Pohlker, C., Poschl, U. and Kreidenweis, S. M. (2013). Biological Aerosol Particles as a Key Determinant of Ice Nuclei Populations in a Forest Ecosystem. J. Geophys. Res.-Atmos., 118:10100–10110.
- Twohy, C. H., DeMott, P. J., Pratt, K. A., Subramanian, R., Kok, G. L., Murphy, S. M., Lersch, T., Heymsfield, A. J., Wang, Z., Prather, K. A. and Seinfeld, J. H. (2010). Relationships of Biomass-Burning Aerosols to Ice in Orographic Wave Clouds. J. Atmos. Sci., 67:2437–2450.
- Yokelson, R. J., Christian, T. J., Karl, T. G., and Guenther, A. (2008). The Tropical Forest and Fire Emissions Experiment: Laboratory Fire Measurements and Synthesis of Campaign Data. Atmos. Chem. Phys., 8:3509–3527.