
Abstract
A numerical study was performed of particle capture in the entrance region of a crack, with computational domain consisting of the crack channel and inlet and exit reservoirs that are much larger than the channel width. The simulations examined different mechanisms for particle capture within the channel entrance region, including collision on the inlet reservoir wall just outside the crack channel, collision within the crack channel due to cross-stream inertia imparted by the entrance flow, collision induced by Brownian diffusion both on the inlet reservoir wall outside of the channel and within the channel, and gravitational collision within the channel. A detailed study of the variation of the entrance penetration factor with parameters such as the Stokes, Peclet, and Froude numbers was performed, and comparison of the numerical predictions with different theoretical expressions was made when the latter were available. Validity of the assumption of penetration factor independence was also examined for cases where both entrance region inertia and gravitational settling are significant.
Copyright 2015 American Association for Aerosol Research
1. INTRODUCTION
There are many problems involving transport of a multiphase flow with a discrete (“particulate”) phase flowing through a narrow passage or “crack.” For instance, in a house or building fire, smoke passes between rooms separated by closed doors and into cabinets and chests, ruining contents inside. Cells and particulate matter in microfluidic assays pass from larger reservoirs into narrow microchannels. Atmospheric contaminants, and sometimes even water droplets, are transported into residences and buildings during air passage through leaks in windows or doors. Vulnerable people are often advised to remain indoors during periods of high pollution to limit exposure to atmospheric contaminants. In a nuclear accident, exposure of people residing indoors to radioactive dust is controlled by dust infiltration into residences. Museum artifacts are also affected by dust infiltration rates into buildings or, in case of fire, by smoke infiltration into display cases that are not fully sealed.
There have been a number of experimental studies examining particle infiltration rates in building envelopes, such as dust infiltration through cracks in windows and doors and smoke infiltration through a closed door (Alzona et al. Citation1979; Dockery and Spengler Citation1981; Thatcher and Layton Citation1995; Tung et al. Citation1999). Alzona et al. (Citation1979) examined infiltration of dust (with particle sizes of 0.1–20 μm) originating outside into the interior of a room that was initially cleaned. The study concluded that even after the system was allowed to reach steady-state conditions, the dust concentration is still unequal between the outside and inside of the building (in some cases differing by 30% or more). Studies such as those cited above were conducted in the field with real buildings, and as a consequence the degree to which such studies can address fundamental issues associated with particle filtration during infiltration is limited.
A study of air leakage rates through closed doors, with application to smoke infiltration, was reported by Gross (Citation1990). However, this study considers only fluid flow rate as a function of pressure difference across the door, and it does not examine particle transport through the gap. Liu and Nazaroff (Citation2001) present an analytical study of particle penetration into building envelopes through cracks using empirical estimates for particle capture by Brownian motion and by gravitational settling. The study specifically ignores particle loss due to entrance effects and instead applies an assumption that the crack entrance flow is fully developed and has the same concentration as the outside of the building. Numerous other studies have been conducted of particle motion in straight channels that ignore the entrance effect. For instance, Bhagat et al. (Citation2008) examined the role of lift force on inertial migration of particles in a rectangular channel. Wu et al. (Citation2010) examined the role of electrostatic force on particle trajectory in cylindrical channels. The entrance effect was considered in a computational study of particle transport in a channel by Chen and Korjack (Citation1980), but the computations assumed unidirectional particle and fluid motion at the channel entrance and hence omitted the important effects of lateral particle inertia developed within the inlet reservoir as the particles approach the channel entrance.
An experimental study of particle filtration by gaps was conducted under controlled laboratory conditions by Mosley et al. (Citation2001), in which the passage of flow through a horizontal crack of known size with known pressure differences was measured, along with the particle concentration in the inlet and outlet chambers. The experimental results are compared with a simple model in which an effective penetration factor is determined as the product of a diffusive penetration factor (due to Brownian motion) and a settling penetration factor (due to gravity), which is equivalent to the model of Liu and Nazaroff (Citation2001). The model predictions show that for typical pressure differences over the crack, the net penetration factor is close to unity for a range of intermediate particle diameters (e.g., between 0.1 and 1 μm for a 0.5 mm wide crack). For smaller particle diameters (e.g., between 0.1 and 0.01 μm), the penetration factor gradually reduces to zero because of the effects of Brownian motion. For larger particle diameters (e.g., between 1 and 5 μm), the net penetration gradually decreases to zero due to gravitational settling. However, the experimental data in this latter range consistently exhibit smaller penetration factors than predicted by the model. One reason for this difference could be the fact that the model neglects inertial effects on particle capture, which is particularly an issue in the entrance region as particles pass into the crack channel.
A related application area is the filtration of small particles by a nuclepore filter, which consists of small holes (measuring a few microns in diameter) in a plastic membrane. The filter directly blocks particles with diameter larger than the hole size, but it also captures some fraction of incident particles with diameter significantly smaller than the hole size (Heidam Citation1981). The role of Brownian diffusion leading to particle capture on the face of the filter was examined experimentally by Gentry et al. (Citation1982) and Fan et al. (Citation1978) and modeled using a low Reynolds number analytical solution for the flow approaching the filter hole by Manton (Citation1979). Inertial separation of particles in a nucleopore filter was examined by Manton (Citation1978) using a low Reynolds number numerical approximation for the entrance flow. While some of the physics of nucleopore filter operation is similar to that of particle flow through cracks, there are a number of differences. Specifically, compared to nucleopore filter flow fields, crack leakage flows have much larger ratio of opening width to particle diameter, a largely two-dimensional instead of axisymmetric geometry, flow Reynolds numbers that are larger than unity, non-negligible inertia of inlet particles in common applications, and differences in inlet flow boundary conditions.
The current study examines the effect of the entrance region on capture of particles passing through a rectangular crack. The effect of particle inertia, Brownian motion, and gravitational settling on flow near the entrance region are all examined. We also examine the common assumption that the effects of inertia and gravitational settling can be modeled by multiplying penetration factors, which represent capture due to each effect individually (Liu and Nazaroff Citation2001). The computational approach used employs a finite-volume code to compute two-dimensional fluid flow and a particle dynamics model to compute particle transport within a computational domain consisting of a thin crack and rectangular inlet and outlet reservoirs. The particle dispersion relative to fluid streamlines is dominated by the large streamline curvature at the entrance to the passage, which is particularly acute near the corners where the inlet reservoir meets the crack channel. The drift of particles relative to the fluid streamlines within the entrance flow both modifies the capture of particles near the mouth of the crack and influences the initial distribution of particles at the channel inlet.
The computational methods used are very briefly discussed in Section 2, and a more detailed description is provided as online supplemental information (SI). Section 3 examines the effect of particle inertia (represented by the Stokes number) on particle transport and capture within the entrance region of the crack in the absence of Brownian motion or settling. The effect of Brownian motion on particle capture at the entrance region is examined in Section 4 as a function of Peclet number. The modeling of horizontal crack channels with inertia, Brownian motion, and gravitational settling is examined in Section 5, with particular focus on the question of whether these different effects can be modeled using a product of individual penetration coefficients. Conclusions are given in Section 6.
2. COMPUTATIONAL METHOD
The numerical computations were performed for an incompressible fluid flow carrying particles from an upstream reservoir with pressure , through a two-dimensional gap in a plane wall, and into an outlet reservoir with pressure
. Both the particle concentration and the particle size are sufficiently small that particles are assumed not to influence the fluid flow. A detailed analysis of momentum coupling effects in particulate flow is presented by Crowe et al. (Citation2012), who argue that the one-way coupling assumption is valid when the momentum coupling parameter
is sufficiently small (e.g., less than about 0.05). Here, St is the Stokes number and the mass concentration
is related to the particle and fluid densities and the volume concentration
by
.
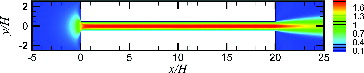
A sample flow field is given in , showing the computational domain and velocity magnitude contours. The width H and length L of the gap channel are held fixed, with . Fluid flow computations were performed for two-dimensional, incompressible, steady-state flow using the CFD program Numeca FINE/Open (version 2.13). Grid independence tests indicate at most 1.1% variation of the pressure difference and a 0.02% difference of the maximum gap channel velocity as the mesh is refined.
FIG. 1. Fluid flow simulation result colored by dimensionless velocity magnitude .
The particle velocity v is computed using a point-particle approach, in which the particle momentum equation is solved as a stochastic differential equation subject to drag, lift, and Brownian forces, given by[1] where
, u is the fluid velocity, d and
are the particle diameter and mass,
is the fluid viscosity,
is the Boltzmann constant, and T is the absolute temperature. Each component of the vector dW is an independent random variable with Gaussian probability distribution having zero mean and variance equal to dt. The lift force
is composed of the sum of the Saffman lift (Saffman Citation1965, Citation1968) and the Magnus lift (Rubinow and Keller Citation1961); detailed equations are given in the SI. Bagchi and Balachandar (2002) showed that the sum of these two lift forces gives a close approximation to the total lift force for an arbitrarily rotating particle. In Section 5, the gravitational force is also included in the particle momentum equation. Particles are intended to represent agglomerates of smoke nanoparticles, with diameters ranging from 100 nm to 10 μm, and the particles are therefore assumed to adhere when they collide with a solid wall. A detailed scaling analysis of the significance of these different forces is given by Marshall and Li (Citation2014) as a function of various dimensionless parameters, such as the Stokes number
and the particle Peclet number
. Here,
is the particle slip magnitude, U is the mean fluid velocity in the gap, and
is the Brownian diffusion coefficient. All results are non-dimensionalized using H and U as length and velocity scales.
3. RESULTS WITH VARIABLE STOKES NUMBER
The crack penetration factor is defined as the ratio of number of particles that exit a crack to the total number of particles entering the crack, for uniform upstream particle concentration. Mechanisms that give rise to particle hold-up within the crack include gravitational settling, Brownian motion, and inertial collision with the walls. The standard approach (Mosley et al. Citation2001) defines a penetration factor for each of these mechanisms, so that the total penetration factor is the product of the individual penetration factors. The entrance penetration factor
is defined as the ratio of the number of particles passing through the entrance region to the total number of particles entering the entrance region, where the entrance region includes the part of the flow just outside and just inside of the entrance within which the particles are strongly influenced by entrance effects.
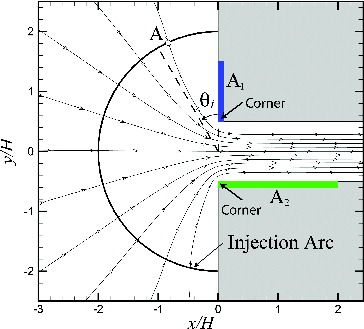
In this section, particles are injected randomly with a uniform probability distribution on a circular arc (called the particle injection arc) in the inlet (upstream) reservoir, spanning from to
, as shown in . The small angular displacement
is used so that the newly injected particles are not touching the side wall of the upstream reservoir. For the present computations, we set
, where
is the radius of the semi-circle in which particles are injected. The particles have initial velocity equal to the local fluid velocity and zero initial angular momentum. The computations determine particle trajectory as a function of angular location on the particle injection arc, yielding the particle capture probability
. The entrance region penetration factor
can be related to
and the inward radial velocity
on the injection arc by (details given in the SI)
[2]
FIG. 2. Crack inlet area with fluid streamlines, showing the particle injection arc (solid semi-circle) and the lines defining (dashed) for a particle A. Also shown are two regions, labeled A1 and A2, in which the particle tends to collide with the wall within the entrance region.
This section examines particle transport within the entrance region for no Brownian motion and for Stokes numbers between 0 and 15 with three different particle diameters, = 0.005, 0.010, and 0.015, and a fixed value of density ratio
(based on smoke particles; Mullholland Citation1995). Three distinct Stokes number ranges were examined: (A) essentially zero Stokes number, (B) low Stokes numbers up to some critical value, and (C) Stokes numbers greater than the critical value. For Stokes number below a critical value and for small values of
, the particles collide with the wall on the outside of the entrance, within the inlet reservoir. For a particle A initiated in the upper part of the domain, this collision region is denoted by region A1 in . When the Stokes number exceeds a critical value, the particle's lateral momentum is sufficient to allow it to cross over the channel and collide with the opposing channel wall, which for particle A is denoted by region A2 in .
For a uniform crack located on a flat wall, fluid is funneled into the crack from all directions. Streamlines initiating near the reservoir wall get progressively closer to the wall as they approach the crack inlet. If the Stokes number is zero, so that particles follow fluid streamlines exactly, a particle will collide with the wall when the shortest distance between the streamline and the wall becomes less than the particle radius, resulting in particle adhesion just outside of the crack inlet. At zero Stokes number, the fluid flow streamlines can be used to determine whether particles will collide with the wall for different values of the particle injection angle , defined as the angle between the vertical wall of the inlet reservoir and a line passing through the particle center at the time of initial injection and the center of the channel at the entrance (). The maximum value of
that a particle can have in order to hit the wall at zero Stokes number,
, corresponds to particle collision at the corner of the crack inlet, so that
if
and
if
.
At finite Stokes number, particle inertia causes the particle pathlines to deviate from the fluid streamlines. Due to the streamline curvature as the flow passes around the inlet corner, particles drift away from the corner as they travel toward the crack inlet, thus decreasing the number of particles that hit the wall. A plot of as a function of Stokes number is given in a, where all particles with
collide with the reservoir wall outside of the crack. b shows the entrance region penetration factor as a function of Stokes number for this “low Stokes number regime.” The value of
increases with increase in Stokes number due to particle drift away from the wall associated with streamline curvature. Since the value of
is very close to unity within this low Stokes number regime, with values above 0.9975 for all cases examined, deposition of particles on the inlet reservoir wall outside of the crack is of negligible importance in the absence of Brownian motion.
FIG. 3. Plots showing (a) maximum collision angle for particle collision and (b) entrance region penetration factor
as functions of Stokes number for the low Stokes number regime, with
of 0.005 (solid line with circles), 0.010 (dashed line with triangles), and 0.015 (dash-dotted line with squares).
When the Stokes number exceeds a critical value, a “high Stokes number regime” of particle capture occurs in which the particle inertia carries the particles across the channel within the entrance region and the particles collide with the wall on the opposing side of the channel (i.e., in region in ). For the
values examined, the critical Stokes number occurred at Stcrit = 1.05 ± 0.01. While some particle collisions on the inlet reservoir wall continued to occur after the critical Stokes number was passed, the number of collisions was low and continued to decrease as Stokes number increased. The maximum value,
, of
, beyond which particles do not collide with the channel wall is plotted in a as a function of Stokes number. For
, there is a peak
of around 65° at a Stokes number of 5. For
of 0.010 and 0.015, the peak occurs around a Stokes number of 10 with peak values of 66° and 68°, respectively. A plot of the entrance penetration factor
as a function of Stokes number in the high St regime is given in b. A rapid change in the value of
occurs between Stokes numbers of 1 and about 3, where the penetration factor decreases from approximately unity at St = 1 to a value of about 0.28 at St = 3. As the Stokes number increases further the value of
in b decreases slowly, until it reaches a minimum value of 0.25 at St = 7. For higher Stokes numbers, the value of
increases very gradually. The ability of the penetration factor to level out at high Stokes numbers, and then to increase slightly with increase in St, is due to the effect of lift force on the particles. This statement was confirmed by repeating the computation with lift force turned off, yielding the dashed curve in b, which exhibits the expected monotonic decrease of the penetration factor with Stokes number. The observation that up to 75% of the particles can collide with and be captured by the channel wall as a consequence of entrance effects for Stokes numbers above about 3 is a significant finding, which demonstrates the importance of entrance effects in particle passage through cracks at sufficiently high Stokes numbers.
FIG. 4. Plots showing (a) maximum collision angle for particle collision and (b) entrance region penetration factor
as functions of Stokes number for the high Stokes number regime, with
of 0.005 (solid line with circles), 0.010 (dashed line with triangles), and 0.015 (dash-dotted line with squares). Results for computations with no lift force are drawn using a dashed line in (b).
For all particles that impacted the inside walls of the crack, the distance between the collision location and the corner was monitored. The ratio of this distance with the channel width H is denoted by . A series of
bins were formed along the channel surface, and the number of particles colliding in each bin was counted during the computations. Dividing this number of collisions in each bin by the total number of injected particles and normalizing by bin length yields a collision distribution function
, which is plotted with
bins as a function of bin center location in a for a computation with
and four different values of the Stokes number. The particle collision distribution has a strong one-sided structure, with the vast majority of particles impacting close to the leading edge the channel. The highest number of particle collisions coincides with a minimum value of
, which changes as a function of Stokes number, and for values of
less than this minimum value the collision number drops to nearly zero.
FIG. 5. Plots showing (a) the distribution of particle capture fraction, , as a function of distance
to the corner and (b) collision distance to the corner as a function of particle injection angle
for
. The calculations are performed with 100 bins, each of width
. In (a), the Stokes numbers are 2 (A, red line), 5 (B, green line), 10 (C, blue line), and 15 (D, magenta line). In (b), the Stokes numbers are 1.1 (curve A), 1.5 (curve B), 2.0 (curve C), 3.0 (curve D), 5.0 (curve E), and 15.0 (curve F).
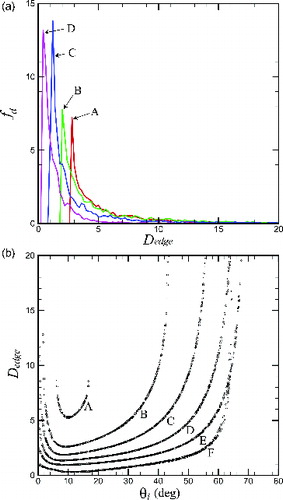
A plot of as a function of the particle injection angle
is given in b for a case with
and different values of the Stokes number. This plot is unusual in that there appears to be two values of
that lead to particle collision on the channel wall at the same value of
. The minimum value of
corresponds to a critical injection angle value
, which varies as a function of Stokes number. The phenomenon noted above occurs as a consequence of boundary layer effects. In particular, for very small values of
, the particle is close to the surface of the inlet reservoir and the fluid velocity within this boundary layer region is small. As a consequence, the particle has weak inertia as it approaches the channel corner. Even though the particle velocity is oriented directly toward the opposing wall of the channel when it moves past the corner, the particle lacks sufficient momentum to cross the channel. In the opposite extreme of large values of
, particles are well outside of the boundary layer and have large momentum. However, in this case the particle velocity is primarily oriented down the channel, so the incident particles have little lateral inertia and are also unable to cross the channel to collide on the channel wall. Somewhere between these two extremes, there exists a value
for which the particle is outside of the boundary layer (and hence has high momentum) and also has a trajectory with significant lateral velocity component, for which the net lateral momentum is a maximum and particles collide with the channel wall at the minimum value of
.
4. RESULTS WITH VARIABLE PECLET NUMBER
Brownian motion forces can have significant effect on particle penetration into a crack at low values of the particle Peclet number , causing deposition of particles both on the inlet reservoir wall outside of the crack and within the crack channel. Since the particle slip velocity
varies with time for each particle, the particle Peclet number is time-varying, and therefore not a good measure by which to quantify the flow field. A flow Peclet number can be defined as
, which is constant for the flow field. For small Stokes numbers, the particle slip velocity has the order of magnitude
(Marshall and Li Citation2014), so the flow and particle Peclet numbers are related by
[3]
Since the ratio of the Brownian force to the drag force varies as (Marshall and Li Citation2014), it is useful to plot the flow results in terms of a “Peclet coefficient”
, defined by
[4] which is constant in time and of the same order of magnitude as the particle Peclet number.
A series of simulations was performed to examine the effect of Brownian motion on capture of particles within the entrance region, for which we set and
. The ratio of
was selected to vary from 0.15 to 14, which yields values of the Peclet coefficient
between 0.005 and 50. The injection arc is divided into 100 segments from 0° to 90°, and 100 particles are injected at the center of each segment of the injection arc. Since the Brownian forces involve motion of the particles under a random force, the fate of each particle is tracked to develop collision probabilities for each segment of the injection arc. Computations with small values of
yield significant numbers of particle collisions both outside the crack and within the crack channel.
For the case of collisions on the inlet reservoir wall outside of the crack, the collision probability and penetration factor are plotted in . The random Brownian motion allows particles to collide with the inlet reservoir when collision would not otherwise occur. For instance, with no Brownian motion it was found that for this value of St and
, whereas with Brownian motion (with
) the probability of particle capture is as high as 10% for
. For computations at small values of
, the penetration factor can be significantly reduced by collision of particles outside of the crack. For instance, for
the value of entrance penetration factor was 0.86, indicating that about 14% of the particles are captured before they enter into the crack channel. As the Peclet coefficient increases to about unity or greater, this effect becomes almost negligible and the entrance penetration factor approaches unity.
FIG. 6. Plots of the (a) collision probability and (b) penetration factor for particles colliding with the inlet reservoir wall outside of the crack, for cases with (circles and solid line),
(triangles and dashed line),
(squares and dash-dotted line),
(diamonds and long dash line), and
(upside-down triangles and dash-dot-dot line). Curve fits in (a) are 10th-order polynomials.
The particle capture probability and penetration factor for deposition within the crack channel are plotted in . The capture probability is observed to have a maximum value at a finite value of
, which increases with
, until for
the maximum occurs at
. The reason for this behavior is that particles with small values of
tend to collide with the wall of the inlet reservoir outside of the crack channel, and so never pass into the crack. The penetration factor associated with Brownian diffusion inside the crack channel, denoted by
, is compared in b with the theoretical prediction of Lee and Gieseke (Citation1980) as
[5]
FIG. 7. Plots for particles colliding within the crack channel showing (a) collision probability for cases with (circles and solid line),
(triangles and dashed line),
(squares and dash-dotted line),
(diamonds and long dash line), and
(upside-down triangles and dash-dot-dot line), and (b) penetration factor for fluid Peclet numbers of Pef = 50 (A, circles), Pef = 500 (B, triangles), and Pef = 5000 (C, squares). The theoretical prediction of Lee and Gieseke (Citation1980) is indicated in (b) by dashed lines.
The numerical predictions in b are well fit by exponential curves. The numerical simulations are very close to the theoretical prediction for the two highest values of Peclet number considered, but for the case with the lowest value of Peclet number the theoretical prediction was somewhat lower than the numerical data.
One of the key assumptions used by Lee and Gieseke (Citation1980) is that the particle concentration distribution follows the equation
[6] where
is the distance down the channel,
is the distance across the channel, and
is the channel center-line particle concentration. Comparisons between (6) and the particle concentration profiles obtained from the particle transport simulations are shown in for two values of the Peclet coefficient. The concentration profiles are generated by counting the number of particles to pass through each of 100 different bins spanning the channel and then dividing by the total number of particles to pass through the channel cross-section and normalizing by bin size. This procedure yields a normalized concentration value
, where
is the average particle concentration across the channel. The concentration distribution at the entrance (
) is quite different from the expression (6) for all of the cases, but by
and at locations further downstream the concentration profiles agree reasonably well with (6) for the highest Peclet coefficient case. The concentration profiles for the lowest Peclet coefficient case exhibit a greater difference with the form (6) assumed by Lee and Gieseke (Citation1980) even at the downstream locations, which likely explains the difference with the numerical predictions for penetration factor observed in b.
FIG. 8. Profiles of the particle concentration at different distances along the channel for fluid Peclet numbers of (a) Pef = 50 and (b) Pef = 5000. The dashed line represents the concentration profile given by Equation (20), as assumed by Lee and Gieseke (Citation1980). Profiles were taken at distances of zero (filled circles),
(open triangles),
(open squares), and
(asterisks) from the channel entrance. Values are normalized by the number of particles entering the channel as well as the bin size.
5. EXAMINATION OF PENETRATION FACTOR INDEPENDENCE
An expression for the penetration factor due to gravitational settling, , was derived by Fuchs (Citation1964) assuming uniform flow in the channel and uniform inlet particle concentration profile, which gives
[7] where
is the terminal particle settling velocity and the Froude number is defined by
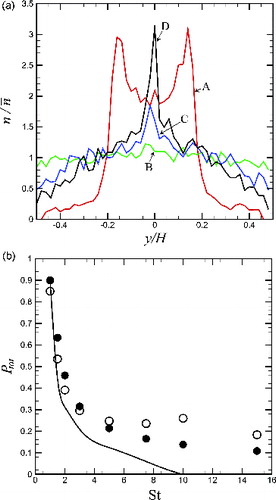
. For simulations at moderate to high values of the Stokes number, entrance effects can significantly modify the particle concentration distribution at the channel inlet, which leads to a nonlinear interaction between the entrance effects and the gravitational capture of the particles in the channel. To illustrate this effect, profiles of the normalized particle concentration
are shown in a for a moderate Stokes number of 2. These profiles demonstrate clearly that the concentration field is far from uniform. At the crack inlet, the profile exhibits two strong peaks on either side of the centerline. By a distance of
, the profile has become nearly flat, but then as the particles progress down the channel the concentration peaks near the centerline, which likely occurs as a response to lift forces associated with shear flow in the channel.
FIG. 9. (a) Profiles of the particle concentration at a Stokes number of 2.0, evaluated at distances from the channel entrance of zero (A, red line),
(B, green line),
(C, blue line), and
(D, black line). (b) Plot showing total penetration factor
as a function of Stokes number with Fr = 10. Open symbols denote numerical results with lift force included, filled symbols denote numerical results without lift force included, and the solid line denotes the result
obtained by the assumption of penetration factor independence.
A common practice in particle infiltration studies is to multiply the different penetration factors together to obtain the total penetration factor for the crack system (Mosley et al. Citation2001), which is based on the assumption that the different penetration factors are independent of each other. The fact that particle inertial effects within the entrance region can lead to highly non-uniform concentration profiles at moderate Stokes number values can lead to breakdown of the penetration factor independence assumption. The validity of the assumption of penetration factor independence was examined by performing a series of simulations for particle passage through the entrance region and channel with the gravitational force included for different values of Stokes and Froude numbers. Computations are performed for Stokes numbers between 0 and 15 and for a range of Froude numbers. The total computed penetration factor from these computations is compared in b with the product of the entrance region penetration factor
obtained previously for simulations with no gravity (b) and the theoretical expression (7) for the gravitational penetration factor
. The expression
, indicated by a solid line in b, indicates the total penetration factor in the limit in which
and
are independent, so that
can be computed with no gravity and
can be computed without accounting for particle entrance or inertial effects. Each computation shown in b was performed twice, once with lift force included (open symbols) and once without lift force (filled symbols). In the lower portion of the channel, lift force counteracts gravitational force by pushing particles upward toward the channel center.
Results for lower values of Stokes number yield values of close to unity, for which case the total penetration factor is dominated by gravitational settling. As the Stokes number increases, the values of both
and
decrease and become more comparable to each other. In these cases, with
values between about 0.7 and 0.3, the penetration factor independence formula
results in a significantly lower value of the total penetration factor than observed from the full numerical simulations. As the Stokes number exceeds some critical value that depends on the Froude number and the channel length to width ratio, the value of
in (7) decreases to zero, so that the product
yields a zero value of the total penetration factor. However, the numerical computations continue to result in a finite value of the total penetration factor (of about 0.2) for these cases. This observation also applies for computations performed without lift force, only in this case the total penetration factor decreases gradually with Stokes number even at high values of the Stokes number (b). This difference appears to result from the cross-stream inertia that is imparted on the particles within the entrance region, which leads to the two peaks in the concentration profile at the channel entrance shown in a. Particles starting in the upper region of the inlet reservoir will quickly hit the bottom side of the channel due to the combination of particle inertia and gravity. However, particles starting in the lower region of the inlet reservoir will have vertical inertia that opposes the gravitational settling, which delays the time required for the particles to settle to the channel bottom surface.
6. CONCLUSIONS
A numerical study of particle collision and capture in the entrance region of a channel was performed for a computational domain that included the inlet reservoir, the channel, and the outlet reservoir. Different mechanisms of particle collision and capture within the entrance region were observed, depending on the values of the Stokes, Peclet, and Froude numbers. Some of these mechanisms resulted only in a small depletion of the total number of particles passing through the channel, whereas other mechanisms result in removal of a large percentage of the total particles. Collision of particles along the inlet channel wall just outside of the channel results in removal of only very few particles, and the number of particles captured via this mechanism decreased as the Stokes number increased, until the number vanished for a Stokes number of approximately unity. For high Stokes number, the dominant particle capture mechanism was the collision of particles on the opposing channel wall, caused by the particle lateral inertia generated by the flow approaching the entrance region. This inertial particle deposition mechanism was not included in previous studies of entrance region particle capture (e.g., Chen and Korjack Citation1980), which do not include the inlet reservoir in the computational domain. For low values of the Peclet number, significant amount of particle deposition occurred on the inlet reservoir wall just outside of the channel entrance due to the diffusive motion of the particles. Within the channel, the diffusive particle settling due to Brownian motion agreed reasonably well with the theory of Lee and Gieseke (Citation1980).
A set of computations was also performed to investigate the assumption of penetration factor independence, which is commonly used to express the total penetration factor as a product of penetration factors associated with different effects, such as gravitational settling, Brownian motion, entrance region inertia, etc. If only gravitational settling and Brownian diffusion are considered, this assumption is always well satisfied since the Brownian penetration factor is very close to unity whenever the gravitational penetration factor is significantly less than unity, and vice versa. If entrance region effects are also considered, the situation is more complex. Specifically, we find that the assumption of penetration factor independence is well satisfied for problems with low Stokes and Peclet numbers, which are dominated by Brownian diffusion. For such cases, the total penetration factor can be written as the product of the entrance region penetration factor (due to particle deposition on the inlet reservoir wall immediately outside the channel) and the Brownian penetration factor (due to particle deposition inside the channel) with high accuracy. For cases with Stokes number of order unity or higher, the flow is controlled both by particle inertia within the entrance region and by gravitational settling. The penetration factor independence assumption in such cases is found to substantially under-predict the total penetration factor. Indeed, many cases are noted in which the penetration factor independence assumption would yield zero total penetration factor, whereas direct computation yields penetration factors of between 0.15 and 0.20, where the difference can be attributed in part to inertial effects within the entrance region.
The current study shows that entrance effects can often have a significant influence on the penetration of particles through a crack. Entrance effects often increase the number of particles captured, resulting in a decrease in the penetration factor compared to what would be calculated without consideration of entrance effects. However, the effects of particle inertia within the entrance region on the particle concentration distribution within the channel can also give rise to nonlinear interaction of the particle deposition phenomena, resulting in some cases in an overall decrease in particle capture, with associated increase in the penetration factor. For these reasons, it is important to include entrance effects in determination of the total penetration factor for particle infiltration studies, particularly for cases with Stokes number equal to unity or greater.
SUPPLEMENTAL MATERIAL
Supplemental data for this article can be accessed on the publisher's website.
UAST_1009531_Supplemental_Information.zip
Download Zip (28.9 KB)Funding
This work was funded by the U.S. National Center for Preservation Technology and Training, an office of the National Park Service, under grant P11AC71049, and by the U.S. National Science Foundation under grants CBET-1332472 and DGE-1144388.
REFERENCES
- Alzona, J., Cohen, B. L., Ruolph, H., Jow, H. N., and Frohliger, J. O. (1979). Indoor-Outdoor Relationships for Airborne Particulate Matter of Outdoor Origin. Atmos. Environ., 13:55–60.
- Bagchi, P., and Balachandar, S. (2002). Effect of Free Rotation on the Motion of a Solid Sphere in Linear Shear Flow at Moderate Re. Phys. Fluids, 14(8):2719–2737.
- Bhagat, A. A. S., Kuntaegowdanahalli, S. S., and Papautsky, I. (2008). Enhance Particle Filtration in Straight Microchannels Using Shear-Modulated Inertial Migration. Phys. Fluids, 20:101702.
- Chen, R. Y., and Korjack, T. A. (1980). Deposition of Suspensions in the Entrance Region of a Vertical Channel. Powder Technol., 25:121–124.
- Crowe, C. T., Schwarzkfeld, J. D, Sommerfeld, M., and Tsuji, Y., (2012). Multiphase Flows with Droplets and Particles. 2nd ed., CRC Press, Boca Raton, pp. 33–34.
- Dockery, D. W., and Spengler, J. D. (1981). Indoor-Outdoor Relationships of Respirable Sulfates and Particles. Atmos. Environ., 15:335–343.
- Fan, K. C., Leaseburge, C., Hyun, Y., and Gentry, J. (1978). Clogging in Nucleopore Filters: Cap Formation Model. Atmos. Environ., 12:1797–1802.
- Fuchs, C. N. (1964). The Mechanics of Aerosols. Pergamon Press, Oxford.
- Gentry, J. W., Spurny, K. R., and Schoermann, J. (1982). Diffusional Deposition of Ultrafine Aerosols on Nucleopore Filters. Atmos. Environ., 16(1):25–40.
- Gross, D. (1990). Estimating Air Leakage Through Doors for Smoke Control. Fire Technol., 26:75–81.
- Heidam, N. Z. (1981). Review: Aerosol Fractionation by Sequential Filtration with Nucleopore Filters. Atmos. Environ., 15(6):891–904.
- Lee, K. W., and Gieseke, J. A. (1980). Simplified Calculation of Aerosol Penetration Through Channels and Tubes. Atmos. Environ., 14:1089–1094.
- Liu, D. L., and Nazaroff, W. W. (2001). Modeling Pollutant Penetration Across Building Envelopes. Atmos. Environ., 35:4451–4462.
- Manton, M. J. (1978). The Impaction of Aerosols on a Nucleopore Filter. Atmos. Environ., 12:1669–1675.
- Manton, M. J. (1979). Brownian Diffusion of Aerosols to the Face of a Nucleopore Filter. Atmos. Environ., 13:525–531.
- Marshall, J. S., and Li, S. (2014). Adhesive Particle Flow: A Discrete Element Approach. Cambridge University Press, New York.
- Mosley, R. B., Greenwell, D. J., Sparks, L. E., Guo, Z., Tucker, W. G., Fortmann, R., et al.(2001). Penetration of Ambient Fine Particles into the Indoor Environment. Aerosol Sci. Technol., 34(1):127–136.
- Mullholland, G. W. (1995). Smoke Production and Properties, in SFPE Handbook of Fire Protection Engineering, 2nd ed., DiNenno, P. J., et al., eds., Society for Fire Protection Engineers, Bethesda, Maryland, Chapter 15, pp. 2–217–2-227.
- Rubinow, S. I., and Keller, J. B. (1961). The Transverse Force on a Spinning Sphere Moving in a Viscous Fluid. J. Fluid Mech., 11:447–459.
- Saffman, P. G. (1965). The Lift on a Small Sphere in a Slow Shear Flow. J. Fluid Mech., 22:385–400.
- Saffman, P. G. (1968). Corrigendum to ‘The lift force on a small sphere in a slow shear flow’. J. Fluid Mech., 31:624.
- Thatcher, T. L., and Layton, D. W. (1995). Deposition, Resuspension, and Penetration of Particles Within a Residence. Atmos. Environ., 29:1487–1497.
- Tung, T. C. W., Chao, C. Y. H., and Burnett, J. (1999). A Methodology to Investigate the Particulate Penetration Coefficient Through Building Shell. Atmos. Environ., 33:881–893.
- Wu, M., Kuznetsov, A. V., and Jasper, W. J. (2010). Modeling of Particle Trajectories in an Electrostatically Charged Channel. Phys. Fluids., 22:043301.