
Abstract
The present work focuses on the effect of waste cooking oil biodiesel on the particulate mass, number concentration, nanostructure, and oxidative reactivity under different engine speeds and engine loads. Particulate samples were collected from the diluted exhaust of a medium-duty direct injection diesel engine and were used to analyze the physico-chemical properties via the transmission electron microscope (TEM) and the thermogravimetric analyzer/differential scanning calorimeter (TGA/DSC). The TEM images reveal that smaller primary particles are formed at higher engine speed, lower engine load, or using biodiesel. Quantitative analysis of the nanostructures indicates more soot with more disordered configuration, in which shorter and more curved graphene layer is prevailing at lower engine load or when using biodiesel. Furthermore, the TGA results infer that the soot oxidative reactivity is closely related to the nanostructure properties and the effect of engine load is more pronounced than the effect of engine speed. Also biodiesel soot has faster oxidative reactivity than diesel soot. Moreover, results obtained for B30 (30% biodiesel and 70% diesel fuel) lie in between those for biodiesel and diesel fuel.
Copyright 2015 American Association for Aerosol Research
1. INTRODUCTION
In the last few decades, alternative fuels have been investigated for partial or total replacement of diesel fuel for reducing air pollution and reducing reliance on fossil fuel. Among these alternatives, biodiesel has received particular attention. It has been mixed with diesel fuel for sale in the market and the amount of biodiesel allowed to be mixed with diesel fuel for sale is increasing. Biodiesel is a renewable fuel, which has the potential of reducing greenhouse gas emissions and inhibiting polycyclic aromatic hydrocarbon (PAH) and soot formation (Demirbas Citation2008; Arvidsson et al. Citation2012). Furthermore, due to its similar physical properties to diesel fuel, biodiesel can be directly used in a diesel engine without the need of modifying the engine. Consequently, extensive studies have been conducted on diesel engines fueled with biodiesel or biodiesel/diesel blends (Kulkarni and Dalai Citation2006; Agarwal Citation2007; Demirbas Citation2007; Lapuerta et al. Citation2008b; Agarwal et al. Citation2011; Xue et al. Citation2011). It is commonly found that particulate mass (PM), carbon monoxide (CO), and total hydrocarbons (THC) are reduced while nitrogen oxides (NOx) increased in comparison with operation on diesel fuel. However, there is little research on the influence of biodiesel on the physico-chemical properties of the particulate emitted by a diesel engine upon using biodiesel or biodiesel-diesel blended fuels.
A few studies have been carried out on quantifying the internal nanostructure and oxidation properties of biodiesel soot (Song et al. Citation2006; Lapuerta et al. Citation2012; Lu et al. Citation2012b; Salamanca et al. Citation2012a,Citationb; Yehliu et al. Citation2012). Lu et al. (Citation2012b) investigated the oxidation of particulate emitted by a DI diesel engine fueled with three fuels, including neat biodiesel produced from waste cooking oil, under different engine loads. Song et al. (Citation2006) studied the oxidation behavior of biodiesel soot with thermogravimetric analyzer (TGA) and electron energy loss spectra (EELS), using a soybean biodiesel and a blended fuel containing 20% biodiesel mixed with 80% diesel fuel. Biodiesel (B100) soot was found to be far more reactive than diesel soot, and it underwent a unique oxidation process leading to capsule-type oxidation and eventual formation of graphene ribbon structures. Recently, Salamanca et al. (Citation2012b) investigated the variations in the chemical composition and morphology of soot induced by two neat biodiesel fuels, palm oil biodiesel and linseed biodiesel, and their 50% blends, with various techniques, including TGA, Raman spectroscopy analysis, and energy dispersive X-ray analysis. From a morphological point of view, all the results showed that neat biodiesel does not affect significantly the size of the particulate matter emitted. However, soot particles produced by neat biodiesel are more carbonized or have a graphite-like (less amorphous) structure than diesel particles. Salamanca et al. (Citation2012a) also studied the influence on the chemical composition of the particulate matter produced in an automotive diesel engine operated with palm oil biodiesel and its blend with diesel fuel. Lapuerta et al. (Citation2012) used an automotive diesel engine to compare the effect of diesel fuel and an animal fat-derived biodiesel on the soot nanostructure and on loading and regeneration of diesel particulate filters. Transmission electron microscope (TEM) analysis of the agglomerates showed that soot primary particles obtained with biodiesel fuel were significantly smaller and had a higher specific active surface than those of diesel soot. Yehliu et al. (Citation2012) focused on the impact of fuel on soot reactivity and nanostructure, using ultra-low-sulfur diesel (ULSD), soybean biodiesel, and synthetic Fischer–Tropsch fuel, and applied TGA, X-ray photoelectron spectroscopy (XPS), and X-ray diffraction (XRD) techniques in the investigation. They concluded that the soot oxidative reactivity is dominated by the degree of disorder of the carbonaceous nanostructure, not by the abundance of surface oxygen content. The above investigations provide information on the particulate physico-chemical properties but did not consider the influence of engine operating conditions (speed and load) on the physico-chemical properties of the particulate.
The influence of engine operating conditions on the physico-chemical properties of particulates emitted by a diesel engine has been reported in Lee et al. (Citation2001), Zhu et al. (Citation2005), Neer and Koylu (Citation2006), and Lapuerta et al. (Citation2007), using mainly diesel fuel in the investigations. Lee et al. (Citation2001) and Zhu et al. (Citation2005) found that the size of primary particles decreased both in heavy-duty and light-duty engines, as the exhaust temperature increased, while Neer and Koylu (Citation2006) and Lapuerta et al. (Citation2007) reported opposite results. As far as the nanostructure is concerned, in general, particulates appeared to be amorphous at low engine loads, while graphitic structures were observed at high engine loads (Lee et al. Citation2001; Zhu et al. Citation2005). Lu et al. (Citation2012a) investigated effects of engine operating conditions on the size and nanostructure of diesel particles using diesel fuel. They reported that particles exhibit a disordered structure at low engine load and high engine speed due to lower in-cylinder gas temperatures and shorter combustion duration. Yehliu et al. (Citation2013) investigated the effect of engine operating conditions, which included two engine speeds and two engine loads, and combustion phasing on the nanostructure and reactivity of diesel soot. Their results indicated that the combined effect of engine load and speed results in different soot reactivity. The impact of engine speed at constant torque is more pronounced than the effect of engine load at constant speed.
The above literature review shows that there is lack of investigation on the influence of engine speed and engine load on the oxidation properties and nanostructure of particulate matter when using waste cooking oil biodiesel and diesel/biodiesel blended fuel. To fill in this knowledge gap, in this study, biodiesel derived from waste cooking oil, pure diesel, and the B30 (30% biodiesel in diesel) are investigated for the influence of both engine speed and engine load on the physico-chemical properties of the particles, which includes particle mass and number concentrations, primary particle size, nanostructure and oxidation reactivity as well as the relating combustion parameters.
2. EXPERIMENTAL APPROACH
The experimental setup is shown in . Particulates were sampled from the exhaust of a pre-Euro naturally aspirated, water-cooled, 4-cylinder direct-injection diesel engine (ISUZU 4HF1). Specifications of the engine are shown in Table S1 in the online supplementary information (SI). The engine was coupled with an eddy-current dynamometer and a control system (Ono Sokki system, Ono Sokki Co., Ltd.) was used for adjusting the engine speed and torque. The biodiesel used in the present study was manufactured from waste cooking oil by Dynamic Progress Ltd., complying with EN14214. The composition of the biodiesel was analyzed and the results are shown in . The fatty acid methyl esters (FAMEs) were measured using Agilent GC 7890A with FID and Supelco SP-2560 column, with each FAME calibrated against C11 signal, which was complied with the gas chromatographic analysis as stated in the AOAC Official Method 996.06. The biodiesel contains mainly methyl palmitate (11.46%), methyl oleate (35.22%), and methyl linoleate (39.73%), which is very close to the major FAMEs in the waste cooking oil biodiesel used in Lapuerta et al. (Citation2008c) and in Armas et al. (Citation2006).
TABLE 1 Composition of fatty acids in w aste cooking oil biodiesel
FIG. 1. Schematic diagram of the experimental setup.
The diesel fuel was purchased from a local filling station. It is a ULSD fuel, containing less than 10-ppm-wt sulfur. Selected properties of the test fuels are shown in Table S2 in the SI. The lower heating values of diesel fuel and biodiesel were determined with bomb calorimeter. The densities of the fuels were measured in situ at 20°C. Other properties of the fuels were obtained either from the literature or from fuel specifications. For example, percentage of C/H/O was evaluated by assuming a typical biodiesel composition of C18.96H35.64O2 (Sgroi et al. Citation2005). The percentage of C, H, and O calculated from the typical composition is very close to those reported in Lapuerta et al. (Citation2008a,Citationb).
The engine was tested under five operating modes to investigate the effect of engine speed and engine load (air/fuel ratio) on the particulate properties. Details of each operating mode, including the air/fuel ratio and exhaust gas temperature, are listed in . In this article, the air fuel ratio was calculated based on the method of Bresenham et al. (Citation1998). For modes 1–3, the engine was operated at a high engine load, corresponding to 80% of the full load, under engine speeds of 1280, 2560, and 1920 rpm. These three modes have slightly different air/fuel ratios. For modes 3–5, the engine was operated at the constant engine speed of 1920 rpm with difference engine loads of 224, 112, and 56 Nm, leading to very different air/fuel ratios. All the tests were carried out at steady-state operating conditions. Experimental data and particulate samples were recorded and collected for analysis after the exhaust gas temperature, the cooling water temperature, and the lubricating oil temperature have attained steady-state values.
TABLE 2 Engine test conditions
Particulate mass concentration was measured with a tapered element oscillating microbalance (R&P TEOM 1105) while particulate size distribution and number concentration was measured with a scanning mobility particle sizer (SMPS, TSI, Inc.), which consists of a TSI 3071A differential mobility analyzer (DMA) and a TSI 3022 condensation particle counter (CPC). The exhaust gas from the engine was diluted with a two-stage Dekati mini-diluter before passing through the TEOM and the SMPS. The dilution ratios were determined from the measured CO2 concentrations of background air, undiluted exhaust gas, and diluted exhaust gas. CO2 concentrations were measured with a nondispersive infra-red detector (NDIR, CAI, Model 300). The measured dilution ratio varied from 5.5 to 8.5 depending on the actual engine operating conditions for the first-stage dilution. The second-stage diluter provides a steady dilution ratio of 8 and keeps the sampling gas temperature under 52°C. The TEOM and SMPS received exhaust gas after the first-stage diluter and the second-stage dilutor, respectively. PM mass concentration was continuously measured for 5 min and the average results are presented. Each experiment was repeated twice and the results were found to agree with each other within 5% of the mean value. For particulate size distributions and number concentrations, four scans were conducted for each operating condition and each scan takes 150 s. The average results are presented.
Particulate samples for physico-chemical analyses were collected on 47 mm quartz fiber filter papers (ADVANTEC Corporation) under the same conditions as the TEOM. The sampling flow rate through the filter holder was 15 l/min and the sampling time was depended on the actual engine operating mode (e.g., around 10 min for 1920 rpm, 80% engine load). A high-resolution transmission electron microscope (HRTEM; Tecnai G2 20 S-TWIN Philips) was used to investigate primary particle size and nanostructure. The maximum magnification of HRTEM is up to 910,000× with a resolution of about 0.2 nm. For TEM analysis, the collected samples were further prepared with carbon-copper grid by the extraction methods described in Vander Wal and Mueller (Citation2006). This extraction method might cause a slight decrease in primary particle size due to the loss of some water soluble substances into the solution. But Lu et al. (Citation2012a) compared this extraction method with the direct method, in which the particles were collected directly on the copper grid, and showed the deviation of 1–2 nm in primary particle size between the two methods is minor.
The TEM and HRTEM images were analyzed using the commercial image processing software Image-Pro Plus 6.0 (Media Cybernetic). From the TEM images, the diameter (Dp) of a particle with a clear boundary can be measured with this software. The nanostructure of a primary particle can be described by three parameters, namely, fringe length (La), tortuosity (Tf), and separation distance (Ds). To deter these parameters, a series of processes was conducted on the HRTEM images, following the method described in Yehliu et al. (Citation2011). For an HRTEM image, a region with clear graphene fringes was chosen and converted into a two-phase (black and white) image and then further processed by progressively eroding the periphery of each fringe to a one-pixel width. For each operating mode, 10 TEM images were selected randomly to measure the primary particle diameter and more than 500 primary particles were taken into account, while 25–30 HRTEM images of different primary particles were analyzed for their nanostructure parameters. The same measurements were repeated two or three times to ensure that the results were repeatable.
The collected samples were also used to investigate the particulate composition and oxidation properties through thermogravimetric analysis (TGA). TGA was conducted using the Netzch STA 449 TGA/DSC (thermogravimetric analyzer/differential scanning calorimetry) with Al2O3 crucible. The particulate sample was heated in argon until the temperature in the TGA reached 400°C to remove the volatile substances. The oxidation atmosphere was then changed to air and heated up to 850°C for the investigation of soot oxidation. Detailed heating program is shown in Table S3 in the SI.
3. RESULTS AND DISCUSSIONS
3.1. Particulate Mass and Number Concentration
For both particulate mass concentration and particulate number-size distribution, the results presented have been corrected back to exhaust concentrations using the corresponding dilution ratios. For particulate mass concentration (PMC), the results are listed in for each test mode. Generally, using biodiesel produces lower PMC compared to using diesel fuel. This is mainly due to two reasons: the oxygen content in biodiesel can improve the combustion and further oxidize the generated particles; and the addition of biodiesel reduces the aromatics levels, which are soot precursors, in the fuel (Spreen et al. Citation1995; Mueller et al. Citation2003; Lapuerta et al. Citation2008b). Dec (Citation1997) proposed a conceptual model of direct injection diesel combustion, which indicated the generation of soot in locally fuel-rich premixed air-fuel mixtures in a fuel jet and the subsequent oxidation of soot in the periphery of the fuel jet. Biodiesel produces less soot than diesel fuel owing to the higher level of oxygen in the fuel. Lapuerta et al. (Citation2008a) concluded that the oxygen content of the biodiesel molecule enables more complete combustion even in regions of the combustion chamber with fuel-rich flames and promotes the oxidation of the already formed soot. Mueller et al. (Citation2003) also suggested that fuel oxygenation can be more effective at reducing in-cylinder soot than enhancing oxygen entrainment, with careful oxygenate selection. The effect of aromatics on soot formation has been reviewed in Tree and Svensson (Citation2007). The review shows increases in particulate or soot emissions with increasing aromatics content for different reasons. As mentioned in Salamanca et al. (Citation2012b), the formation of the first aromatic ring is considered the limiting step in soot formation. The addition of biodiesel to diesel can reduce the concentration of aromatic compounds and as a consequence slowdown the soot formation rates and therefore lower particulate total emissions. Due to the strength of the C ˭ O bond, in the ester functional group, the CO will not contribute to the production of aromatic species so any carbon from the biodiesel that produces CO is considered to be removed from the reaction pathway leading to aromatic species and soot.
TABLE 3 Variation of PMC, GMD, and TNC with test fuel and engine operating conditions
All test fuels exhibit similar effects on the PMC. First, the PMC increases with increasing engine speed because of shorter combustion time in the engine cylinder, leading to less time for soot oxidation. Moreover, for the naturally aspirated diesel engine, the increase in engine speed leads to a reduction in volumetric efficiency and a decrease in air/fuel ratio, as shown in , which also leads to an increase in the PMC. Second, the PMC increases with increasing engine load because more fuel is injected, the air/fuel ratio decreases and the combustion duration is increased (Lu et al. Citation2012a), leading to the formation of more soot in the engine exhaust.
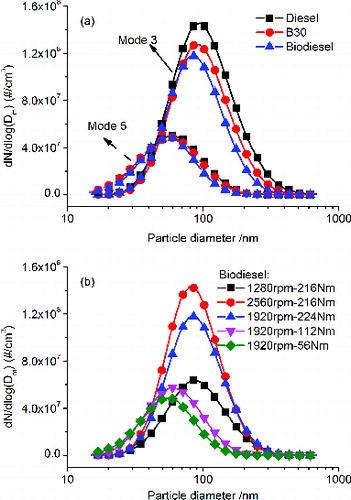
The SMPS was set to measure particles within the size range of 15 to 750 nm. presents typical particulate number concentrations and size distributions for different fuels and different modes of operation. Two important parameters, the geometric mean diameter (GMD) and the total number concentration (TNC), are listed in . As expected, biodiesel addition leads to smaller GMDs and decreases in TNCs because of more complete combustion and formation of less soot nuclei compared to diesel fuel. Furthermore, the TNC increases with increasing engine speed or engine load while the GMD is not much affected by the engine speed but decreases with decreasing engine load. For modes 1–3, under similar engine load and hence air/fuel ratios, combustion takes place under similar in-cylinder temperatures and pressures. The soot particles would have similar conditions for growth but, at higher engine speed there is shorter duration for combustion and burning out the particles, leading to similar GMD but larger TNC. For modes 3–5, at higher engine loads, more fuel is injected and hence combustion takes place with higher temperatures and pressures, which contributes to soot nucleation and promotes the growth of the exiting soot nuclei leading to larger GMDs and TNCs (Lapuerta et al. Citation2007).
TABLE 4 Variation of volatiles and ignition temperature with test fuel and engine operating conditions
TABLE 5 The oxidative characteristic for each sample
FIG. 2. Particle number concentration: (a) effect of test fuel and (b) effect of engine operating conditions.
3.2. Size of Primary Particle
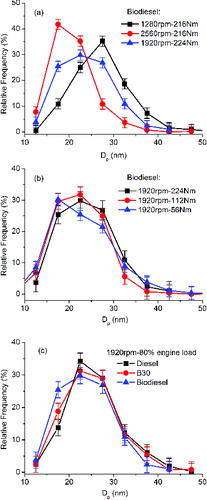
shows a low-resolution TEM image in which the primary particles form clusters of fractal-structures, called agglomerates, with each agglomerate consisting of tens or hundreds of primary particles. With the assistance of the commercial software Image-Pro, the diameter of each primary particle with a clear boundary in the low-resolution TEM images can be measured. More than 500 primary particles were measured for each engine operating condition. Typical size distributions of primary particles are shown in for the effect of engine speed, Figure 4b for the effect of engine load, and Figure 4c for the effect of test fuels. Figure S1 that shows the mean primary particle size for each fuel at the five modes is shown in the SI. The diameter of the primary particles varies from 10 to 50 nm. It can be seen that, for each fuel, at higher engine speeds, more primary particles with smaller diameters are formed, leading to a smaller mean diameter. Similarly, under the same engine speed, more primary particles with smaller diameters are formed at lower engine loads, leading to a lower mean diameter. With regard to the fuels, under each operating condition, biodiesel leads to smaller primary particles, compared to diesel fuel.
FIG. 3. TEM image at 1920 rpm, 224 Nm for diesel particulate.
FIG. 4. Size distribution of primary particles: (a) effect of engine speed; (b) effect of engine load; (c) effect of test fuel.
The formation of primary particles is a complex process (Tree and Svensson Citation2007). The fuel is pyrolyzed under fuel-rich conditions to form soot precursors that nucleate to form soot nuclei. Soot nuclei grow through surface growth and coalesce to form the primary particles. Li et al. (Citation2011) investigated the nanostructure, fractal dimension, and size of in-cylinder soot of a diesel engine. They found the size of primary particles varies during the combustion process, being smaller initially, enlarged to a maximum size during the early diffusion combustion phase and became smaller as the combustion proceeded. Primary particles size depends on the competition between soot oxidation and surface growth. In the early stage of combustion, the mean primary particle size increases as temperature and pressure increase rapidly, which contributes to the formation of soot nuclei and their growth. In the late stage of combustion, soot oxidation dominates. Thus, the formation and size of primary particles is closely related to the combustion process, which is affected by both engine load, engine speed, and the fuel.
For modes 1–3, the combustion process takes place at almost the same engine torque and hence in-cylinder temperature. However, higher engine speeds mean shorter combustion durations while lower engine speeds mean longer combustion durations, as shown in Lu et al. (Citation2012a). Primary particles may grow in size through surface growth of the particles or coalescence of the particles, both of which are time dependent and hence are favored by the longer combustion duration at lower engine speed. In fact, at lower engine speed, as shown in the heat release rate analysis of Lu et al. (Citation2012a), the extended combustion period is mainly in extending the stage of diffusion combustion that promotes particle nucleation and surface growth, leading to larger sized primary particles (Dec Citation1997). Similar results are obtained in Neer and Koylu (Citation2006), who also attributed the smaller primary particles obtained at higher engine speed to shorter residence times, which slowed down particle surface growth.
For modes 3–5, the combustion proceeds under the same engine speed but different engine loads. With an increase in engine load, more fuel is injected and burned in the combustion chamber. Thus, the in-cylinder temperatures and pressures are higher, the combustion durations, mainly the duration of diffusion combustion, is longer, and the overall equivalence ratios are higher. The above factors favor soot formation, surface growth and coalescence, and hence growth in the primary particle size. Although the increase in gas temperature favors soot oxidation, the lower air-fuel ratio is not favorable for soot oxidation, leading to larger primary particles at higher engine load. Again, similar results are obtained in Neer and Koylu (Citation2006), who attributed the higher overall equivalence ratios to higher local fuel-air ratios within the engine, which in turn promotes particle nucleation and growth, while suppressing particle oxidation.
For the three fuels, biodiesel gives the smallest while diesel fuel gives the largest primary particles. As mentioned before, primary particles grow in size through surface growth or coalescence. Compared to diesel fuel, the oxygen of biodiesel molecule promotes the oxidation of the already formed soot (Lapuerta et al. Citation2008b) and fewer carbons in biodiesel reduce the concentration of aromatic compounds, then making slowdown surface growth (Stanmore et al. Citation2001). These factors lead to smaller biodiesel primary particles. Lu et al. (Citation2012b) also found smaller primary particles from biodiesel. On the other hand, despite Salamanca et al. (Citation2012b) found increased primary particle size with palm oil biodiesel than diesel, they commented that a significant reduction of the primary particle size was expected with biodiesel because it is free of aromatics and unsaturated compounds, therefore formation of soot precursors should be less effective.
3.3. Nanostructure of Primary Particles
The nanostructures of primary particles as observed from the HRTEM images are shown in for diesel, B30, and biodiesel, respectively. Another set of HRTEM images for B100 operating at 1920 rpm, 56 Nm is shown in Figure S2 in the SI. As observed from the HRTEM images obtained in this study, as well as those reported in Lapuerta et al. (Citation2007), Lu et al. (Citation2012a), and Song et al. (Citation2006), the morphology of a primary particle can be categorized mainly into two types: (a) a slightly aggregated structure and (b) a typical inner core-outer shell structure. A particle with a slightly aggregated structure, called an immature particle, generally exhibits an irregular shape as shown in . It is formed from the coalescence of a number of pre-formed particles. A particle with a typical inner core–outer shell structure, called a mature particle, contains one or several nucleation sites and the inner core is surrounded by concentrically ordered graphene layers, as shown in or . As suggested by Hurt et al. (Citation2000), the core–shell nanostructure is the equilibrium configuration of nearly planar poly-aromatic clusters under the high-temperature reactive conditions of soot formation.
FIG. 5. HRTEM image at 1920 rpm, 224 Nm: (a) diesel; (b) B30; (c) biodiesel.
The morphology of a primary particle is mainly affected by the in-cylinder temperature and pressure. It is well accepted that soot transported to a high-temperature zone provides a high rate of carbonization, which is expected to result in the formation of soot with a disturbed carbonaceous structure (Merchan-Merchan et al. Citation2012). Particles with this structure would randomly aggregate with each other to form a relatively stable aggregate when the surrounding temperature cools down, forming the type (a) soot. Mature soot is formed when soot with a disturbed carbonaceous structure is transported to a higher temperature region (Merchan-Merchan et al. Citation2012). In other words, mature soot is soot that has had the requisite time, precursor mass, and temperature/pressure to form the highly ordered shell–core structure. This is supported by the work of Li et al. (Citation2011) who studied the nanostructure of in-cylinder soot particles for a diesel engine. They found the early in-cylinder soot particles exhibit lamellas with incoherent orientation with no obvious single center of concentric shells and display nebulous boundaries; while extended graphene layers and distinct boundaries are observable as combustion proceeds, and evident centers and characteristic shell/core nanostructures can be noted in late combustion phase.
Thus, lower engine load provides lower in-cylinder temperatures and pressures so type (a) particles prevail under low engine load. For modes 1–3, which have similar high in-cylinder temperatures and pressures, type (b) particles prevail. Biodiesel addition reduces soot formation and hence favors the formation of type (a) particles instead of type (b) particles and generates more type (a) particles compared with diesel fuel under all operating conditions. Lu et al. (Citation2012a) compared soot particles produced by waste cooking oil biodiesel and diesel fuel while Vander Wal (Citation2006) compared soot particles produced by soy-derived biodiesel with diesel fuel. Both reported that biodiesel produced soot with a less graphitic structure than diesel fuel, which is similar to the results obtained in this study. However, Song et al. (Citation2006) did report a typical shell/core structure for equilibrium soot produced by a palm oil biodiesel.
To further quantify the nanostructure of the primary particles, fringe length (La), tortuosity (Tf), and separation distance (Ds) were measured from the HRTEM images following the procedures reported in Yehliu et al. (Citation2011). The fringe length (La) is a measure of the physical extent of the atomic carbon layer planes and reflects the dimension of the basal plane diameter. Tortuosity (Tf) is a measure of the curvature of the fringes and is defined here as the ratio of the fringe length to the distance between the two endpoints. Separation distance (Ds) is the mean distance between adjacent carbon layer planes. In a binary image with a one-pixel width fringe derived from an HRTEM image, the three parameters were measured using the commercial software and then the measurements were computed using a calibrated pixel size. La with lengths more than 0.5 nm and Ds with distances from 0.3 to 0.45 nm were utilized as threshold values for these measurements to eliminate the impact of background effect as suggested by Yeliu et al. (Citation2011). The results for median La, the mean Tf, and the mean Ds of each operating condition are shown in , respectively.
FIG. 6. The effect of engine operating conditions and biodiesel on: (a) median La; (b) mean Tf; (c) mean Ds.
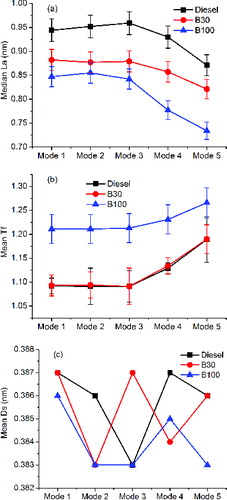
From , when using the same test fuel, the fringe length and tortuosity reveal insignificant differences within 95% confidence level, indicating limited impact of engine speed on the nanostructure. It is because at high engine load, primary particles with a typical inner core–outer shell structure are common, which contain longer and straighter graphene layers. Therefore, the primary particles for modes 1–3, which are formed under similar in-cylinder temperatures and pressures, have similar stable graphitization nanostructure.
It can also be observed that La decreases and Tf increases with decreasing engine load, revealing that there are more particles exhibiting disordered configuration with shorter and more curving graphene layers at lower engine load. Under lower engine load, the temperature and pressure can support nucleation of primary particles but cannot support their growth to the equilibrium configuration. Zhu et al. (Citation2005) also found increases in the disorder of graphitic structures with decreasing engine load using Raman spectroscopy.
Furthermore, from , the effects of different fuels can be compared. The two figures show that, with biodiesel, the primary particles have a shorter fringe length and larger tortuosity under each operating condition. These primary particles usually have slightly aggregated structures, which contain shorter and more curved graphene layers. Furthermore, they contain a larger percentage of surface oxygen functional groups (Boehman et al. Citation2005; Song et al. Citation2006), which changes the connection type between carbons in a graphene layer, leading to the shorter and more curved fringe length.
The separation distance (Ds) is in the range of 0.3–0.5 nm under all test conditions, while the mean Ds varies narrowly between 0.383 and 0.387, as shown in . The mean values of Ds are not significantly different from each other under all test conditions, indicating that there is an insignificant impact of engine operating conditions and fuel on this parameter.
3.4. Oxidation Characteristics
Thermogravimetric analyzer/differential scanning calorimetry (TGA/DSC) was used to evaporate and oxidize particulate samples from each test fuel for modes 1–5. The typical mass loss curves from TGA results are shown in . Obviously, the mass loss curve for each operating condition shows two sharp decreases: one occurring at around 200–350°C and the other at 400–650°C, which, respectively, are mainly caused by the loss of the volatile substances and the oxidation of the nonvolatile substances. The temperature history of the derivative of DSC signal for each mode presents a sudden reduction in the temperature range of 450–700°C, indicating a fast rate of mass loss and heat release, as shown in . When the temperature further increases, the mass loss fraction starts to level off. Therefore, the temperature corresponding to the peak of this curve with the maximum rate of mass loss and heat release is defined as the ignition temperature (Ti). The determined volatiles fraction and Ti for each sample are listed in , revealing that the influence of engine load is more pronounced than the influence of engine speed, and that the oxygen content in the fuel can lead to more volatiles in the soot and a lower ignition temperature. The mass losses and derivatives of DSC signals for each fuel are shown in Figure S3 in the SI.
FIG. 7. Typical (a) mass loss curves and (b) derivative of DSC signal profiles.
For further investigation of the oxidative properties of the nonvolatile substances, kinetic parameters were obtained from the mass loss rate using a modified form of the Arrhenius expression, as suggested by Stratakis and Stamatelos (Citation2003)
where m is the actual mass of sample undergoing reaction in mg; t is the time in s; A is the frequency factor in s−1; E is the activation energy in kJ/mol; R = 8.314×10⁻³ kJ/(K·mol) is the molar gas constant; T is the heating temperature in K; n is the reaction order and supposed to be unity (n = 1) for present soot oxidation (Rodríguez-Fernández et al. Citation2011). Based on the TGA results on nonvolatile substances, the kinetic parameters of A and E were determined and listed in . For modes 1–3, activation energy shows almost the same value of 165 kJ/mol for diesel, 145 kJ/mol for B30, and 110 kJ/mol for biodiesel under high engine loads, implying a similar oxidative rate. However, the activation energy (E) decreases as the engine load decreases for modes 3–5, indicating a faster oxidative rate at lower engine load. Moreover, the biodiesel soot has the lowest activation energy at all operating conditions, followed by B30.
The soot oxidative reactivity is closely related to the nanostructure including the size, orientation, and organization of the graphene layers (Boehman et al. Citation2005). The disordered carbonaceous nanostructure increases the accessible carbons on the edge sites (Al-Qurashi and Boehman Citation2008). Moreover, a carbon atom at an edge site is much more reactive than one in the basal plane of a graphene layer because the surface oxygen functional groups bounded to edge sites can induce more micropore structures during an attack by air on the edge sites (Radović et al. Citation1983; Yehliu et al. Citation2012). Therefore, a soot particle with disordered configuration has more populated edge sites and then has a higher reactivity when compared with that with inner core–outer shell configuration. As described in the section of nanostructure, the disordered structure with shorter and more curving fringe is prevailing in soot particles generated under lower engine load or formed when using biodiesel, then making lower ignition temperature and activation energy in low engine load and biodiesel soot.
Furthermore, the oxidative reactivity of soot is also affected by the volatiles, which filled the micropores of the particulate aggregates. As shown by Yehliu et al. (Citation2013) and Lu et al. (Citation2012a,Citationb) particulate oxidative reactivity increases with the increase of the volatiles fraction. Using biodiesel can generate soot with more volatiles compared with using diesel. Although the volatile substances are removed before the oxidation process, the evaporation of condensed layers of volatile organics makes the underlying primary particle structure exposed and accessible for subsequent soot oxidation.
4. CONCLUSIONS
Present work focuses on the effect of waste cooking oil biodiesel on the particulate mass, number concentration, nanostructure, and oxidative reactivity under different engine operating parameters, including engine speed and engine load. The main conclusions of present work are as follows:
Particulate mass and the size distribution have a strong relationship with the engine operation conditions. Biodiesel could reduce the particulate mass and number concentration.
The TEM images reveal that more primary particles with smaller size are generated under higher engine speed or lower engine load or when biodiesel is added.
Biodiesel and engine load affects the nanostructure of primary particles. Biodiesel and lower engine load favor the formation of immature primary particles while engine speed has less influence on the nanostructure of the primary particles.
With regard to the oxidative reactivity, the impact of engine load at constant engine speed is more pronounced than the impact of engine speed. Biodiesel has the lowest activation energy at all operating conditions. The soot oxidative reactivity is closely related to the nanostructure properties, volatiles, and the oxygen content in fuel. Moreover, soot with amorphous nanostructure has faster rate of mass loss than soot with typical core–shell nanostructure.
In general, the results obtained with B30 fuel lie in between those obtained for biodiesel and diesel fuel.
Boehman et al. (Citation2005) investigated the impact of biodiesel blending on diesel soot and the regeneration of particulate filters. They concluded that biodiesel blending alters nanostructure of the primary soot particles and reduces the temperature required to initiate regeneration of the diesel particulate filter. Similar changes in particulate properties are observed in this investigation. Hence, the use of cooking oil biodiesel would be beneficial in terms of regeneration of particulate in after-treatment systems.
SUPPLEMENTAL MATERIAL
Supplemental data for this article can be accessed on the publisher's website.
UAST_1016214_Supplemental_Information.zip
Download Zip (4.5 MB)FUNDING
The authors would like to acknowledge the financial support from The Hong Kong Polytechnic University (project no. B-Q33D) and the Research Grants Council of the Hong Kong SAR (project no. PolyU 5130/12E).
Related Research Data
REFERENCES
- Agarwal, A. K. (2007). Biofuels (Alcohols and Biodiesel) Applications as Fuels for Internal Combustion Engines. Prog. Energy Combust. Sci., 33:233–271.
- Agarwal, A. K., Gupta, T., and Kothari, A. (2011). Particulate Emissions from Biodiesel vs Diesel Fuelled Compression Ignition Engine. Renew. Sust. Energy Rev., 15:3278–3300.
- Al-Qurashi, K., and Boehman, A. L. (2008). Impact of Exhaust Gas Recirculation (EGR) on the Oxidative Reactivity of Diesel Engine Soot. Combust. Flame, 155:675–695.
- Armas, O., Hernández, J. J., and Cárdenas, M. D. (2006). Reduction of Diesel Smoke Opacity From Vegetable Oil Methyl Esters During Transient Operation. Fuel, 85:2427–2438.
- Arvidsson, R., Fransson, K., Fröling, M., Svanström, M., and Molander, S. (2012). Energy Use Indicators in Energy and Life Cycle Assessments of Biofuels: Review and Recommendations. J. Cleaner Prod. 31:54–61.
- Boehman, A. L., Song, J., and Alam, M. (2005). Impact of Biodiesel Blending on Diesel Soot and the Regeneration of Particulate Filters. Energy Fuels, 19:1857–1864.
- Bresenham, D., Reisel, J., and Neusen, K. (1998). Spindt Air-Fuel Ratio Method Generalization for Oxygenated Fuels. SAE Technical Paper 982054.
- Dec, J. E. (1997). A Conceptual Model of DI Diesel Combustion Based on Laser-Sheet Imaging*. SAE Technical Paper 970873.
- Demirbas, A. (2007). Progress and Recent Trends in Biofuels. Prog. Energy Combust. Sci., 33:1–18.
- Demirbas, A. (2008). Biofuels Sources, Biofuel Policy, Biofuel Economy and Global Biofuel Projections. Energy Convers. Manage., 49:2106–2116.
- Hurt, R. H., Crawford, G. P., and Shim, H. S. (2000). Equilibrium Nanostructure of Primary Soot Particles. Symp. (Int.) Combust., 28:2539–2546.
- Kulkarni, M. G., and Dalai, A. K. (2006). Waste Cooking Oil An Economical Source for Biodiesel: A Review. Ind. Eng. Chem. Res., 45:2901–2913.
- Lapuerta, M., Armas, O., and Herreros, J. M. (2008a). Emissions From a Diesel–Bioethanol Blend in an Automotive Diesel Engine. Fuel, 87:25–31.
- Lapuerta, M., Armas, O., and Rodríguez-Fernández, J. (2008b). Effect of Biodiesel Fuels on Diesel Engine Emissions. Prog. Energy Combust. Sci., 34:198–223.
- Lapuerta, M., Martos, F. J., and Herreros, J. M. (2007). Effect of Engine Operating Conditions on the Size of Primary Particles Composing Diesel Soot Agglomerates. J. Aerosol. Sci., 38:455–466.
- Lapuerta, M., Oliva, F., Agudelo, J. R., and Boehman, A. L. (2012). Effect of Fuel on the Soot Nanostructure and Consequences on Loading and Regeneration of Diesel Particulate Filters. Combust. Flame, 159:844–853.
- Lapuerta, M., Rodríguez-Fernández, J., and Agudelo, J. R. (2008c). Diesel Particulate Emissions From Used Cooking Oil Biodiesel. Bioresource Technol., 99:731–740.
- Lee, K., Cole, R., Sekar, R., Choi, M., Zhu, J., and Kang, J. (2001). Detailed Characterization of Morphology and Dimensions of Diesel Particulates via Thermophoretic Sampling. SAE Technical Paper 2001-01-3572.
- Li, Z., Song, C., Song, J., Lv, G., Dong, S., and Zhao, Z. (2011). Evolution of the Nanostructure, Fractal Dimension and Size of In-Cylinder Soot During Diesel Combustion Process. Combust. Flame, 158:1624–1630.
- Lu, T., Cheung, C. S., and Huang, Z. (2012a). Effects of Engine Operating Conditions on the Size and Nanostructure of Diesel Particles. J. Aerosol. Sci., 47:27–38.
- Lu, T., Cheung, C. S., and Huang, Z. (2012b). Investigation on Particulate Oxidation from a DI Diesel Engine Fueled with Three Fuels. Aerosol. Sci. Technol., 46:1349–1358.
- Merchan-Merchan, W., Sanmiguel, S. G., and McCollam, S. (2012). Analysis of Soot Particles Derived from Biodiesels and Diesel Fuel Air-Flames. Fuel, 102:525–535.
- Mueller, C. J., Pitz, W. J., Pickett, L. H., Martin, G. C., Siebers, D. L., and Westbrook, C. K. (2003). Effects of Oxygenates on Soot Processes in Di Diesel Engines: Experiments and Numerical Simulations. SAE Technical Paper 2003-01-1791.
- Neer, A., and Koylu, U. O. (2006). Effect of Operating Conditions on the Size, Morphology, and Concentration of Submicrometer Particulates Emitted from a Diesel Engine. Combust. Flame, 146:142–154.
- Radović, L. R., Walker Jr, P. L., and Jenkins, R. G. (1983). Importance of Carbon Active Sites in the Gasification of Coal Chars. Fuel, 62:849–856.
- Rodríguez-Fernández, J., Oliva, F., and Vázquez, R. A. (2011). Characterization of the Diesel Soot Oxidation Process Through an Optimized Thermogravimetric Method. Energy Fuels, 25:2039–2048.
- Salamanca, M., Mondragón, F., Agudelo, J. R., Benjumea, P., and Santamaría, A. (2012a). Variations in the Chemical Composition and Morphology of Soot Induced by the Unsaturation Degree of Biodiesel and a Biodiesel Blend. Combust. Flame, 159:1100–1108.
- Salamanca, M., Mondragón, F., Agudelo, J. R., and Santamaría, A. (2012b). Influence of Palm Oil Biodiesel on the Chemical and Morphological Characteristics of Particulate Matter Emitted by a Diesel Engine. Atmos. Environ., 62:220–227.
- Sgroi, M., Bollito, G., Saracco, G., and Specchia, S. (2005). BIOFEAT: Biodiesel Fuel Processor for a Vehicle Fuel Cell Auxiliary Power Unit: Study of the Feed System. J. Power Sources, 149:8–14.
- Song, J., Alam, M., Boehman, A. L., and Kim, U. (2006). Examination of the Oxidation Behavior of Biodiesel Soot. Combust. Flame, 146:589–604.
- Spreen, K., Ullman, T., and Mason, R. (1995). Effects of Cetane Number, Aromatics, and Oxygenates on Emissions From a 1994 Heavy-Duty Diesel Engine With Exhaust Catalyst. SAE Technical Paper 950250.
- Stanmore, B. R., Brilhac, J. F., and Gilot, P. (2001). The Oxidation of Soot: A Review of Experiments, Mechanisms and Models. Carbon, 39:2247–2268.
- Stratakis, G. A., and Stamatelos, A. M. (2003). Thermogravimetric Analysis of Soot Emitted by a Modern Diesel Engine Run on Catalyst-Doped Fuel. Combust. Flame, 132:157–169.
- Tree, D. R., and Svensson, K. I. (2007). Soot Processes in Compression Ignition Engines. Prog. Energy Combust. Sci., 33:272–309.
- Vander Wal, R. L., and Mueller, C. J. (2006). Initial Investigation of Effects of Fuel Oxygenation on Nanostructure of Soot from a Direct-Injection Diesel Engine. Energy Fuels, 20:2364–2369.
- Xue, J., Grift, T. E., and Hansen, A. C. (2011). Effect of Biodiesel on Engine Performances and Emissions. Renew. Sust. Energy Rev., 15:1098–1116.
- Yehliu, K., Armas, O., Vander Wal, R. L., and Boehman, A. L. (2013). Impact of Engine Operating Modes and Combustion Phasing on the Reactivity of Diesel Soot. Combust. Flame, 160:682–691.
- Yehliu, K., Vander Wal, R. L., Armas, O., and Boehman, A. L. (2012). Impact of Fuel Formulation on the Nanostructure and Reactivity of Diesel Soot. Combust. Flame, 159:3597–3606.
- Yehliu, K., Vander Wal, R. L., and Boehman, A. L. (2011). Development of an Hrtem Image Analysis Method to Quantify Carbon Nanostructure. Combust. Flame, 158:1837–1851.
- Zhu, J., Lee, K. O., Yozgatligil, A., and Choi, M. Y. (2005). Effects of Engine Operating Conditions on Morphology, Microstructure, and Fractal Geometry of Light-Duty Diesel Engine Particulates. Proc. Combust. Inst., 30:2781–2789.