
Abstract
We recently developed an electrostatic collector for bioaerosols that electrostatically deposits biological particles onto a 3.2 mm electrode covered by a superhydrophobic substance. The deposited biological particles are removed and collected by rolling water droplets (20 or 40 microliter) which results in high concentration rates. The collector has been improved further by integrating it with an electrical charger. Here, we describe the development and optimization of the charger and collection chamber, while maximizing collection efficiency and minimizing particle loss. The resulting sampler is made of static dissipative material (e.g., Delrin), is shaped as a closed half cylinder, and is integrated with a charger. The sampler's round top section contains eight carbon fiber brushes (ion sources to charge particles), while its flat bottom section holds a rectangular collection electrode (254 × 3.2 mm) made of pressed carbon fiber and coated with a superhydrophobic material.
The optimized configuration of the EPSS Mark II had a collection efficiency of up to 84% when sampling airborne Escherichia coli at 10 L/min and for 10 min. The bacteria were accumulated in rolling water droplets as small as 20 microliters, and the sampler achieved sample concentration rates of up to 4.2 × 10⁵/min. When the sampler was operated for a longer time period (60 min), its collection efficiency was 72%. The efficiency decrease was most likely due to a reduced particle removal from the electrode, but the difference was not statistically significant. Since the EPSS Mark II shows satisfactory collection efficiency and high sample concentration rate, it could serve as a basis for developing a field-deployable version of the sampler.
Copyright 2015 American Association for Aerosol Research
INTRODUCTION
Bioaerosol includes airborne particles of biological origin such as mold, viruses, bacteria, and their fragments or products (Wittmaack et al. Citation2005). Various bioaerosol-related studies (Douwes et al. Citation2003; Fung and Hughson Citation2008; Adhikari et al. Citation2009) require representative, nondestructive bioaerosol sampling methods that provide adequate biomass for downstream analysis. Current biosamplers employ different collection mechanisms such as impaction, impingement, cyclonic collection, and electrostatic precipitation; these samplers/collection mechanisms have different advantages/disadvantages and serve different purposes (Henningson and Ahlberg Citation1994; McCartney et al. Citation1997; Pillai and Ricke Citation2002; McFarland et al. Citation2010). King and McFarland (Citation2011) compared the culturability and DNA intactness of E. coli when these bacteria were sampled by an inertial impactor and a wetted wall cyclone. They found that the wetted wall cyclone retained the cell culturability and DNA intactness better than the impactor. Other studies found that electrostatic sampling presents lowest impaction stress to the organisms and might minimize cell damage during collection thus maintaining cell integrity for further analyses and microorganism identification (Yao et al. Citation2005; Zhen et al. Citation2013). Currently, application of electrostatic method for routine microorganism collection is still in development stages.
One of the metrics to describe performance of liquid-based samplers, including those that operate based on electrostatics, is their concentration rate: i.e., the ratio of particle concentration in the collection liquid versus the airborne particle concentration per time unit (Han and Mainelis Citation2008). The concentration rate is directly proportional to the sampler's flow rate and collection efficiency, and inversely proportional to the volume of collection, or rinsing, liquid (Han and Mainelis Citation2008). Some electrostatics-based samplers (Madsen and Sharma Citation2008; Roux et al. Citation2013) feature relatively high flow rates (e.g., 100 or 3500 L/min) and relatively high volumes of rinsing liquid (e.g., 6–15 mL), which result in concentration rates of 1.6 × 10⁴ and ∼2 × 10⁵/min assuming 100% collection efficiency. Tan et al. (Citation2011) designed an electrostatic sampler that used sampling flow rates of 1.2–6.2 L/min, but low volume (400 μL) of rinsing solution which resulted in concentration rates of ∼3 × 10³ to ∼1.6 × 10⁴/min.
The authors of this article described a liquid-based electrostatic precipitator with superhydrophobic surface (EPSS, Mark I) for bioaerosol sampling where airborne particles are deposited on a superhydrophobic surface and then collected by a rolling water droplet ranging in volume from 5 to 60 μL (Han and Mainelis Citation2008; Han et al. Citation2010, Citation2011). When tested with Pseudomonas fluorescens and Bacillus subtilis var. niger (Han et al. Citation2010), the sampler achieved concentration rates exceeding 1 × 10⁶/min. The sampler also efficiently collected and concentrated airborne fungal spores; however, the collection efficiency progressively decreased as the airborne spore concentration increased above approximately 105–106/m3 due to hydrophobicity of fungal spores (Han et al. Citation2011). While the concept of using electrostatic precipitation and superhydrophobic collection surface to concentrate airborne particles in liquid was shown to be feasible, the earlier prototype used a nonintegrated commercial ionizer to electrically charge the airborne particles, which resulted in substantial particle losses (40–50%), thus effectively lowering the concentration rate.
Here, we describe additional improvements in sampler development: design of a particle charger, its integration with the collection unit, and optimization of this new sampler version (Mark II) to minimize particle losses while maintaining or improving its collection efficiency.
MATERIALS AND METHODS
Design Features of the New Generation Electrostatic Precipitator with Superhydrophobic Surface (EPSS, Mark II)
The EPSS Mark I version featured a separate charger and collector, but the new EPSS Mark II was redesigned into a single-stage electrostatic precipitator, where the charging and collection of airborne particles take place in the same chamber. Just as the Mark I version, the Mark II version () also has the shape of a closed half cylinder with a diameter, d, of 50 mm where a flat bottom section holds a narrow collection electrode (width [w]: 3.2 mm × length [l]: 254 mm) covered by a superhydrophobic substance (HIREC-1450, NTT Corporation Inc., Japan). In the Mark II, the top half-cylinder section houses one or more ion sources, which is different from the Mark I, where the bottom section contained an electrode. Since the ion sources are connected to high voltage and the collection electrode is grounded, the configuration presented in creates an ion cloud which charges the incoming particles and then deposits them onto the collection electrode. The single-stage EPSS requires a single power supply for both charging and collection, thus reducing the cost and complexity of its design and ultimately field deployment.
FIG. 1. Schematic diagram of the single-stage electrostatic precipitator.
The Mark I was constructed of cast acrylic (McMaster-Carr Co., Elmhurst, IL, USA), but the Mark II is made of static dissipative material: homopolymer acetal (Delrin, Professional Plastics Inc., Fullerton, NY, USA). In addition, a sharp edge inlet was added to the Mark II to minimize inlet losses and turbulence in the entering aerosol stream.
Experimental Setup for EPSS Testing
The EPSS was tested with 1.0 μm green fluorescent polystyrene latex (PSL) particles (Duke Scientific Corp., Palo Alto, CA, USA) and biological aerosols as shown in . The test system was comprised of a flow control system, a particle generation system, an air-particle mixing system, and a particle monitoring system. The system was housed inside a Class II Biosafety cabinet (NUAIRE Inc., Plymouth, MN, USA).
FIG. 2. Schematic diagram of the experimental setup.
A HEPA-filtered dilution air flow, QD (175 L/min), provided by an in-house compressor, was controlled by a pressure regulator and monitored by a mass flowmeter (TSI Inc., Shoreview, MN, USA). A six-jet Collison nebulizer (BGI Inc., Waltham, MA, USA) was used to aerosolize test particles from a liquid suspension at a flow rate (QA) of 5 L/min (pressure of 10 psi). The dilution air and aerosolized particle stream were combined (QD +QA = 180 L/min) and passed through a 2-mCi Po-210 charge neutralizer (Amstat Industries Inc., Glenview, IL, USA) to reduce aerosolization-related particle charges to Boltzmann equilibrium. The electrically neutralized particles then passed through the first mixing box (Han et al. Citation2005) which improved the uniformity of particle distribution across the flow cross-section. A second mixing box and a U-type duct connector further improved particle mixing. A flow straightener was placed at the exit of the second mixing box to eliminate large-scale turbulence and flow swirl generated by the mixing boxes. Finally, well-mixed aerosols were introduced into a 0.152 m (6 inches) diameter test duct. The test sampler was mounted 6 duct diameters downstream of the exit of the flow straightener in order to provide uniform cross-sectional profile of test particles. The reference aerosol concentration was determined by an optical particle counter (model 1.108, Grimm Technologies Inc., Douglasville, GA, USA) or a filter (i.e., glass fiber filter for PSL particles and membrane filter for bioaerosols) positioned at the outlet of the EPSS when the power was turned off. The EPSS sampling flow rate was provided by a vacuum pump and monitored by a mass flow meter (TSI Inc., Shoreview, MN, USA).
Test Protocol When Testing with PSL Particles
A DC high-voltage source (Bertan Associates Inc., Valhalla, NY, USA) connected to the EPSS provided power to the ionizer to charge the incoming charge-neutralized particles. The concentration of fluorescent PSL particles was approximately 4 × 10⁴ ∼ 105/Liter. The EPSS was operated at the sampling flow rate QS = 10 L/min.
The optimization experiments were carried out with and without a superhydrophobic coating on the collection electrode. The coating substance and its application procedure were described previously (Han and Mainelis Citation2008; Han et al. Citation2010, Citation2011). Briefly, the substance was applied on the electrode twice within a few minutes to achieve a uniform coating, and then the electrode was left to dry at 60ºC for about 1 h.
The EPSS Mark II was optimized by testing its collection efficiency through the following steps.
Step 1: Investigation of Ionizer Design Type and Material
The following four configurations were fabricated and installed at a distance of 19.1 mm (0.75 inches) away from the collection electrode to compare charging performance: (a) four evenly spaced carbon fiber brushes with ∼200 fibers/brush (VC-36S, Formosa Plastics Co., Taiwan), (b) a 12.7 mm wide and 254 mm long carbon fiber band installed lengthwise, (c) four evenly spaced tungsten needles of 0.0762 mm in diameter (W91, Scientific Instrument Services Inc., Ringoes, NJ, USA), and (d) a tungsten wire 0.0762 mm in diameter and 254 mm in length installed lengthwise. The carbon fiber and tungsten wire diameters were ∼7 μm and ∼76.2 μm, respectively. A -9 kV charging voltage was applied, and an uncoated collection electrode was used.
Step 2: Optimal Distance Between Ionizer and Ground Electrode
Once the ionizer material and design type were selected, we determined the optimal distance between the tip of the ionizer and the collection electrode by testing the following spacing: 9.5, 12.7, 15.9, 19.1, and 25.4 mm (0.375, 0.5, 0.625, 0.75, and 1 inches). An uncoated collection electrode was used, and either -8 or -9 kV voltage was applied.
Step 3: Different Ionizer Configurations
As the data considered later will show, the carbon brush-type ionizer was selected as the preferred ionizer type. The collection efficiency was then determined for the following design parameters: number of brushes (e.g., 3, 4, and 8); number of fibers in each brush (e.g., 200, 400, 600 per brush); and ionizer orientation angle in the cross-section of the EPSS (90 or 45 and 135º). The tests were carried out with both coated and uncoated collection electrodes. A -9 kV voltage was applied.
Step 4: Material of the Collection Electrode
The EPSS was tested with eight different collection electrodes made of the following materials: copper, alloy 360 brass, alloy 1020 steel, zinc-coated steel, alloy 1090 steel, alloy 8630 steel, 304 stainless steel, and pressed carbon-fiber. The electrical conductivity (Siemens/m) and resistivity (ohm-m) of these materials are presented in the online supplemental information (Table S1). Experiments were carried out with a coated electrode, and -9 kV voltage was applied.
Determination of the EPSS Collection Efficiency
The collection efficiency of the EPSS was determined using the following two methods: (1) for optimization steps 1 and 2, an optical particle counter (OPC) was used to compare particle concentration downstream of the EPSS with its power ON and OFF; 5-min measurements were used in each case; (2) for optimization steps 3 and 4, the concentration of fluorescent PSL particles collected by the EPSS and removed by a 40 μL sterile deionized (DI) water droplet was compared with that extracted from a reference filter (type A/E, 47 mm, Pall Inc., East Hills, NY, USA). The reference filter was placed downstream of the EPSS and collected particles with EPSS power OFF. PSL particle concentration in each sample was determined by measuring its fluorescence intensity using a digital filter fluorometer (Turner Quantech model FM109515, Barnstead/Thermolyne Corp., Dubuque, IA, USA) as described previously (Han and Mainelis Citation2008). The collection efficiency of the EPSS, ηEPSS, was determined as follows:[1]
where CON and COFF are airborne particle concentrations with voltage ON and OFF, respectively;[2] where Cdroplet and Creference filter are aerosol concentrations in water droplet and reference filter, respectively, based on fluorometer reading.
Tests with Biological Particles
After the optimization experiments with PSL particles were completed, the collection efficiency of the EPSS was determined with a stress-sensitive gram-negative bacterium Escherichia coli (American Type Culture Collection 15597, Rockville, MD, USA). This species of bacteria has been widely used in bioaerosol studies (Wang et al. Citation2001; Lee and Kim Citation2003). The organisms were grown on nutrient agar (Becton, Dickinson and Company, Sparks, MD, USA) and stored at 4°C (no longer than a month). Prior to the experiments, E. coli were cultured in nutrient broth (Becton, Dickinson and Company, Sparks, MD, USA) for 18 h at 37°C. After growth, the cells were harvested by centrifugation at 7000 rpm (6140 g) for 5 min at 4°C (BR4, Jouan Inc., Winchester, VA, USA) and then washed four times with sterile DI water (Millipore Corp., Billerica, MA, USA). The final liquid suspension was diluted with sterile DI water to obtain a target airborne cell concentration of ∼104 to 107cells/L as determined by the Grimm optical counter.
The experimental setup shown in was used, and the EPSS was operated at low (10 L/min) or high (25 L/min) flow rates for short-term (10 min) or long-term (60 min) sampling times. Fresh liquid suspension of about 30 mL was prepared for each test, and it was aerosolized using a collison nebulizer. The collection electrode was coated by a superhydrophobic substance and the collected samples were removed with either 20 μL or 40 μL droplets.
The total number of cells removed by each droplet was determined by acridine orange epifluorescence microscopy using the Axioskop 20 (Carl Zeiss MicroImaging Inc., Thornwood, NY, USA), according to a previously published method (Han et al. Citation2010). Briefly, formaldehyde (100 μL) and sterile DI water (860 or 880 μL, depending on the collection droplet volume) was added to increase sample volume to 1 mL. The 1 mL sample was serially diluted in 10-fold dilutions with sterilized water to achieve a cell concentration that could be comfortably counted using a microscope (e.g., around 20 cells per each microscope view field). Each glass slide for microscope counting was prepared by filtering a sample through a 25 mm black polycarbonate filter (Thermo Fisher Scientific Inc., Suwanee, GA, USA) and staining it with 1 mL of 0.1 μg/mL Acridine Orange solution (Becton Dickinson Microbiology System, Sparks, MD, USA) for 15 min.
The total cell number in each sample, Csample, was calculated as follows:[3] where N is the average cell count in each microscope view field, X is the number of fields for the entire filter (X = 6125), and D is the dilution factor.
The reference concentration was determined by measuring the concentration of bioaerosols by a Grimm optical counter located downstream of the EPSS with its power OFF. Thus, the collection efficiency for bioaerosols, ηEPSS,BIO, was determined as:[4] where CGrimm is the average airborne cell concentration (/Liter) as measured by the Grimm OPC for 5 min before and after sampling with EPSS power OFF, Qs (L/min) is the sampling flow rate of the EPSS, and t (min) is the sampling time.
The accuracy of using Grimm OPC to measure the reference concentration was examined by comparing the concentration of cells measured by Grimm with that measured using a reference filter (47-mm membrane filter, Pall Inc., East Hills, NY, USA). Here, particles collected on the filter were extracted into sterile DI water as described elsewhere (Wang et al. Citation2001). The number of particles in the resulting suspension was determined by acridine orange epifluorescence microscopy (AOEM) and compared with the Grimm reading. It was found that the two number concentrations (Grimm reading versus reference filter) agreed within 12.7 ± 5.6%. Since the Grimm OPC method is far more rapid than microscopic counting, the Grimm OPC method was used as the reference for the remainder of the study.
In addition to collection efficiency, the sampler's concentration rate, RC (min−1), was calculated using sampler's operational parameters as follows (Han and Mainelis Citation2008):
[5] where Qs (L/min) is the sampling flow rate, VWD (L) is the volume of the collecting sterile deionized water droplet, and η is the collection efficiency.
RESULTS AND DISCUSSION
presents the collection efficiency of the EPSS as a function of ionizer material and configuration. The EPSS Mark II was operated with a 254 mm brass collection electrode without superhydrophobic coating. The concentration of 1 μm airborne PSL particles was approximately ∼105/Liter. As seen in , the collection efficiencies of the EPSS (Equation (1)) were 85.0 ± 3.2% for the four carbon fiber brushes, 83.4 ± 1.6% for the carbon fiber band, 70.3 ± 5.0% for the tungsten needles, and 60.5 ± 2.6% for the tungsten wire. Based on t-test results, the difference in the average collection efficiency was not statistically significant between the carbon fiber brush and the carbon fiber band (p = 0.48). However, collection efficiency of the EPSS with carbon fibers was significantly higher compared to that with tungsten ionizers (p < 0.05). As a result, a design incorporating a carbon fiber ionizer was selected for further analyses. Since carbon fiber brushes were easier to install and manipulate than carbon fiber band, they were selected to be used in all subsequent experiments.
FIG. 3. Collection efficiency of the EPSS as a function of different ionizer material and type: (1) four carbon fiber brushes (ca. 200 fibers/brush) in a row positioned at the top half-cylinder, (2) a carbon fiber band (12.7 mm width and 254 mm length) positioned along the length of the EPSS, (3) four tungsten needles (0.076 mm in diameter) positioned at the top half-cylinder, and (4) a 254 mm tungsten wire positioned along the length of the EPSS. Experiments were performed with 1 μm PSL at 10 L/min sampling flow rate and -9 kV charging/collecting voltage. Collection efficiency was determined by measuring particle concentration downstream of EPSS with its voltage ON and OFF. The error bars represent the standard deviation from three repeats.
In the next step, the EPSS performance was further optimized by varying the distance between the ionizer brush tips and the collection electrode (). This distance affects both the electrostatic field strength and, consequently, the strength of ion emission and mixing of ions with the incoming aerosol. When -9 kV was used, the collection efficiency increased from 69.0 ± 2.0% to 85.0 ± 3.2%% when the distance was increased from 9.5 mm (0.375 inches) to 19.1 mm (0.75 inches), repectively. Similarly, for -8 kV, the collection efficiency increased from 76.8 ± 2.0% to 79.0 ± 2.0% when the gap was increased from 15.9 mm (0.625 inches) to 19.1 mm (0.75 inches), respectively. The observed increase in the collection efficiency with the increasing gap distance appears counterintuitive since the magnitude or strength of an electrostatic field is inversely proportional to the distance from the charge source (Hinds Citation1999). However, decreasing the distance too much likely resulted in increased blocking of the airstream and reduced mixing of incoming particles and ions. For both tested voltages, the collection efficiency decreased by about 10% when the gap was increased further to 25.4 mm (1 inch). Thus, the best collection efficiencies were observed for gap sizes of 15.9 mm (0.625 inches) and 19.1 mm (0.75 inches) and the difference between the two was not statistically significant (p > 0.05). For convenience, the 19.1 mm (0.75 inches) gap was chosen and used to test additional adjustment in carbon fiber ionizer configuration.
FIG. 4. Collection efficiency of the EPSS as a function of distance between the tip of the ionizer and the collection electrode. The experiments were performed with 1.0 μm PSL particles at a 10 L/min sampling flow rate and either -8kV or -9 kV charging/collection voltage. Collection efficiency was determined by measuring particle concentration downstream of EPSS with its voltage ON and OFF. The error bars represent the standard deviation from three repeats.
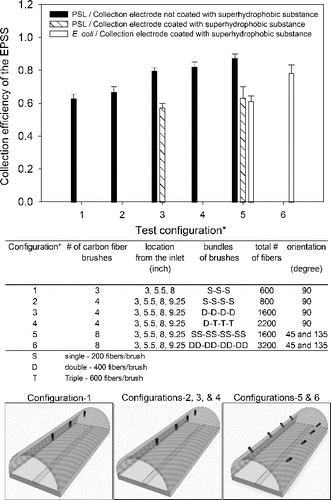
shows the EPSS collection efficiency when the following ionizer parameters were varied: number of carbon fibers per brush, total number of brushes, and location and orientation of the brushes relative to the cross-section of the EPSS. Overall, six different ionizer designs were tested. The experiments were carried out with and without superhydrophobic coating of the collection electrode (brass).
FIG. 5. Collection efficiency of the EPSS as a function of various carbon fiber charger designs: number of carbon fibers per brush, total number of brushes, and location and orientation of the brushes relative to the cross-section of the EPSS. The experiments were performed with 1 μm PSL or Escherichia coli bacteria. The EPSS was operated at 10 L/min sampling flow rates and -9 kV charging/collection voltage. Collection efficiency was determined by measuring particle concentration in the collection droplet relative to the reference particle concentration. The error bars represent the standard deviation from three repeats.
Collection of PSL Particles and E. coli
First, we investigated the effect of adding more carbon brushes in the EPSS along its air flow axis: configurations 1 (3 brushes) and 2 (4 brushes). Each brush had approximately 200 fibers. For configuration 1 and configuration 2, the collection efficiency was 63.0 ± 2.6% and 66.7 ± 3.5%, respectively. Next, we varied a number of fibers per brush: ∼200, ∼400, or ∼600 fibers. As shown in , the total number of fibers varied from 800 (configuration 2) to 1600 (configuration 3) to 2200 (configuration 4) and it yielded collection efficiencies of 66.7 ± 3.5%, 79.7 ± 2.1%, and 82.0 ± 3.0%, respectively. Apparently, increasing the number of fibers per brush improved the sampler's performance. The difference in collection efficiencies between configuration 2 (∼200 fibers per brush) and configuration 3 (∼400 fibers per brush) was statistically significant (p = 0.005). But the collection efficiency obtained using configuration 4 (one ∼400 fiber brush and three ∼800 fiber brushes) was not statistically significant from that of configuration 3 (four brushes, ∼400 fibers per brush) (p > 0.05). Since configuration 3 yielded a very good performance and required less material, it was chosen for further testing by modifying arrangement of the fibers.
Finally, the orientation of the ionizers was investigated: one row at 0º angle (12 o’clock position) versus two rows at 45 and 135º in the cross-section of the EPSS. The tests were carried out with or without superhydrophobic coating of the surface using 1.0 μm PSL particles. The collection efficiency of EPSS with uncoated collection electrode and with one row of fiber brushes (configuration 3: ∼1600 fibers) was 79.7 ± 2.1%, and it increased to 87.3 ± 2.7% when the same number of carbon fibers (∼1600) was distributed in eight brushes in two rows (configuration 5). This difference was statistically significant (p < 0.05). When the collection surface was coated with superhydrophobic substance, the collection efficiency increased from 57.2 ± 2.7% (configuration 3) to 63.3 ± 6.7% (configuration 5). In this case, the difference was not statistically significant (p > 0.05). Thus, for both superhydrophobic and regular collection surface, about a 10% relative improvement in the collection efficiency was seen when using two rows (4 brushes/row) of fiber brushes with ∼200 fibers/brush as compared to one row of 4 brushes (∼400 fibers/brush), most likely due to better mixing of ions and particles. Surprisingly, the collection efficiencies with superhydrophobic coating of the collection electrode were relatively lower by 22–24% compared to the collection efficiency observed without the superhydrophobic coating. We believe the superhydrophobic coating acted as an insulator on top of the conductive electrode thus reducing the electrostatic field strength and decreasing collection efficiency of the EPSS.
Remaining experiments were carried out using E. coli bioaerosols and charger configuration 5 (). About 61.3 ± 3.2% of biological particles were deposited on the collection electrode coated with the superhydrophobic substance and removed by a rolling sterile deionized water droplet. Since adding more carbon fibers to individual brushes increased the collection efficiency for PSL particles, we modified configuration 5 (∼1600 fibers) by doubling the number of fibers in each brush (configuration 6, ∼3200 total fibers). In this case, the collection efficiency when using a collector coated with the superhydrophobic material increased to 78.1 ± 5.1%.
The results presented in clearly show that superhydrophobic coating has a substantial and negative effect on the EPSS collection efficiency when compared to using a noncoated collection electrode. This drop in collection efficiency could be compensated by increasing the number of carbon fibers (, configuration 6), but this would require more construction material. As an alternative, the EPSS collection efficiency was investigated with eight different electrodes made of materials with different electrical conductivity (). The electrical properties of those materials are presented in Table S1. It seems that the observed collection efficiencies are inversely correlated with the electrical conductivity of the material. The collection efficiency data in could be divided into four groups: copper (18.8 ± 3.5%), brass (28.1 ± 3.7%), steel alloys exclusive of stainless steel (average efficiency 49.4 ± 2.8%), and stainless steel and pressed carbon fiber (average efficiency 80.4 ± 2.1%). The differences among the four groups were statistically significant (p < 0.001), while the four different types of steel alloys (plain steel, zinc plated steel, high carbon steel, and alloy steel) were not significantly different (p > 0.05). The results presented in show a trend similar to that found by Yun et al. (Citation2013) in which the collection efficiency of a polymer-arrayed collector increased as the resistivity (inversely proportional to conductivity) of the conductive ink covering a polyethylene terephthalate (PET) film (i.e., the electrode) increased. Similar to the setup used by Yun et al. (Citation2013), the conductive material in our setup (EPSS collection electrode) was covered by a substance (superhydrophobic material) substance and we observed a similar trend.
FIG. 6. Collection efficiency of the EPSS as a function of the electrode material: copper, alloy 360 brass, alloy 1020 steel, zinc-coated steel, alloy 1090 steel, alloy 8630 steel, 304 stainless steel, and pressed carbon fiber. The electrodes were covered with the superhydrophobic substance. The EPSS was operated at 10 L/min sampling flow rates and -9 kV charging/collection voltage. The tests were performed with 1.0 μm PSL, and the collection efficiency was determined based on the amount of PSL particles accumulated in a 40 μL water droplet compared to the reference PSL concentration. The error bars represent the standard deviation from three repeats.
The resultant EPSS Mark II design shown in was used to investigate the performance of the EPSS when collecting E. coli as a function of different parameters (). As can be observed from a, the average collection efficiency for the 20 μL and 40 μL droplets was 84.1 ± 2.7% and 84.6 ± 4.6%, respectively. This difference was not statistically significant (p > 0.05). b shows that the collection efficiency for airborne E. coli concentrations of ∼107/m3 and ∼109/m3 was 84.6 ± 4.6% and 79.0 ± 3.5%, respectively. The difference was also not statistically significant (p > 0.05). According to c, the collection efficiency at sampling flow rates of 10 L/min and 25 L/min were 79.2 ± 3.5% and 48.2 ± 1.3%, respectively; the difference was statistically significant (p < 0.05). At higher sampling flow rates, the particles spend less time inside the EPSS and thus their chance of being deposited on the collection electrode decreases, especially if they carry a relatively lower electrical charge. When sampling time was increased from 10 to 60 min, the average collection efficiency with 40 μL water droplet decreased from 84.6 ± 4.6% to 71.7 ± 4.4%, and the difference was statistically significant (p < 0.05). The observed decrease in the collection efficiency as sampling time increased may have been due to a less efficient removal of the deposited particles by the water droplet after their prolonged contact with the collection electrode; these findings are similar to our previous study (Han et al. Citation2010). Thus, according to , the Mark II configuration of the EPSS can achieve collection efficiency of up to 85% when sampling E. coli at 10 L/min for 10 min.
FIG. 7. The final version of the EPSS Mark II made of static dissipative material. The sampler incorporates a particle charger with eight carbon brushes (400 fibers/brush) arranged in two rows, a pressed carbon fiber electrode (254 × 3.2 × 2.5 mm), and a sharp-edge inlet.
FIG. 8. Collection efficiency of the EPSS when sampling E. coli as a function of (a) water droplet size, VWD (20 μL versus 40 μL), (b) concentration of airborne bacteria, CN (∼107/m3 versus ∼109/m3), (c) sampling flow rate, QS (10 L/min versus 25 L/min), and (d) sampling time, t (10 min versus 60 min). The applied collection voltage was -9 kV for all experiments. The collection efficiency is based on the total number of bacteria collected in the 1st water droplet relative to the airborne concentration of bacteria. The error bars represent the standard deviation from three repeats.
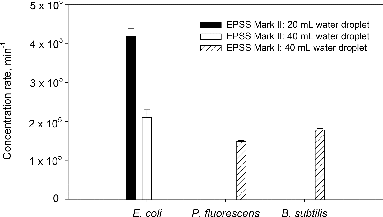
presents the concentration rates based on the collection efficiency data presented in and the results obtained with the EPSS Mark I (Han and Mainelis Citation2008; Han et al. Citation2010). For the 20 or 40 μL collection droplet and a sampling flow rate of 10 L/min, the concentration rate for the EPSS Mark II was 4.2 × 10⁵/min and 2.1 × 10⁵/min, respectively; this is approximately twofold higher than the concentration rate of the EPSS Mark I. The EPSS Mark I was able to achieve 10-fold or higher concentration rates when sampling P. fluorescens and B. subtilis bacteria compared to conventional liquid-based bioaerosol samplers. However, the Mark I version did not have its own charger, and a commercial ionizer used to charge particles upstream of the collector resulted in particle losses of up to 50% (the Mark I data presented here take that these losses are taken into account). The EPSS Mark II, however, features an integrated charger and collector, and its design was optimized to achieve high collection efficiency. In addition, since the collection efficiency measurements are based on the particle quantity accumulated in the droplet (actual sample), any potential losses inside the sampler are taken into account. The described sampler concept features high sample concentration rate (min−1), and that should reduce the sampling time needed to detect airborne particles and enable detection of low particle concentrations.
FIG. 9. Comparison of the concentration rates between the EPSS Mark I and the EPSS Mark II when sampling bacteria (E. coli., P. fluorescens, and B. subtilis). The concentration rate is based on the number of bacteria collected by the 1st rolling water droplet (20 or 40 μL). The EPSS Mark I operated at -7 kV collection voltage applied to its brass electrode, and 12 V/50 mA was applied to a separately-operated ionizer. For the EPSS Mark II, -9 kV was applied to its pressed carbon fiber electrode and integrated carbon fiber ionizers. Both samplers operated at 10 L/min sampling flow rates and 10 min sampling time. The error bars represent the standard deviation from three repeats.
The presented tests did not include investigations of sampler's effect on culturability and DNA intactness of the collected bacteria. These questions will be addressed in further research.
CONCLUSIONS
The electrostatic precipitator with superhydrophobic surface (EPSS) was modified and optimized to the Mark II version so that it could achieve higher concentration rates compared to the Mark I version. Use of the single-stage design integrated the particle charger with collector and avoided losses due to particle charging that were encountered in the Mark I version which had a separate charger and collector. Use of eight carbon fiber brushes and a collection electrode made of pressed carbon and covered by superhydrophobic fiber electrode achieved high concentration rates (up to 4.2 × 10⁵/min).
These results were obtained with bench-scale components, such as large power supplies, liquid injection via pipetting, and use of external pumps. For the application and testing of this technology in the field, the sampler components (chargers, collectors, a battery-operated air mover, batteries, power supplies, and DC-to-DC converter) must be integrated into a field-deployable instrument which will be the next step of the project.
SUPPLEMENTAL MATERIAL
Supplemental data for this article can be accessed on the publisher's website.
UAST_A_1017040_Supplemental_Information.zip
Download Zip (17.3 KB)FUNDING
The publication was supported by the grant R01OH009783 “Design of Advanced Electrostatic Sampler for Total Bioaerosols” from CDC-NIOSH. Its contents are solely the responsibility of the authors and do not necessarily represent the official view of the CDC-NIOSH.
Related Research Data
REFERENCES
- Adhikari, A., Jung, J., Reponen, T., Lewis, J. S., DeGrasse, E. C., Grimsley, L. F., et al. (2009). Aerosolization of Fungi, (1→3)-β-d Glucan, and Endotoxin from Flood-Affected Materials Collected in New Orleans Homes. Environ. Res., 109:215–224.
- Douwes, J., Thorne, P., Pearce, N., and Heederik, D. (2003). Bioaerosol Health Effects and Exposure Assessment: Progress and Prospects. Ann. Occup. Hyg., 47:187–200.
- Fung, F., and Hughson, W. G. (2008). The Fundamentals of Mold-Related Illness: When to Suspect the Environment is Making a Patient Sick. Postgrad Med., 120:80–84.
- Han, T., O’Neal, D. L., McFarland, A. R., Haglund, J., and Ortiz, C. A. (2005). Evaluation of Mixing Elements in an L-Shaped Configuration for Application to Single-Point Aerosol Sampling in Ducts. HVAC & R Res., 11:657–672.
- Han, T., and Mainelis, G. (2008). Design and Development of an Electrostatic Sampler for Bioaerosols with High Concentration rate. J. Aerosol Sci., 39:1066–1078.
- Han, T., An, H. R., and Mainelis, G. (2010). Performance of an Electrostatic Precipitator with Superhydrophobic Surface when Collecting Airborne Bacteria. Aerosol Sci. Technol., 44:339–348.
- Han, T., Nazarenko, Y., Lioy, P. J., and Mainelis, G. (2011). Collection Efficiencies of an Electrostatic Sampler with Superhydrophobic Surface for Fungal Bioaerosols. Indoor Air., 21:110–120.
- Henningson, E. W., and Ahlberg, M. S. (1994). Evaluation of Microbiological Aerosol Samplers: A Review. J. Aerosol Sci., 25:1459–1492.
- Hinds, W. C. (1999). Aerosol Technology. Wiley, New York.
- King, M. D., and McFarland, A. R. (2011). Bioaerosol Sampling with a Wetted Wall Cyclone: Cell Culturability and DNA Integrity of Escherichia coli Bacteria. Aerosol Sci. Technol., 46:82–93.
- Lee, B. U., and Kim, S. S. (2003). Sampling E. coli and B. Subtilis Bacteria Bioaerosols by a New Type of Impactor with a Cooled Impaction Plate. J. Aerosol Sci., 34:1097–1100.
- Madsen, A. M., and Sharma, A. K. (2008). Sampling of High Amounts of Bioaerosols Using a High-Volume Electrostatic Field Sampler. Ann. Occup. Hyg., 52:167–176.
- McCartney, H. A., Fitt, B. D. L., and Schmechel, D. (1997). Sampling Bioaerosols in Plant Pathology. J. Aerosol Sci., 28:349–364.
- McFarland, A. R., Haglund, J. S., King, M. D., Hu, S., Phull, M. S., Moncla, B. W., et al. (2010). Wetted Wall Cyclones for Bioaerosol Sampling. Aerosol Sci. Technol., 44:241–252.
- Pillai, S. D., and Ricke, S. C. (2002). Review/Synthèse Bioaerosols from Municipal and Animal Wastes: Background and Contemporary Issues. Can. J. Microbiol., 48:681–696.
- Roux, J.-M., Kaspari, O., Heinrich, R., Hanschmann, N., and Grunow, R. (2013). Investigation of a New Electrostatic Sampler for Concentrating Biological and Non-Biological Aerosol Particles. Aerosol Sci. Technol., 47:463–471.
- Tan, M., Shen, F., Yao, M., and Zhu, T. (2011). Development of an Automated Electrostatic Sampler (AES) for Bioaerosol Detection. Aerosol Sci. Technol., 45:1154–1160.
- Wang, Z., Reponen, T., A. Grinshpun, S. L., Górny, R., and Willeke, K. (2001). Effect of Sampling Time and Air Humidity on the Bioefficiency of Filter Samplers for Bioaerosol Collection. J. Aerosol Sci., 32:661–674.
- Wittmaack, K., Wehnes, H., Heinzmann, U., and Agerer, R. (2005). An Overview on Bioaerosols Viewed by Scanning Electron Microscopy. Sci. Total Environ., 346:244–255.
- Yao, M., Mainelis, G., and An, H. R. (2005). Inactivation of Microorganisms Using Electrostatic Fields. Environ. Sci. Technol., 39:3338–3344.
- Yun, S. J., Min, B. R., and Seo, Y. (2013). A Novel Polymer-Arrayed Electrostatic Precipitator with Electrical Resistance Material for the Removal of Fine Particles. J. Aerosol Sci., 57:88–95.
- Zhen, H., Han, T., Fennell, D. E., and Mainelis, G. (2013). Release of Free DNA by Membrane-Impaired Bacterial Aerosols Due to Aerosolization and Air Sampling. Appl. Environ. Microbiol., 79:7780–7789.