
Abstract
We have developed a new, fully controlled filter testing device and have used it to measure size-resolved penetration through a typically used filtration media for (but not only) atmospheric aerosol sampling. Twenty membrane and fiber filter pieces (mixed cellulose ester filters, polytetrafluoroethylene filters, quartz fiber filters, glass fiber filters, and polycarbonate filters) of various manufacturers and filter codes were examined. High variability in the penetration curve shapes, most penetrating particle size (MPPS) (from 20 nm to 90 nm) and penetration maxima (from 0.001% to almost 100%) has been found. The dependence of pressure drop on face velocity generally agrees with theory, the comparison of penetration at various face velocities proved the theoretical equations being able to determine MPPS only partially correctly. Although the variability within an individual filter of the same code is not negligible, it is small compared to the differences between the various filter types. The results not only differed from the information provided by the manufacturers, but in many cases also provided information otherwise unavailable, although affecting the sampling and also the ability of comparison with theory. To have enough information for the proper choice of the filter for a given purpose, it would be necessary to have not only total penetration given from the DOP standard measurement, but the MPPS, penetration maximum value and pressure drop as well.
Copyright 2015 American Association for Aerosol Research
1. INTRODUCTION
Aerosol filtration is the most widely used process to capture aerosol particles (Hinds Citation1999). It is used in such diverse applications as emissions cleaning, occupational safety and health, or air conditioning. In aerosol science, filters are used either for aerosol sampling or for the production of particle-free air via high-efficiency particulate air (HEPA) filters.
The information available from filter manufacturers, the background material for a decision on which filter to use for specific purposes, is usually not detailed enough. The description, if available at all, typically includes characteristics like filter type, thickness, wettability, air resistance, and porosity (Millipore Citation2001). However, the only information concerning aerosol particle penetration is the di-octylphalate (DOP) total penetration. As stated in (Dickenson Citation1997), during this test, a defined amount of DOP (with polydisperse aerosol having maximum of size distribution at the diameter of 0.3 microns and a concentration of 66.6 ppm by weight) is added to the air stream. Then, the aerosol concentration is measured upstream and downstream of the filter by a photometer determining light extinction. Similar measurement procedures are also performed during standardized filter testing according to EN 1822 for EPA, HEPA, and ULPA filters. Unfortunately, an analysis based on the standardized methods provides only limited information about the penetration of the tested filter media, although this information can be of great importance, as it can affect the sampling.
Considering both the importance of filters for ongoing aerosol research and the unsatisfactory description of the filters’ filtration efficiency, the aim of this work is to determine size-dependent penetration through the filter materials of the filters most often used in aerosol research, and summarize the information available so that enough description of the filters would be available for the decision on which filter to use for a specific purpose.
So far, only a few such studies have been published, but these experiments differ from our approach in two basic aspects. First of all, the penetrating particles covered size ranges mostly over 1 micrometer (Sakano et al. Citation2000; de Freitas et al. Citation2006). Even if the submicron range was taken into account as well, either the size resolution was not detailed enough owing to the usage of impactors (Pszenny et al. Citation1993), or the evaluation was done in wide size intervals, not considering monodisperse particles at all (Lieberman and Scott Citation1973; Cyrs et al. Citation2010) or only a narrow size range was explored (for example from 10 to 100 nm in Steffens and Coury [Citation2007a,Citationb] or 3 to 20 nm in Kim et al. [Citation2006]). Thus, we decided to determine the submicron size-resolved penetration in a quite wide size range, between 20 and 400 nm. Second, in most of the papers (Steffens and Coury Citation2007a,Citationb; Boskovic et al. Citation2008; Cyrs et al. Citation2010), only one or two filters (four in Wang et al. Citation2006, Citation2008; also in Japuntich et al. Citation2006) were investigated, while we have taken 20 of them into account, covering several types of filtration materials, pore sizes, pressure drops, etc. Our approach is similar to those in Liu and Lee (Citation1976) but we did not focus only on membrane filters, but compared the fibrous filters as well. Moreover, we have taken the most common filters for aerosol sampling, easily commercially available and widely used. This choice provides a higher probability that the results could help the broader aerosol community acquire deeper insight into the research already conducted.
Some information on the filter properties and characteristic can be found also in the classic aerosol books, for example, Hinds (Citation1999) or Baron and Willeke (Citation2001). We compare our results to these, and update some of the described details to the filters typically available on the market.
2. MATERIALS AND METHODS
2.1. Filters
Both fibrous and membrane filters were measured in this study. From the fibrous group of filters, glass and quartz fibers were studied; from membrane filters, porous membranes (mixed cellulose ester filters, Teflon membrane filters) and also capillary pore membrane filters were selected for the study. List of all the filters used in this study, together with all information commonly available from manufacturers, can be found in .
TABLE 1 The list of measured filters and their porosity and DOP values (as available from manufacturers)
2.2. Experimental Setup
Even though commercial filter testers exist on the market (e.g., Automated Filter Tester 3160, TSI), we have developed our own filter testing instrument (), allowing us complex and more detailed control of all the experimental conditions and adjustments.
FIG. 1. The schematics of the filter tester used in this study.
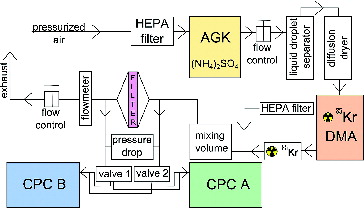
Our filter tester (made in the Laboratory of Aerosol Chemistry and Physics, Institute of Chemical Process Fundamentals [ICPF]) consists of four main parts: aerosol generator, particle size separator, filter holder, and two particle detectors.
The challenging particles for the filters were generated by a commercial nebulizer (AGK 2000, Palas). All the filters were challenged with the same type of aerosol particles: nebulized from an ammonium sulfate solution (1 g/l), with the AGK operating under the pressure of 2 bars. Ammonium sulfate was chosen for the dodecahedron shape of the generated particles. Under these conditions, a monomodal distribution of the generated particles was obtained, with the concentration peaking at 95 nm (a geometric standard deviation of 1.67).
The second part of the filter tester is based on a DMA (Vienna type, made at the ICPF workshop) with an active length of 11 cm built into a home-made electrostatic classifier. In the DMA, a monodisperse aerosol is separated. The classifier includes an 85Kr neutralizer (10 mCi), and a closed-loop sheath air flow equipped with flow, temperature, and pressure sensors. The sheath air flow is controlled by the means of a critical orifice to the flow of 5 lpm. The aerosol flow is maintained on 1 lpm, and is checked periodically by air flow calibrator (Gilibrator-2, Sensidyne). The sizing system was checked against a commercial instrument (EC 3080, DMA 3081, TSI), with differences in sizing below 10% over the whole size range.
Third, the selected monodisperse aerosol fraction is neutralized via a second 85Kr neutralizer (10 mCi), and after dilution in the mixing volume, it goes through the filter kept in a filter holder designed at the ICPF, capable of accommodating 47 mm filters. The holder is made from stainless steel to divert free charges, and thus suppress the effects of the filters charging on the penetration.
Finally, two identical ultrafine condensation particle counters (CPC) (UCPC 3025A, TSI) are located upstream and downstream of the filter holder, measuring aerosol number concentrations upstream and downstream of the filter simultaneously.
Constant flow rates were maintained via a Leckel sampler (KFG LVS-3 Single-Filter Gravimetric Sampler, Enviro Technology) with a flow rate of 38.3 lpm (2.3 m3 h−1), resulting in the face velocity of 40 cm/s. This flow rate was chosen with respect to the similarity to the conditions during the DOP testing and typical flow rates used during particulate matter (PM) PM10/2.5/1 samplings. For measurements with lower flow rates, a standard vacuum pump and a needle valve for flow adjustment were used. The flow rate is registered, as well as the pressure drop across the filter, measured with pressure gauge (GMH 3151, Greisinger), continuously during the measurement, controlling the integrity of the filter, and fit of the filter in the filter holder. The whole system is controlled by an in-house LabVIEW code, operating the electrostatic classifier, CPCs, electromagnetic switching valve system, data recording, and penetration evaluation.
Apart from maintenance of the main system components, several further precautions are taken. First, large drops are removed from the system in the liquid droplet separator and the aerosol flow is dried by passing through a diffusion dryer. Second, corrections for differences in the counting efficiencies of individual CPCs (about 15% after a careful calibration) are taken into account. The position of both CPCs alters each measurement, using three-way electromagnetic valves, i.e., each of the instruments measures both upstream and downstream of the filter for every measured particle size. The position altered due to the measurement error compensation; more on that topic in Section 2.3. Third, zero count checks were done prior to each of the measurement, both upstream and downstream the filter holder with filter. Zero volts were applied to the DMA, thus no particles could pass through the DMA. The zero counts checked at both of the CPC were signs of no system leakage. Finally, great care was paid to the control of the concentration stability. At the beginning of each measurement, a waiting time for concentration stabilization was set up, and there was another check of the stability of the concentration at the end of each 1-min scan.
In comparison to the filter testers available on the market, our system has several benefits. First of all, our filter tester system has been fully developed in our lab, which results in a full control of all important parameters of the system. Moreover, all the important parts of the tester are exchangeable in order to better adapt the system for individual measurement needs (different generated particles, measurement range, sensitivity of detectors, etc.). Second, our system gives not only total penetration, but detailed size-resolved penetration results allowing the determination of the real MPPS (most penetrating particle size). Third, our system allows corrections for possible differences in measurement of the two detectors, not depending on any initial calibration or estimation of a correction factor, and also to take into account changing concentration of particles challenging the filter throughout the whole measurement. And last but not the least, our system is less expensive compared to commercially available systems.
2.3. Data Evaluation
As already stated in Section 2.2, two CPCs were used in this study. The measurement position (upstream or downstream of the filter) of each CPC was altered during every measurement. Thus, the alternations were also taken into account during data evaluation.
All the results in this aticle are displayed in a form of size-dependent penetration P. The penetration is complementary to the filter efficiency F via the definition:
[1]
Taking advantage of the alternation of the CPCs, the penetration P of the challenging particles of one size passing through (penetrating) the filter material was determined as:
[2] where cx,y, x = {1,2}, y = {A,B}, denotes the concentrations measured on CPC A or CPC B measuring upstream (1) or downstream of the filter (2).
To estimate the measurement uncertainties, a formula for the corresponding standard deviation was derived, based on EquationEquation (2)[2] error propagation:
[3] where cx,y, x = {1,2}, y = {A,B}, again denotes concentrations measured on CPC A or CPC B measuring upstream (1) or downstream of the filter (2), and σx,y, x = {1,2}, y = {A,B}, denotes the standard deviation of these measurements.
The minimum measurable penetration of the filter testing system is limited by the detection limit of the CPCs used—in our case, it corresponds to a penetration of 0.00001% (or a filtration efficiency of 99.99999%).
Each of the data points presented here consists of at least two replicates; the number of replicates depends on the downstream concentration. If the concentration behind filter was over 1000 #/ccm, only two replicas were measured; with the decreasing concentration behind the filter, the number of the replicates increased up to 10, if the downstream concentration was below 1 #/ccm. This rule was applied on each of the particle size measurements separately.
The size range of the size-resolved measurement was set from 20 nm to 400 nm; the minimum was limited by the low concentrations of the generated aerosol, and the maximum was given by the possibilities of the short DMA and chosen sheath air flow rate. The measurement scheme had two parts. The first part, common for all the measured filters, consisted of an almost fixed scheme (measuring in the following sequence of sizes: 20—35—50—70—100—200—250—300—350—400 nm) covering all the particle sizes of interest, i.e., the smallest particles, sizes around MPPS (in the vast majority of cases between 50 and 100 nm) and the largest particles studied in DOP tests as well. The second part was the measurement of two more points around MPPS. Thus, the overall scheme varied slightly with each filter, as the MPPS was not the same for all the filters. Moreover, in some cases, the concentration of particles >300 nm in diameter (and sometimes even smaller) downstream of the filter was below the detection limit of our instrument, and the penetration could not be determined. Thus, some of the measurement points on the right-hand side of the spectra had to be omitted in the data evaluation process.
3. RESULTS AND DISCUSSION
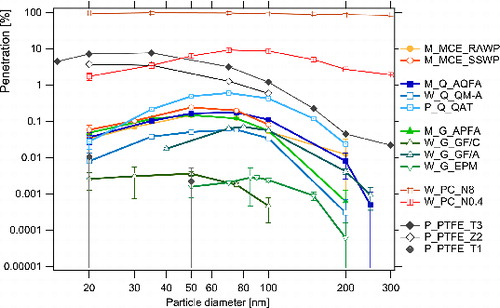
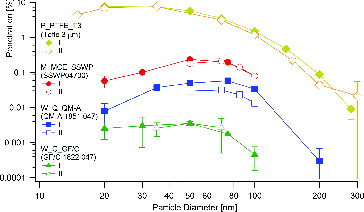
Penetrations of particle sizes between 20 and 300 nm through all the measured filters are presented and discussed in this section. The measured penetration showed a large range (), starting from glass fiber filters having penetrations between 0.001 and 0.1%. Quartz and mixed cellulose filters exhibited penetrations of similar magnitude, about 0.1%. A penetration of up to 10% was measured through the PTFE filters, and the highest penetration was found for the PC filters. Variability among filters of the same type is not negligible. On the other hand, it is small compared to the differences between the various filter types ().
FIG. 2. Size-resolved penetration of submicron particles challenging the filter media.
From the penetration curves (), the most penetrating particle sizes (MPPS) were computed. The MPPS were determined by IGOR software from the position of the maximum on the penetration curve by fitting lognormal peak shape given in the form:
[4] where y0 is a baseline, A amplitude, x0 peak position, and w the width of the peak. If the x0 value was below 20 nm, this MPPS was not considered, and the 20 nm was used instead. Both MPPS and widths of the curves are listed in .
TABLE 2 Maxima of penetration, MPPS and fit widths, and pressure drops (at the face velocity of 40 cm/s) for all measured filters
MPPS were smaller than 90 nm for all the filters, and a strong dependence of the MPPS on filter type was found. The smallest MPPS were found to be for PTFE filters. Surprisingly, there was not any strong dependence on pore sizes; all the measured PTFE filters had an MPPS below 30 nm. It is probably due to the very low thickness of the filtration material, and hence short resident time, suppressing diffusion losses. Similarly, a small variability in MPPS was found for MCE filters, where the MPPS only changed between 53 and 63 nm. A small span of MPPS was also found for quartz fiber filters, from 59 to 68 nm. Higher variability was observed in MPPS for glass fiber filters, showing MPPS from 36 to 86 nm, and for PC filters with MPPS 41 and 80 nm.
From the lognormal fitting, not only MPPS were computed, but penetration maxima were registered as well. The penetration maxima differ between the measured filter media by about four orders of magnitude (). In , the penetration maxima were given into context with MPPS and pressure drop (at the 40 cm/s face velocity). For some of the filters (for example, W_PC_N0.4), the pressure drop at this flow rate would be so high (about 20 kPa) that it was not possible to measure due to pump limitations. From the comparison, it is evident that information on penetration itself would not be sufficient—the scatter of connection of penetration and MPPS is significant (), as well as the scatter of connection of penetration and pressure drop (), not necessarily increasing with a decrease in penetration maximum.
FIG. 3. (a) The dependence of the penetration on the MPPS for individual filters, divided into groups according to the type of filtration material. (b) Same as (a) for the dependence of the penetration on the pressure drop. The filled area is only for better readability of the plots.
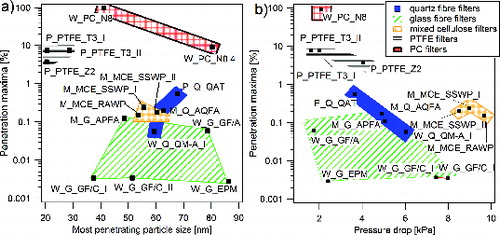
From the dependence of penetration on MPPS and pressure drop, four distinct groups of filters, each of them suitable for different use, can be estimated from our results. One group is formed by glass fiber filters with very low penetrations (0.003%), and wide variety of MPPS and pressure drop. In this group, negative correlation of MPPS and pressure drop was recorded—the larger is the pressure drop, the smaller is the MPPS. The second group consists of a wide variety of filter material: MCE, GF, and QF filters. The main criterion (considering only physical properties) for choice of the filter from this large group would be probably pressure drop, as the penetration differs only between 0.5 and 0.05%, and MPPS changes only from 49 to 79 nm. The connection of MPPS and pressure drop, however, cannot be applied here. To the third group belong PTFE filters, having very small MPPS and similar penetration, differing one from another only in pressure drop. The pressure drop not surprisingly increases with decreasing pore size. A separate group consists of PC filters with high penetration, varying MPPS, and strong dependence of pressure drop on pore size. Given the large fraction of submicron particles penetrating through the filter, the MPPS position is a secondary descriptive parameter, though.
3.1. Membrane Filters
3.1.1. Porous Membrane Filters
3.1.1.1. MCE Filters
From the point of characteristics of penetration, both MCE filters are interchangeable, with similar penetration maxima, penetration curve, and also the pressure drop ( and Figure S1 in the online supplementary information [SI]). What differs is the pore size. The 3 μm pores of M_MCE_SSWP and its higher penetration (0.25% at the MPPS) correspond to the lower penetration (0.15%) through M_MCE_RAWP having 1.2 μm pore sizes. The difference is quite small, though, and is comparable to the variability between the penetration through M_MCE_SSWP_I and M_MCE_SSWP_II ( and ).
FIG. 4. The dependence of the penetrations through a Zefluor 2 μm filter on face velocity. The lines only connect the measured data for better visualization of the data.
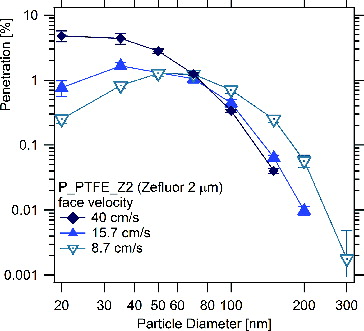
FIG. 5. The comparisons of the penetrations through various filters of the same types but of different batch numbers.
3.1.1.2. PTFE Filters
All PTFE filters exhibit a similar behavior from the point of the MPSS—the MPPS at or below 20 nm with quite a wide penetration maximum. The penetration of particles larger than 100 nm decreases considerably, showing the insufficiency of the DOP values given by the manufacturers for a proper filter characterization. For example, the DOP of P_PTFE_T3 is supposed to be 99.79% (a penetration of 0.21%), based on the total mass of 300 nm particles penetrating through the filter. According to our results, the 300 nm particles have a penetration of 0.021%. However, the maximum penetration is 8%, with the MPPS at 20 nm.
Although the shape of the penetration curve is similar for all the measured filters, the penetration depends strongly on pore size (Figure S2 in the SI). While 3 μm pore size filter has its penetration maximum of 8%, the 2 μm filter has the minimum at 4%, and the penetration of the Teflo filter with a 1 μm pore size was under the detection limit of our measurement system for most of the particle sizes. Another characteristic strongly dependent on pore size is the pressure drop across the filter. The smaller is the pore size, the higher is the pressure drop.
With the similar chemical composition and position of the MPPS, the crucial criterion to distinguish between the filters will be the face velocity of the sample. With high flows, it seems not to be practical to use the filters with small pore sizes.
3.1.2 Capillary Membrane Filters
3.1.2.1. PC Filters
The penetration of the polycarbonate filters was surprisingly high, for the W_PC_N8 even reaching a maximum of 97% (Figure S3 in the SI). This filter is usually used as a prefilter for aerosol sampling, having a 50% cut at 2.2 μm at 16.7 lpm (1 m3 h−1). Our results, however, show that there are significant losses of aerosol particles if the filter is used in the described way. For example, up to 20% of 300 nm particles can be captured on the filter. The second measured filter, the W_PC_N0.4, has a penetration maximum ten times lower, again proving the dependence of penetration on pore size. Compared to the porous membrane filters, the efficiency of PC filters of a similar pore size is considerably lower. Similar conclusions were drawn also in Liu and Lee (Citation1976). The shape of the penetration curve and also the MPPS position agrees quite well with quartz fiber filters, but the penetration maxima is about ten times higher.
3.2. Fibrous Filters
3.2.1. Quartz Fiber Filters
The penetration curves of the various quartz fiber filters produced by different manufacturers are surprisingly similar to one another, all of them reaching penetration maxima of about 60 nm at the given face velocity. Generally, the Whatman filters exhibit lower penetration than the Millipore filter (Figure S4 in the SI), although the given DOP results indicate the opposite. The M_Q_AQFA filter is supposed to have a DOP of 0.002% (), while according to our results, the penetration maximum is at 0.18%, and 300 nm particles have a penetration lower than 0.001%. The W_Q_QM-A filter, on the other hand, is supposed to have a DOP of 0.05% (), which agrees well with the measured penetration maximum, although not at 300 nm. On the contrary, the penetration of the 300 nm size could not have been determined (the concentration of particles downstream of the filter was below the detection limit of our instrument). The higher penetration maximum for the Pall filter corresponds to the worse DOP values given by the manufacturer.
3.2.2. Glass Fiber Filters
The results of the glass fiber filter measurements differ a lot (, Figure S5 in the SI). Two basic differentiations can be made—based on the penetration curve shape, and the maxima of penetration. First, considering the shape of the penetration curves, the M_G_APFA is similar to the W_G_GF/C, with quite flat maxima and an MPPS at about 50 nm. On the contrary, the W_G_GF/A and the W_G_EPM exhibit a much sharper shape of the curves, both with a maximum at about 80 nm. Second, the differences in penetration again show two well-distinguished groups. The penetration of the W_G_GF/C is however not similar to those of the M_G_APFA as before, but to those of the W_G_EPM filter (0.0035% and 0.0028% with an MPPS of 51.3 nm and 86.3 nm, respectively). The M_G_APFA agrees better with the W_G_GF/A (a penetration of 0.15% and 0.067%).
Although the described variability in the penetration results is considerable, with the description of filter material available (), it is not easy to explain and describe the exact reason for this behavior. Part of the variability of the W_G_EPM can be due to the different material of the filter; it is made from a 100% pure borosilicate glass of special purity, which can be another factor influencing the filter efficiency. Otherwise, the topic needs further analysis; and it is beyond the scope of this work.
4. REPEATABILITY AND INFLUENCE OF OPERATING PARAMETERS ON THE RESULTS
4.1. Dependence of Pressure Drop on the Face Velocity
Pressure drop as a function of face velocity approaching the filter was one of the measured parameters. The face velocities were changed in a wide range, from about 0.5 cm/s up to 40 cm/s.
First, representatives from each filter type group (fiber, porous membrane, and capillary membrane filters) were considered. Second, the dependence of filter pore sizes was examined. PTFE filters with 1, 2, and 3 μm pores were measured, as well as PC filters with 0.4 and 8 μm pores. For all the measured filters, as expected, the pressure drop dependence on face velocity was linear. Thus, only slopes of the linear fit were considered (with the intercept forced to be zero). All the results are presented in .
TABLE 3 Dependence of the pressure drop across the filter on the sample face velocity
Generally, low pressure drops were measured across fiber filters (quartz fiber filters exhibiting lower pressure drops than glass fiber filters) and larger pressure drops were found to be across MCE filters. Considering PTFE and PC filters, there is a further variability connected to the pore sizes. As expected, the strong relationship between increasing pore sizes and decreasing pressure drop can be clearly seen in , regardless of whether we take into account PTFE or PC filters. Comparing the two filter types, the PTFE filters show lower pressure drops than the PC ones (the pressure drop across a PC filter of 8 μm pore size is almost identical to the pressure drop across a PTFE filter of 3 μm pore size). This can be due to the differences between real and effective pore size in the PTFE filters.
The results in general agree with the results given in (Table 9-1 in Baron and Willeke Citation2001), describing porous membrane filters as those with the highest pressure drops. Our results show, however, that there is further variability in the membrane filters group, and moreover, that the pressure drops are not as high as that suggested in Baron and Willeke's Table 9-1. The pressure drop over MCE filters is only slightly higher than the pressure drop over some glass fiber filters (), and PTFE filters show the lowest pressure drops among all filters, even lower than that of quartz fiber filters, although (Baron and Willeke Citation2001) lowest pressure drops were found for fibrous filters.
4.2. Dependence of Penetration on Face Velocity
The majority of the measurements were done with the constant face velocity of 40 cm/s, although we are aware of the close relationship of the face velocity and the performance of filters. Thus, we have measured the size-dependent penetration through a Zefluor 2 μm filter for various face velocities—40, 17.5, and 8.7 cm/s (in other words, volumetric flows of 2.3, 1, and 0.5 cubic meter per hour)—to see the range and the character of the influence.
As expected, the efficiency of the filters varies with the face velocity (). However, the change is not constant over all the particle sizes. The strongest decrease was measured for the penetrating particles smaller than 50 nm in diameter, due to the enhanced diffusion. The influence is so intensive that it considerably alters the position of MPPS; with the increasing face velocity, the MPPS decreases. At the face velocity of 40 cm/s, the maximum of penetration, 3.7%, was found to be at the smallest particles of our measurement range (20 nm). At the face velocity of 15.7 cm/s, the maximum was found to be 1.7%, and there was a change also in its position as it moved toward larger particles (40.5 nm). A further decrease of the penetration maximum was observed with the measurement with a face velocity of 8.7 cm/s. The penetration decreased to 1.29%, and the penetration maximum shifted further to larger particles (60.22 nm).
The results were compared to the theoretical equation for the particle size of minimum efficiency dmin published in Lee and Liu (Citation1980):
[5] where Ku is Kuwabara hydrodynamic factor, α solidity, λ mean free path in the gas, k is the Boltzmann constant, T temperature, η is air viscosity, df fiber diameter, and finally U0 is the face velocity. As the information on solidity of the material was not available, it was measured by high-pressure mercury porosimetry, using AutoPore III (Micromeritics USA). From the measurement, the solidity was determined to 0.45. It is distinctly higher than the value for porous membrane filters given, for example, in Hinds (Citation1999), i.e., solidity between 0.15 and 0.30. During the porosimetry measurement, also the mean pore diameter was determined—9 μm, again not in an agreement with the expected value, i.e., the value according to the filter name (Zefluor 2 μm). The fiber diameter df was computed from the equation for pressure drop, see the SI for more details. The diameter was calculated as 6.95 μm, which is in accordance with another statement in Hinds (Citation1999), that the fiber diameters are slightly smaller than the pore size, although the equation was derived for solidities between 0.006 and 0.3, and the value 0.45 is out of the range. If the dmin were computed using EquationEquation (5)
[5] , however, they did not match our results; the position of minima increased with lower face velocities, but the values were shifted to higher particle sizes. Further, the single-fiber efficiency Ef was calculated, using equation given also in Lee and Liu (Citation1980):
[6] and from the single-fiber efficiency, the penetration P was determined, using the following equation:
[7]
Again, an overall agreement with measurement was found, but the exact values were strongly overestimating the penetration. The comparison can be seen in . The reason for the discrepancy is probably the solidity value for which the theoretical relationships are not valid (Eq. (S2)), and also the considered particle size, as Equations Equation(5)[5] and Equation(6)
[6] are valid only for 0.075 < λ/dp <1.3, i.e., for particles between 52 and 906 nm, so the real minimal values cannot be described.
TABLE 4 Comparison of computed and measured maximal penetration through the Zefluor 2 μm filter
As a next step, the penetration was computed for all the measured sizes, using EquationEquation (7)[7] with total single-fiber efficiency EΣ, considering interception, impaction, diffusion, interception of diffusing particles, and gravitational settling, computed according the Equations (S5)–(S11) in the SI. From the penetration curves, the MPPS and penetration maxima were computed () and compared to the measured values. The agreement with measured data was better (Figure S6 in SI), although most of the equations were valid for solidities between 0.005 and 0.2, and particles of sizes above 100 nm (Hinds Citation1999). The penetration decreases with the decreasing face velocity, and the maxima position are shifted toward larger particles; compared to the measured data, the maxima are given at larger particle sizes. Also, the overall penetration was about one order of magnitude higher than the measured values ().
From the comparison of the theory and measured data, two main conclusions can be drawn. First, the theoretical relationships can be applied to penetration and MPPS calculation, but some of the nowadays materials can have properties out of the ranges expected within the theory. Thus, only a partial agreement with the measurement can be achieved. Second, for the proper characterization of the filter material (for example, solidity and pore size), additional measurements are necessary, as the information provided from the manufacturers is not sufficient for the comparison with theory.
4.3. Dependence of Penetration on Filter Loading
The influence of the filter loading on the penetration, and also measurement mode was considered. The concentrations of particles upstream the filter were controlled in way that the single-count mode of the CPC with the coincidence correction was applicable for all samples. The concentrations upstream varied between 100 and 10,000 #/ccm, depending on the particle size.
To estimate the influence of loading on the filter performance, a Nuclepore 8 μm filter (W_PC_N8) and Tissuquartz™ Filter, 2500 QAT-UP (P_Q_QAT) were measured five times in a row under constant operating parameters (constant face velocity, the same number of particle sizes for each test, etc.). Moreover, the P_Q_QAT filter was weighted before and after the penetration measurements, to determine the mass of the challenging particles. During the test, 258 μg of ammonium sulfate was deposited on the filter. It is a similar value of deposit as for 24-hour sampling with a 2.3 m3 h−1 flow rate at a clean measurement site with PM10 concentrations of about 5 μg/m3.
The penetration through the P_Q_QAT filter was slightly decreasing in time (and with increasing filter loading) throughout all the measured sizes. In most of the measured points, however, the decrease is smaller than the uncertainty of the measurement (the difference between the highest and the lowest penetrations is about 5%). The very same result was found in W_PC_N8 filter results.
Stating this, two further important facts can be deduced. First, the small differences between the individual measurements proved the robustness of our method and the good reproducibility of the results. Second, as none of the measurements took more than a few hours (the maximum was 18 h for the earlier-mentioned P_Q_QAT), for the purposes of this study, the influence of filter loading on the penetration was considered negligible. This assumption may not be applicable when considering long-term measurements, when the exposition of the filtration material to the challenge aerosol is in orders of not only hours, but up to days, and/or if the aerosol concentrations, and thus the loadings on the filters are not in the range of microgram, but considerably higher.
4.4. Variability in the Filter Material
Most of the measurements were conducted on one piece of the filter of a particular code. In some cases, however, to evaluate the variability in individual filter pieces, filters of the same code, but with different batch numbers, were compared. The goal of the comparison was to estimate the variability connected not to the measurement method, but to the inhomogeneity of the filter material.
The variability between individual pieces of filters of the same code was found to be generally small as compared to the differences between the various filter types (). For most of the filters, the variability was only within the uncertainties of measurements, and thus negligible. The only exception seems to be the quartz fiber filter QM-A 1851-047. The value of the penetration maxima is 0.06 and 0.03, respectively. As the position of the maxima agrees well, it is assumed that the reason can be in the orientation or density of the fibers that can vary a bit between the individual pieces of the fiber filters.
5. CONCLUSIONS
A new, fully controlled filter testing instrument was developed and thoroughly tested, proving a good precision and reproducibility of the results. With the tested instrument, the measurements of typically used filtration materials for (not only) atmospheric aerosol sampling were conducted.
Twenty filter pieces of various types, manufacturers, and filter codes were examined. Both membrane and fibrous filters were measured, covering porous membranes (mixed cellulose esters, Polytetrafluorethylene), capillary pore membranes (Polycarbonate), and fibrous (quartz fibers and glass fibers) filters. For each of the filters, the penetration between 20 and 400 nm was measured, MPPS position and penetration maxima were calculated, and pressure over the filter was measured as well.
High variability in the penetration curve shapes, MPPS positions, penetration maxima, and also the pressure drops has been found. The MPPS were measured below 90 nm for all the filters, for some of the samples, the MPPS were even below our lowest measured particle size, i.e., 20 nm. The penetration maxima differ among the measured filter media by about four orders of magnitude. Also, the pressure drops vary significantly; for some of the filters it was not even possible to reach the desired face velocity due to the pump limitations.
To express the uncertainty of our results, the dependence of pressure drop and penetration on the face velocity was measured, the effect of loading was considered, and the variability in the filter material was tested. The dependence of pressure drop on face velocity generally agrees with results from classical aerosol books, proving the linear relationship between pressure drop and face velocity. The comparison of penetration at various face velocities proved the theoretical equations being able to determine MPPS only partially correct, as the values were shifted to the larger particles, and the penetrations were exaggerated compared to the measured data. The discrepancy could be explained by larger solidity value and smaller particles sizes than the ranges valid for the theoretical calculations. Effects of loading proved to be negligible on our results due to short measurement time and low loading. Variability within an individual filter of the same code is not negligible. On the other hand, it is small compared to the differences between the various filter types.
The presented information on the widely used filter material behavior, necessary for the choice of a suitable filter medium, is generally not available, and it in many cases even does not agree with the information given by the DOP tests provided by the manufacturers. To have enough information on the filter use, it would be necessary to have not only the DOP value (preferably penetration maximum value), but the real MPPS and pressure drop at a given face velocity as well. It is important to know the real MPPS (and ideally also the shape of the penetration curve) for every filter material type in order to estimate the efficiency of the sampling, with respect to uncertainty assessment. The information on pressure drop is also of great importance, as it can significantly affect the sampling, but the pressure drop across the filtration media does not necessarily increase with a decrease in penetration maximum. To be able to estimate the MPPS and penetration maximum from theory, it is necessary to conduct additional measurements, as solidity and pore size are usually not provided, and can be out of range applicable on the theoretical relationships.
SUPPLEMENTAL MATERIAL
Supplemental data for this article can be accessed on the publisher's website.
UAST_1020997_Supplemental_File.zip
Download Zip (693.4 KB)ACKNOWLEDGMENTS
The authors thank Mr. Sean Miller for his language corrections of the manuscript.
Funding
This work was supported by the Ministry of Interior of the CR under grant No. VF2010201513 (J. Ondráček) and by the Czech Science Foundation under grant CSF P503/12/G147 (N. Zíková). The authors would like to thank also Professor R. Holub from Clarkson University for the long-term loan of one UCPC, Š. Rychlík from the Czech Hydrometeorological Institute for providing some of the filter media, and H. Šnajdaufová from the ICPF for the high-pressure mercury porosimetry measurement.
Related Research Data
REFERENCES
- Baron, P. A., and Willeke, K. (2001). Aerosol Measurement: Principles, Techniques, and Applications, 2nd ed. Wiley, New York.
- Boskovic, L., Agranovski, I. E., Altman, I. S., and Braddock, R. D. (2008). Filter Efficiency as a Function of Nanoparticle Velocity and Shape. J. Aerosol Sci., 39:635–644.
- Cyrs, W. D., Boysen, D. A., Casuccio, G., Lersch, T., and Peters, T. M. (2010). Nanoparticle Collection Efficiency of Capillary Pore Membrane Filters. J. Aerosol Sci., 41:655–664.
- Dickenson, T. C. (1997). Filters and Filtration Handbook, Elsevier Advanced Technology, Oxford.
- De Freitas, N. L., Gonçalves, J. A S., Innocentini, M. D. M., and Coury, J. R. (2006). Development of a Double-Layered Ceramic Filter for Aerosol Filtration at High-Temperatures: The Filter Collection Efficiency. J. Hazard. Mater., 136:747–756.
- Hinds, W. (1999). Aerosol Technology: Properties, Behavior, and Measurement of Airborne Particles, Wiley, New York.
- Japuntich, D. A., Franklin, L. M., Pui, D. Y., Kuehn, T. H., Kim, S. C., and Viner, A. S. (2006). A Comparison of Two Nano-Sized Particle Air Filtration Tests in the Diameter Range of 10 to 400 Nanometers. J. Nanoparticle Res., 9:93–107.
- Kim, S. C., Harrington, M. S., and Pui, D. Y. H. (2006). Experimental Study of Nanoparticles Penetration Through Commercial Filter Media. J. Nanoparticle Res., 9:117–125.
- Lee, K. W., and Liu, B. Y. H. (1980). On the Minimum Efficiency and the Most Penetrating Particle Size for Fibrous Filters. J. Air Pollut. Control Assoc., 30:377–381.
- Lieberman, A., and Scott, R. D. (1973). Atmospheric Particle Penetration Through High Efficiency Filters. Powder Technol., 8:183–189.
- Liu, B. Y. H., and Lee, K. W. (1976). Efficiency of Membrane and Nuclepore Filters for Submicrometer Aerosols. Environ. Sci. Technol., 10:345–350.
- Millipore. (2001). Glass Fiber Filters. Available online at: http://www.merckmillipore.com/CZ/cs/product/Glass-%26-Quartz-Fiber-Filters,MM_NF-C255#anchor_DS
- Pszenny, A., Fisher, C., Mendez, A., and Zetwo, M. (1993). Direct Comparison of Cellulose and Quartz Fiber Filters for Sampling Submicrometer Aerosols in the Marine Boundary Layer. Atmos. Environ., 27A:281–284.
- Sakano, T., Otani, Y., Namiki, N., and Emi, H. (2000). Particle Collection of Medium Performance Air Filters Consisting of Binary Fibers Under Dust Loaded Conditions. Sep. Purif. Technol., 19:145–152.
- Steffens, J., and Coury, J. (2007a). Collection Efficiency of Fiber Filters Operating on the Removal of Nano-Sized Aerosol Particles II. Heterogeneous Fibers. Sep. Purif. Technol., 58:106–112.
- Steffens, J., and Coury, J. (2007b). Collection Efficiency of Fiber Filters Operating on the Removal of Nano-Sized Aerosol Particles: I—Homogeneous Fibers. Sep. Purif. Technol., 58:99–105.
- Wang, J., Chen, D. R., and Pui, D. Y. H. (2006). Modeling of Filtration Efficiency of Nanoparticles in Standard Filter Media. J. Nanoparticle Res., 9:109–115.
- Wang, J., Kim, S. C., and Pui, D. Y. H. (2008). Figure of Merit of Composite Filters with Micrometer and Nanometer Fibers. Aerosol Sci. Technol., 42:722–728.
- Yeh, H.-C., and Liu, B. Y. H. (1974). Aerosol Filtration by Fibrous Filters - I. Theoretical. J. Aerosol Sci., 5:191–204.