
Abstract
We describe a robust, compact, field deployable instrument (the CAPS PMssa) that simultaneously measures airborne particle light extinction and scattering coefficients and thus the single scattering albedo (SSA) on the same sample volume. With an appropriate change in mirrors and light source, measurements have been made at wavelengths ranging from 450 to 780 nm. The extinction measurement is based on cavity attenuated phase shift (CAPS) techniques as employed in the CAPS PMex particle extinction monitor; scattering is measured using integrating nephelometry by incorporating a Lambertian integrating sphere within the sample cell. The scattering measurement is calibrated using the extinction measurement. Measurements using ammonium sulfate particles of various sizes indicate that the response of the scattering channel with respect to measured extinction is linear to within 1% up to 1000 Mm−1 and can be extended further (4000 Mm−1) with additional corrections. The precision in both measurement channels is less than 1 Mm−1 (1s, 1σ). The truncation effect in the scattering channel, caused by light lost at extreme forward/backward scattering angles, was measured as a function of particle size using monodisperse polystyrene latex particles (n = 1.59). The results were successfully fit using a simple geometric model allowing for reasonable extrapolation to a given wavelength, particle index of refraction, and particle size distribution, assuming spherical particles. For sub-micron sized particles, the truncation corrections are comparable to those reported for commercial nephelometers. Measurements of the optical properties of ambient aerosol indicate that the values of the SSA of these particles measured with this instrument (0.91 ± 0.03) using scattering and extinction agreed within experimental uncertainty with those determined using extinction measured by this instrument and absorption measured using a multi-angle absorption photometer (0.89 ± 0.03) where the uncertainties are derived from best estimates of the accuracy of the two approaches.
Copyright 2015 American Association for Aerosol Research
INTRODUCTION
Measurement of the single scattering albedo (SSA) of an aerosol particle requires the measurement of at least two of the three optical components (scattering, absorption, extinction). Despite substantial advances in optical property measurements over the last five decades, there are still several challenges associated to measuring each of these components, which propagate into large uncertainties in the reported SSA values. In particular, aerosol optical absorption is a difficult measurement to perform both directly and indirectly (via the difference method); it often comes with large uncertainties caused by corrections that need to be applied when using filter methods and to error propagation when using difference methods (Sheridan et al. Citation2005; Lack et al. Citation2008, and references therein). Nephelometry has been the common way to measure aerosol scattering (Heitzenberg and Charlson Citation1996); however the well known truncation issues of commercial nephelometers can greatly affect the uncertainty of the scattering measured by such techniques (Anderson and Ogren Citation1998; Massoli et al. Citation2009, and references therein).
Early efforts to measure the particle SSA on the same sample volume (Gerber Citation1979a,Citationb) required particle pre-concentration because of limited sensitivity for extinction. Thus, in order to measure total particle extinction under ambient conditions, the atmospheric scientist had little choice but to obtain separate absorption and scattering measurements as measuring extinction requires extremely long pathlengths (see Zhao et al. Citation2014). However, with the development of optical loss techniques such as cavity ring-down (CRD) (Moosmüller et al. Citation2005; Baynard et al. Citation2007) and cavity attenuated phase shift (CAPS) (Kebabian et al. Citation2007; Kebabian and Freedman Citation2007), the user community now has ready access to accurate and precise direct extinction measurements as well. The first reported instrument to measure both scattering and extinction on the same sample volume using cavity-enhanced techniques employed a laser-based CRD extinction measurement and a cosine-corrected detector for the scattering channel (Strawa et al. Citation2006). Thompson and co-workers took a similar approach but replaced the cosine-corrected detector with a nephelometer employing an integrating sphere (Dial et al. Citation2010), the concept of which was previously described in Varma et al. (Citation2003) and Abu-Rahmah et al. (Citation2006). And most recently, Zhao et al. (Citation2014) have employed incoherent broad-band cavity-enhanced spectroscopy (IBBCEAS) and an integrating sphere to directly measure the SSA of ambient aerosol. A somewhat different approach has been developed by Sharma et al. (Citation2013 and references therein) who coupled a photoacoustic spectrometer and nephelometer to measure absorption and scattering, respectively.
We describe a single scattering albedo monitor (CAPS PMssa) that combines airborne particle extinction and scattering measurements (and thus SSA) on the same sample volume in one instrument with rapid, real-time response. This monitor is based on cavity attenuated phase shift spectroscopy (CAPS), a form of cavity-enhanced absorption spectroscopy (Herbelin et al. Citation1980; Engeln et al. Citation1996; Scherer et al. Citation1997; Ball and Jones Citation2003; Brown Citation2003). In the current implementation, CAPS technology provides a far simpler, more compact, lower cost alternative to CRD-based systems (Baynard et al. Citation2007) by replacing the laser with a light emitting diode (LED) and transient measurement electronics with low-cost demodulation (“lock-in”) circuitry with no loss in sensitivity or accuracy (Kebabian et al. Citation2005, Citation2007; Kebabian and Freedman Citation2007, Citation2008; Massoli et al. Citation2010; Petzold et al. Citation2013). The CAPS PMssa monitor also incorporates an integrating sphere within the measurement cell, thus providing a simultaneous measurement of scattered light on the same sample volume using integrating nephelometry. The ratio of the scattering-to-extinction measurements provides a direct, rapid measure of the total particle SSA. This configuration offers three major advantages over the use of two separate instruments to measure SSA: (1) there is no need for a wavelength correction; (2) sampling configurations are greatly simplified, minimizing potential sampling errors; and (3) the scattering is calibrated using the extinction measurement and thus the accuracy of the SSA measurement is independent of the absolute accuracies of both measurement channels.
In this article, we provide an overview of the instrument, how it operates and an initial consideration of its strengths and weaknesses. We provide a physical description of the monitor followed by a summary of its operating principles which differ somewhat from previous attempts to couple extinction and scattering measurements. We present results concerning a correction to the extinction channel required by the use of a purge flow (Petzold et al. Citation2013), calibration of the scattering channel, an Allan analysis of the monitor precision, and measurements of the scattering truncation for non-absorbing particles. We then present a comparison of SSA measurements obtained directly with this monitor and using a combination of extinction from this monitor and absorption from a multi-angle absorption photometer (MAAP) (Petzold and Schonlinner Citation2004) for ambient air. We conclude with a discussion of the measurement uncertainties associated with this instrument.
MONITOR DESIGN
The CAPS PMssa monitor is expressly designed to integrate simultaneous measurement of the extinction of the optical beam by an aerosol sample and light scattered from the light beam by the aerosol on the same sample volume. The measured total particle extinction, , and scattering,
, coefficients directly determine the single scattering albedo,
, by
where λ indicates that the single scattering albedo is wavelength dependent.
We first discuss the particle optical extinction measurement. As reported in previous communications (Kebabian et al. Citation2005, Citation2007; Kebabian and Freedman Citation2007), the CAPS-based extinction measurement involves the use of a LED as a light source, a sample cell incorporating two high reflectivity mirrors (R ∼ 0.9999) centered at the wavelength of the LED (which provides a long effective pathlength) and a vacuum photodiode detector (Hamamatsu R645); a 10-nm wide optical filter is also used to further define the measurement wavelength. The square wave modulated light (typically 17 kHz) from the LED passes through the sample cell and is detected as a distorted waveform which is characterized by a phase shift (∼35–40°) at the fundamental frequency of the initial modulation. The amount of that phase shift is a function of fixed instrument properties – cell length, mirror reflectivity, and modulation frequency – and of the presence of scattering/absorbing species.
In order to perform the scattering measurement, the monitor also operates as an integrating nephelometer—the particles are illuminated by a collimated light beam (i.e., the beam used to measure extinction) and the resulting scattered light is collected at all angles (except at extreme forward and backward directions because of openings for the probe beam to enter and exit) using a 10-cm diameter integrating sphere which is incorporated into the center section of the optical cell. The integrating sphere is coated with a thermally stable, waterproof Avian D white reflectance coating (Avian Technologies, http://aviantechnologies.com) which provides a Lambertian reflectance surface with a reported 98% efficiency over a wavelength region from the near ultraviolet to the near infrared. A PMT module (H7828-01, Hamamatsu), incorporating both a high voltage power supply and an amplifier/discriminator, records the scattered light, the output of which is collected by a counter circuit. The use of the integrating sphere (Varma et al. Citation2003) serves two purposes. The first is to maximize the collection of scattered light at the photomultiplier tube which views scattered light from the optical cell at right angles to the optical beam. The second is to minimize the light collection bias with respect to angle.
The instrument uses a robust, inexpensive LED light source. Unlike the highly collimated light beam in laser-based CRD systems, the light from the LED is not well collimated and thus there is substantial background scattering during the LED-on phase. We therefore gate the scattering signal accumulation counter so that it is operating only when the LED is off. This mode of operation is made possible by the fact that the use of a low-loss cavity provides substantial optical circulating power (monitored with the vacuum photodiode detector) within the cavity for several microseconds after the LED is turned off, a function of the 35–40° phase shift in the signal. The only light within the cavity when the LED is off is highly collimated – i.e., reflecting back and forth between the mirrors – and thus minimizes unwanted scattering from the monitor surfaces. A light baffle could be placed in front of the detector to ensure that all detected photons have made at least one bounce off the integrating sphere surface. However, given that the fractional area of the photocathode (15 mm o.d.) of the PMT used to detect the scattered light is quite small compared to the surface area of the sphere (0.006), this baffle is not employed here. Modeling of the sphere properties indicated that the variation of light collection efficiency as a function of scattering angle should be negligible (<1%).
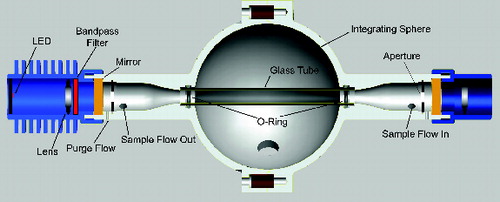
As shown in , the sample cell is similar to that used in the CAPS PMex particle extinction monitor (Massoli et al. Citation2010; Petzold et al. Citation2013), except for the inclusion of the 10 cm diameter integrating sphere. The distance between the mirrors is 26.2 cm and the total length of the sample cell including the optical components is ∼34 cm. The active sampling volume (i.e., the overlap of the optical beam with the sample) is ∼2.5 cm3. The cell is divided into two equal sections, allowing for the machining and coating of the inner surface of each hemisphere. When the two sections are attached to each other, a 10 mm i.d. glass tube, sealed with o-rings at each end, is inserted within the sphere region in order to keep the sample flow entrained along the extinction cell axis. The air sample flows into and out of the measurement cell at near atmospheric pressure and a flow rate of ∼850 ccm, then through a limiting orifice under choked flow conditions into a diaphragm pump. The two end sections contain inlets (7 mm apertures) for a gas purge (total flow ∼25 ccm) which prevents particulate matter from depositing on and contaminating the mirrors. The response time of the monitor is of the order of 1 s.
FIG. 1. Schematic of CAPS PMSSA particle single scattering albedo monitor. The integrating sphere in the middle of the cell is coated with Avian-D white reflectance paint which provides a Lambertian surface. The PMT module used to detect the scattered light lies along the axis orthogonal to the light beam. Some optical components as well as details of the purge flow have been deleted for clarity.
Monitor Operating Principles
Here we first summarize the principle of CAPS-based extinction measurements. Briefly, in the CAPS PMex monitor, the output from a modulated light source which has been transmitted through a resonant optical cavity is characterized by a phase shift, ϑ, with respect to the fundamental frequency of the modulation signal. This phase shift depends on the reflectivity of the input and output mirrors (R), the modulation frequency (f), the length of the cell (L), and the loss of optical power caused by the presence of a scatterer(s) and/or absorber(s) within the optical path (Kebabian et al. Citation2007):[1] where
[2] c is the speed of light and σi is the absolute extinction (in units of reciprocal length) associated with the ith scattering/absorbing species. Note that not only is this expression additive with respect to the presence of multiple scattering and/or absorbing species, but provides absolute total extinction values.
In the CAPS PMssa monitor, the light scattered from the particles is proportional to the circulating power inside the optical cavity at any given instant. shows the circulating power in the cavity as a function of time for a fixed modulation frequency and overall decay rate, k, a quantity proportional to the total optical loss in the system including the effects of the mirrors,[3]
FIG. 2. Modeled circulating power within optical cavity for square-wave modulation of the light source. The total period is 2T.
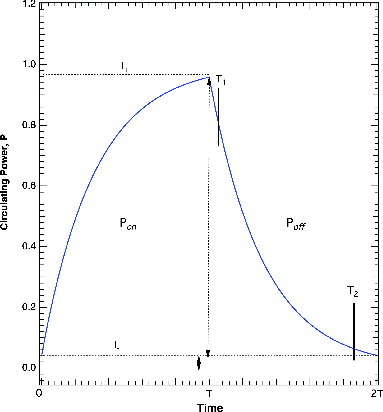
In order to properly normalize the measured integrated scattering signal to the integrated circulating power, one needs to integrate the area under this curve during the LED-off phase of the complete cycle. However, the monitor only records the integral of the circulating power over the entire measurement cycle. Thus, we must determine what fraction of the total circulating power persists during the LED-off phase using the experimentally available information.
With reference to , we define the following quantities:[4]
[5] where P is the circulating power, on and off refer to the LED state in the two parts of the measurement cycle, and Io is the limiting value of the circulating power at an infinitely long on-cycle. The intensities I+ and I− are the actual maximum and minimum values of the circulating power, respectively. Time t is measured from the start of the LED-on phase until time T, while t′ is measured from the start of the LED-off phase, T, to time 2T. Using Equations [4] and [5], the values of I+ and I− can be solved for in terms of I0 and the half-period time T,
and thus I+ + I− = I0. From the symmetry of the waveform, it follows that the average over a full cycle, Iave, which is the measured experimental variable, is[6]
Again referring to , the PMT (because of gating of its associated counter) only detects scattered light during the interval t′ = T1 to t′ = T2. These times are not coincident with the endpoints of the electrical drive to the LED for practical reasons. First, some time must be allowed after the end of the electrical drive for carriers in the junction of the LED to recombine and thus finish emitting light. Similarly, time must be allowed for the gate signal to disable the photon counter before the LED begins to emit again. Thus, the average rate, S, of detected photons is proportional to the scattering coefficient, σsp, and the average circulating power during the time between T1 and T2:
or[7] where C′ is a constant that includes factors such as the quantum efficiency of the PMT and the fraction of the scattered light that reaches the PMT after reflection from the walls of the integrating volume. Solving for the scattering coefficient, one obtains:
[8]
This expression gives σsp in terms of the ratio of two measured quantities, S and Iave, a dimensionless correction factor that is a function of the measured total decay rate, k, the timing parameters supplied to the counters and gate generators in the electronics (T1 and T2), and a constant C that is established by calibration. For operating conditions of practical interest, the factor within the denominator of the second square bracket, which is needed to correct for the fact that the counting period does not exactly coincide with the LED-off phase, is typically <1.05.
RESULTS
Geometry Correction for Extinction Measurement
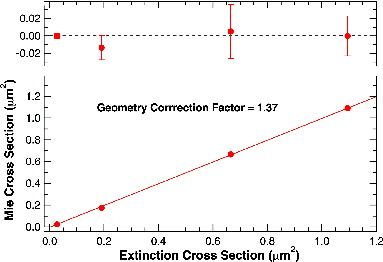
As noted in a previous publication on the CAPS PMex extinction monitor, the extinction value cannot be obtained by simply taking the difference in optical loss between an aerosol and particle-free samples because part of the optical path consists of a region used to purge the mirrors (Petzold et al. Citation2013). A smaller correction involves the dilution (3%) of the sample flow by the purge flow itself. We have found that the correction factor is best determined by measuring the absolute scattering cross section of monodisperse polystyrene particles (PSLs) over a range of particle diameters and extinction values and setting the correction factor such that the measured cross sections agree with those calculated by Mie scattering (Petzold et al. Citation2013). For CAPS PMex extinction monitors, the correction factor is 1.27.
In order to perform this measurement, PSLs were entrained in particle-free air using a Collison atomizer, dried using a silica gel column, and then size selected using a differential mobility analyzer (BMI, SEMS 2000) before entering the monitor. Monitoring of the output with an optical particle size counter (Grimm Model 1.109) did not show any (<0.1%) presence of multiply charged particles. The per particle extinction cross section is determined by dividing the measured extinction by the particle concentration as measured by a condensation particle counter (MCPC 1710, BMI). shows data from a PMssa monitor operating at 630 nm for PSL particles with diameters of 250, 350, 500, and 600 nm; a slope of 1.00 is reached after setting the correction factor to 1.37. The larger correction number obtained for the CAPS PMssa compared to the CAPS PMex is expected because of the slightly different cell geometry. Note that we plot the Mie values as the ordinate in order to highlight the point that the known uncertainty in the Mie calculation (calculated from the manufacturer's stated uncertainty of the mean diameter (±2%) of the PSL) is greater than the measured experimental precision of the extinction (discussed in a later section) and of the counting statistics of the CPC. One result of the new cell configuration is that the time response of the PMssa monitor is approximately 1 s, about half that of the PMex monitor.
FIG. 3. Plot of the calculated Mie scattering cross sections versus those measured using the PMSSA monitor at 630 nm. The geometry correction factor has been set to 1.37 in order to obtain a slope of 1.00. The error bars on the residual reflect the effect of the uncertainty of the mean particle size on the Mie calculation. The measured cross sections have a statistical uncertainty of ∼2%. The precision of the extinction cross section measurements are less than the width of the data point.
As a test of this new geometry correction, the extinction channel of the PMssa monitor was directly compared to a PMex monitor operating side-by-side at the same 630 nm wavelength using polydisperse ammonium sulfate particles over a range of 0–350 Mm−1. The two instruments agreed with each other to better than 3%, a margin well within the uncertainty of the accuracy (±5%) of the extinction measurements.
Scattering Calibration and Linearity Demonstration
A straightforward means of calibrating and demonstrating the linearity of the scattering measurement is to use a virtually pure scatterer, with SSA = 1, and compare the scattering signal to the simultaneous extinction measurement. Testing of the monitor's scattering channel was conducted using ammonium sulfate (AS) particles that were generated in particle-free air using a Collison atomizer, dried using a silica gel column, and then size selected using a differential mobility analyzer (BMI, SEMS 2000) before entering the monitor. The ratio of sheath flow to sample flow within the mobility analyzer was kept in the range of 7:1–10:1, ensuring fairly narrow size distributions (calculated at 3–4% FWHM). Particle concentrations were changed by varying the fraction of the total sample that flowed through a HEPA filter. For each particle concentration, the scattering signal, S, was measured while simultaneously recording the extinction values within the same PMssa monitor. The scattering signal was then normalized to the circulating power in the optical cell in the LED-off phase of the cycle to derive the uncalibrated scattering coefficient, σsp, using Equation (8). The scattering calibration constant, C in Equation (8), was determined by using a least squares fit to the extinction data from 0 to 600 Mm−1 with the assumption that the scattering was equal to the extinction (SSA = 1) in order to provide maximum accuracy at low extinction ranges.
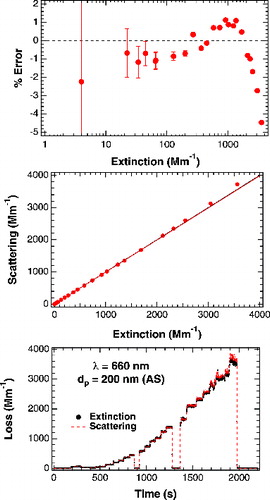
The data for 200 nm diameter ammonium sulfate particles using λ = 660 nm (far-red) light are shown in detail in . The bottom panel shows the time sequence of the data acquisition in both extinction and scattering channels at 1 s time resolution. The scattering data have been rescaled so that the slope of a least squares fit of the scattering to the extinction over a range of 0–600 Mm−1 is unity. Note that when taking periodic baselines (i.e., no particles), both readings return to zero within the precision of the instrument. A correlation plot of scattering to extinction is shown in the middle panel where the individual data points have been averaged (40–60 points) for a particular extinction value. There is excellent agreement between scattering and extinction out to extinction levels above 1000 Mm−1 but with noticeable deviation from linearity at extinctions approaching 3000 Mm−1. The top panel shows the percentage deviation from linearity on a semi-log scale so as to accentuate performance at low extinctions. The error bars represent the expected precision (1σ) of each measurement. For this particular monitor, the scattering reading is linear with ±1% of the extinction over a range of 0–1000 Mm−1, a result which has been repeated for multiple instruments operating at different wavelengths. If one takes into account the deviation from linearity at higher extinctions, the monitor can be readily used with confidence out to 4000 Mm−1, which is the practical limit at which one can obtain accurate extinction readings. The calibration factor for an individual instrument operating at a particular wavelength is independent of the particle index of refraction, shape, and size up to the point at which truncation becomes an issue (see following section).
FIG. 4. Bottom panel: Plot of scattering versus extinction measurements (1 s time resolution) as a function of time for 200 nm AS particles at a wavelength of 660 nm. Scattering data have been rescaled so that the slope of a least squares fit of the scattering versus extinction over a range of 0–600 Mm−1 is equal to 1.00. Middle panel: Correlation plot of data presented below that has been averaged (40–60 samples) for each particular extinction level. Also shown is a 1:1 line derived from 0 to 600 Mm−1 data which has been extended over the entire data range. Top panel: Deviation of the scattering measurement from the 1:1 line. Error bars represent the expected uncertainty based on the precision values measured in the following section. At higher extinction levels, the error bars are approximately the size of the data points.
We note that the scattering calibration constants change from instrument to instrument because of the variation in detector response (both PMT and vacuum photodiode). They might also vary over time because of aging effects of the LED, detectors, and interference filter used to define the measurement bandwidth. Another factor that might affect the scattering calibration over time is the use of the glass tube to keep the particle flow from filling the integrating sphere. Given that the glass has a non-conductive surface which might attract charged particles, it is possible that the glass could become somewhat opaque and affect the sphere's optical collection properties. How often recalibration is required is a question that can only be answered by prolonged field use.
Sensitivity
The performance of the CAPS PMssa instrument is primarily a function of short term noise characteristics and long-term stability, which reflects drift in every element in the instrument. A PMssa monitor employing a 630 nm LED was operated continuously with particle-free dry air flowing through the sample cell for almost 20 h without adjustment. Both extinction and scattering signals were corrected for changes in cell pressure and thus changes in air Rayleigh scattering. An Allan analysis of the data, which presents the standard deviation of the data as a function of integration time of the sampling, is shown in (Werle et al. Citation1993; Allan Citation1966). The noise demonstrated in the extinction channel and the baseline drift are quite comparable to what is observed in the PMex extinction monitor. The short term noise in the scattering channel is greater than that of the extinction channel. This is expected since the scattering channel signal incorporates additional noise from the measurement of total loss and LED light intensity as well as the photon scattering. However, the short term noise (1σ) is still less than 1 Mm−1 in the scattering channel at a measurement rate of 1 s. The baseline drift in the scattering measurement is negligible and thus does not contribute to the stability of the overall SSA determination. The monitor compensates for baseline drift in both channels with automated baseline subtraction on a time scale determined by the user and informed by the Allan analysis data shown in .
FIG. 5. (Top) Scattering measurements taken with the PMSSA (λ = 630 nm) period using particle-free air. (Bottom) Allan analysis plot of data shown in top panel as well as extinction data plotted as instrument noise versus integration time.
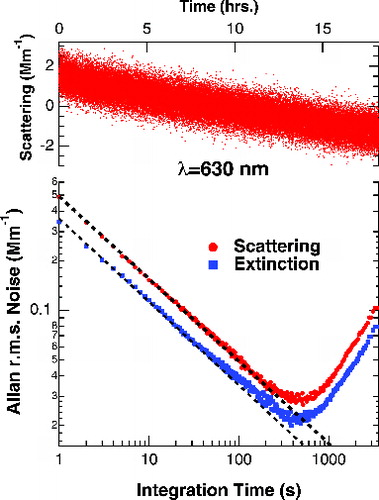
We note that the noise in the scattering channel will be a function of the wavelength of the instrument; performance is affected by all the elements of the monitor including the LED, mirrors and PMT and will vary from unit to unit. A monitor operating at 450 nm (blue) had slightly higher noise in the extinction channel but 50% higher noise in the scattering channel. However, the noise levels (1σ, 1s) are below 1 Mm−1 for all wavelengths.
Truncation
All integrating nephelometers exhibit a response bias which is a function of the sampled particles’ scattering phase function (i.e., angular distribution) (Bohren and Huffman Citation1998; Kebabian et al. Citation2012) The scattering phase function is governed primarily by particle size, but also shape and refractive index (both real and imaginary parts), for a given wavelength of light. The magnitude of the response bias depends on the geometry of the apertures used for the illumination light beam to enter and exit the measurement cell; scattering at forward and backward angles cannot be efficiently collected (Anderson and Ogren Citation1998; Moosmüller et al. Citation2003; Mueller et al. Citation2011). For very small particles (i.e., particles with diameters significantly less than the interrogation wavelength [<0.5λ]), this is not an important issue as the scattering phase function is relatively isotropic. However, as the particle size increases, and/or the particle shape becomes more irregular, and/or the imaginary refractive index (i.e., particle absorption) becomes finite, the scattering phase functions tend to become more forward and backward peaked, resulting in an increasing loss of scattered light (Anderson and Ogren Citation1998).
The trend with particle size is demonstrated in , where the absolute sensitivity of the scattering channel (using the calibration constant determined with AS particles, n = 1.53) is measured as a function of particle size for monodisperse polystyrene latex particles, PSLs (n = 1.59), using 450 and 630 nm LED light. The PSLs were generated in a fashion similar to that of the AS particles used in the calibration procedure (i.e., size selected using a DMA) in order to minimize passage of aggregate particles. Measurements of the size distribution of these particle streams using an OPC indicated that the distributions were truly monodisperse. No evidence of multiply charged particles at the 10−3 level could be discerned.
FIG. 6. Measured truncation in the scattering channel as a function of particle diameter using PSLs (nR = 1.59) both 450 and 630 nm. Also shown are fits to the data (solid and dashed lines, respectively) obtained by using a model that assumes that the truncation is entirely a property of the geometry of the scattering cell.
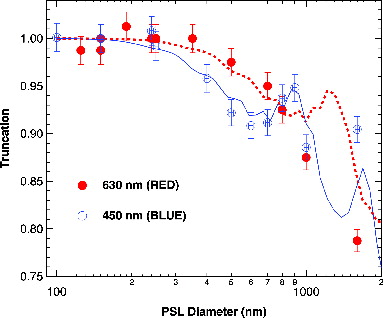
At λ = 630 nm, the measured truncation is flat up to dp = 350 nm and falls off slowly to a value of ∼0.79 at dp = 1600 nm. At λ = 450 nm, the falloff occurs more quickly, but a noticeable resonance occurs at a PSL diameter approximately twice the wavelength of the light. Inspection of the asymmetry parameter (a measure of the angular asymmetry of the scattering phase function) calculated from Mie theory indicates that the wavelength dependence of the observed resonances are a function of both the interrogation wavelength and the index of refraction of the particles.
In order to generalize these truncation measurements to other wavelengths and aerosol samples with arbitrary particle size distributions and indices of refraction, we modeled these results using Mie theory (Matzler Citation2002), taking into account the geometry of the scattering cell. The model assumes spherical particles and makes the additional assumption that light scattered from particles along the optical path within the scattering volume can be detected with equal efficiency except for light scattered into the entrance and exit of the scattering cell. We found that this approach over-predicts the truncation correction, something also noted by Qian, et al. (Citation2012) who employ a CRD system with similar geometry. Once we allowed the effective pathlength to slightly increase (10% or 1 cm) past the nominal boundaries of the scattering volume, the agreement between modeled and predicted truncation, shown in , improved. This observation is consistent with the idea that particles along the optical path that are slightly outside the nominal scattering volume are able to scatter light back into the scattering sphere. A complete description of the model is presented in the Appendix. A computer program that can calculate the truncation factor for monodisperse, log-normal, or otherwise arbitrary spherical particle size distributions will be made available to the user community.
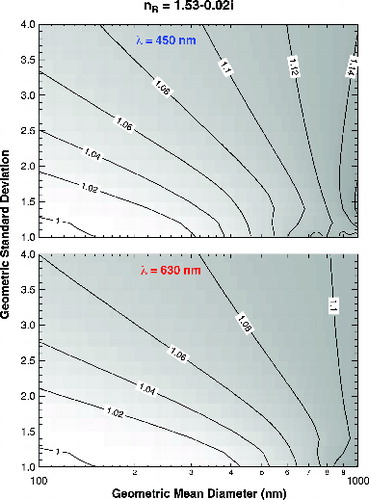
We used this model to calculate the CAPS PMssa truncation corrections for polydisperse distributions of particles within the Mie limit (i.e., homogeneous spherical particles). We chose an index of refraction of 1.53–0.02i as representative of ambient atmospheric particles and assumed log-normal size distributions. The choice of the real part of the refractive index is based on evidence from recent laboratory and field studies that indicate that the aged organic mixtures, which form ∼50% of ambient aerosol chemical composition, have indices between 1.50 and 1.55, comparable to the indices of inorganic sulfates and nitrates (∼1.53) (Lambe et al. Citation2013), moderately aged organic aerosols (Cappa et al. Citation2011), and Saharan mineral dust (Petzold et al. Citation2009). The magnitude of the imaginary part of the index was chosen such that the SSA ∼ 0.9 for typical atmospheric size distributions.
The results, plotted as a function of the geometric standard deviation (i.e., width of the distribution) and geometric mean particle diameter, are shown in . For the instrument-specific wavelength range (450–780 nm), there is a minimal truncation correction (<6%) for the typical accumulation mode particle size distributions commonly encountered under ambient conditions (dmean = 290 ± 60 nm; σmean = 2.02 ± 0.1) (John Citation2005). For measurements in the red (630 and 780 nm), where gas phase interferences are minimal, the estimated truncation corrections for typical ambient conditions are less than 4%. Using the same set of conditions, we have also investigated the effect of uncertainty in the real part of the refractive index on the truncation calculation. Varying the real part between over a range of 1.48–1.58 introduced a change in the truncation correction of only ±0.005.
FIG. 7. Contour plots of scattering truncation correction for PMSSA monitor assuming a refractive index of 1.53–0.02i at 450 nm (top) and 630 nm (bottom).
Ambient Measurements
The optical properties of ambient particles sampled from the roof of Aerodyne's building were measured using the CAPS PMssa (extinction and scattering) and a MAAP (Petzold and Schonlinner Citation2004). A grimm optical particle counter (OPC Model 1.109) was used to measure aerosol size distributions in order to allow for an accurate truncation correction. Particles were sampled through a sharp-cut cyclone impactor (Thermo Environmental) with a nominal 2.5 micron size cutoff at a total sample flow of 16.7 lpm. The sample flows routed to the PMssa and OPC were drawn through an isokinetic sampler as 90% of the sample flow went to the MAAP. All data were recorded at 1 s resolution. Over the course of the 5 days of sampling which were marked by snow events and very cold temperatures (−20 to 0°C), the data were dominated by comparatively short time duration plumes emanating from a major highway located approximately 400 m from the building.
Data collected from all instruments were integrated over 15 min intervals, a time duration required in order to overcome the lack of sensitivity of the MAAP and to remove the effects of differing time response of the instruments, especially for short time duration plumes. The scattering measurement of the PMssa was corrected for size-related truncation (a factor of 1.025) using an average particle size distribution determined by the OPC and the truncation model results shown in . Single scattering albedo values were calculated using the corrected scattering and measured extinction values from the PMssa monitor. SSA values were also calculated using the absorption data from the MAAP and the extinction values from the PMssa monitor (labeled MAAP_PMssa). shows histograms of both sets of data as well as the mean and median value of the distributions. The mean and median values for both measurement approaches agree within the estimated systematic error, although the MAAP_PMssa approach displays more skewness toward lower SSA values.
FIG. 8. Histogram of SSA values obtained using the PMssa monitor and a combination of the MAAP absorption data and the PMssa extinction data. Data were collected over 5 days (January 2014) in Billerica, MA, USA. Each distribution is normalized to unit area.
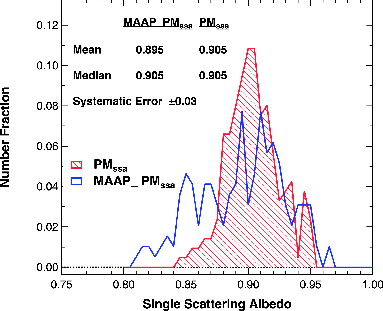
The estimated systematic error for the PMssa monitor (±0.03) is dominated by the uncertainty in the truncation correction (estimated at ±0.02) caused by ignorance of the true refractive index, the fact that size distribution data were not recorded during the complete data collection period, and uncertainties due to assumptions inherent in the truncation model. The additional ±0.01 is an adjustment for the possible error in the scattering calibration. The possible error in the MAAP_PMssa approach is dominated by the uncertainty in the absorption measurement provided by the MAAP. Petzold et al. (Citation2005) reported a deviation of ±12% of MAAP-based absorption measurement from that determined by subtracting nephelometer-based scattering from total extinction measurements each of which had their own uncertainties. Furthermore, the levels of absorption seen in the ambient data (typically a few Mm−1) are near the detection limit of the MAAP. Therefore, we assign an uncertainty of ±30% to the MAAP absorption data which translates into an uncertainty in the calculated SSA of ±0.03.
DISCUSSION OF MEASUREMENT UNCERTAINTY
The accurate determination of aerosol SSA is a critical parameter for atmospheric radiative transfer calculations used in climate change models (McComiskey et al. Citation2008; Kahn Citation2012). The question arises as to what are the preferred approaches to determining SSA, which, as always, simplifies to the question of instrument accuracy. The major advantage of the PMssa monitor is that the SSA value does not depend on the absolute accuracy of either the extinction or the scattering measurement as one is used to define the other. The data presented above indicate that over the measurement range of 0–1000 Mm−1, the SSA can be determined within 1% if there is no need for a truncation correction. All issues of correction for temperature and pressure, time response, sample heating, etc. or sampling related problems do not apply as they would if two independent instruments were being used. Furthermore, there is no need for any kind of wavelength correction (Strawa et al. Citation2006). An accurate truncation correction does require the simultaneous measurement of particle size distributions, a reasonable estimate of an average refractive index, the assumption of particle sphericity, and the application of the truncation model. Alternatively, two PMssa monitors operating at different wavelengths could be deployed and an Angstrom coefficient-based correction similar to that employed for nephelometers could be used (Anderson and Ogren Citation1998). The error associated with a truncation correction for sampling ambient aerosol, determined via size distribution measurements and the truncation model, contributes an additional ±2% in the error associated with the SSA. (The truncation correction for ambient aerosol is typically in the 2–8% range.) Therefore, the total uncertainty in the measured SSA is estimated at ±0.03 at SSA = 1 (an error which incorporates the truncation correction) and decreasing to ±0.01 as the SSA approaches zero, where the truncation correction becomes a negligible component. For small diameter particles, where no truncation error is required or under conditions where the size distribution and refractive index of the particles are very well characterized, the uncertainty in the SSA approaches 1% under all conditions.
The estimates for the uncertainties for all of the measurements derived from the CAPS PMssa instrument are summarized in . These uncertainties represent our best faith estimates under nominal ambient sampling conditions, but may underestimate the true uncertainties in the absolute accuracies if, for example, the sampled particles are not well represented by an average refractive index, the spherical particle assumption, or a log-normal size-distribution.
TABLE 1 Estimates and sources for error uncertainties for all of the measurements derived from the PMssa monitor
The use of two separate instruments to determine SSA brings into question the issue of the absolute accuracy of each instrument. All other things being equal, at high SSA (>0.7; more typical of ambient measurements), absorption is the preferred measurement to combine with extinction as an inaccurate absorption measurement has a much smaller effect on SSA than it would with a similarly inaccurate measurement of scattering. Conversely, the opposite is true at low SSA (<0.3; e.g., when measuring fresh emissions from combustion sources), where scattering and extinction are preferred as the uncertainty in any of the absorption techniques is far greater than that found in either extinction or scattering. Regardless of which case applies, it is difficult to argue that the SSA measured using two different instruments is less than 3% (or potentially higher) once all the sources of uncertainty, including sampling differences for the independent instruments, are taken into account.
The ambient measurements reported herein highlight two aspects in this discussion: (1) the CAPS PMssa instrument provided a robust and highly accurate SSA measurement of 0.91 ± 0.03, despite sampling under conditions where it would be advantageous having a direct measure of the smallest component (i.e., absorption), and (2) the MAAP absorption measurements had a relatively large uncertainty because of the low absorption values, yet provided a useful estimated uncertainty of the combined SSA measurements. While the two measurement methods provide essentially the same mean and median SSA values with very similar overall uncertainty estimates, the shape of the SSA distributions, shown in Figure 8, was observed to be different by the two methods. The PMssa instrument recorded a narrow (0.85–0.95), relatively well-defined (i.e., normal) SSA distribution over the five days of sampling, whereas the MAAP-PMssa-based extinction measurement combination produced a broader, flatter SSA distribution, with measured SSA values (0.8–0.85) distinctly below those observed by the PMssa instrument. While we cannot explain these differences in the histogram of 15 min average SSA measurements, we note that the potential for unintended sampling artifacts may have been an issue. Since the flow rates differed greatly between the CAPS PMssa (0.85 lpm), OPC (1.2 lpm), and the MAAP (14.65 lpm), we attempted to create isokinetic splits in the sample flow by choosing appropriate diameter tubing. It is unknown how effectively we were able to accomplish this.
Finally, we stress that the accuracy arguments presented above does not necessarily apply to the use of the PMssa monitor as a means of providing an absolute measurement of absorption by subtraction of scattering from extinction. At extremely low SSA (∼0.05), such as those associated with fresh soot emissions from aircraft jet engines (Petzold et al. Citation1999; Yu et al. Citation2011), the error associated with the scattering measurement becomes inconsequential and the absolute absorption by difference becomes fairly accurate (5%), limited only by the error associated with the extinction measurement. In this case, it should be more accurate than any direct absorption measurement. However, at high SSA (∼0.95), more typical of ambient samples, the uncertainty in the SSA (3%) translates into as much as a 60% uncertainty in the absolute absorption. At SSAs between these two extremes, the SSA uncertainty does not scale linearly between these values; for example, at an SSA of 0.5, the uncertainty is ∼13%, which still represents a reasonable uncertainty for non-filter-based absorption techniques. Another consideration is that uncertainties in optical properties depend on assessing the accuracy of the instruments under the actual measurement conditions. For instance, high humidity is known to cause problems with both scattering and absorption measurements employing nephelometers and photoacoustic spectrometers, respectively (Langridge et al. Citation2013), and standard truncation corrections become increasingly inaccurate as particle absorption increases (Massoli et al. Citation2009). Further quantitative insights into these issues await the development of an accurate particle absorption standard that can be used to evaluate these instruments, especially at longer wavelengths (>530 nm) where typical calibration gases such as O3 and NO2 cannot be used.
CONCLUSIONS
We have demonstrated the performance of a field deployable instrument, the CAPS PMssa, which provides the measurement of the SSA of airborne particulates in the PM2.5 range with a time response of the order of 1 s. An integrating sphere-based nephelometer, which provides the scattering coefficient component, is incorporated into a sample cell which utilizes cavity attenuated phase shift (CAPS) techniques to provide an absolute extinction coefficient measurement. While instruments operating at 450, 530, 630, 660, and 780 nm have been tested, the choice of measurement wavelength is limited only by the commercial production of specific-wavelength LED light sources, a lack of availability of suitable high reflectivity mirrors at short wavelengths (<400 nm), and detector photocathode materials at wavelengths above ∼800 nm.
This instrument was conceived to provide a comparatively low-cost alternative to both commercially available (nephelometers and filter-based absorption monitors) and research-grade (cavity ringdown-based extinction and photoacoustic absorption monitors) instrumentation for the measurement of particle optical properties without loss of sensitivity or accuracy. The existence of such an instrument can help fulfill the need – as also recently highlighted in the last Climate Change assessment report (IPCC Citation2013, Working Group I) – of making more geographically widespread and, possibly, more accurate and precise measurements of particle SSA, which is the key optical parameter that is ultimately used in radiative models to estimate the impact of aerosol particles on the global radiation balance. This article demonstrates that the CAPS PMssa can indeed provide a robust solution to this task. Challenges related to making accurate SSA measurements for different types of aerosols with different shapes and over a range of absorption properties remain. Such challenges are not unique to the instrument described in this article, and we anticipate that further characterization for different particle types is needed to improve the accuracy of the SSA measurements using the Aerodyne CAPS PMssa monitor.
FUNDING
The authors thank the U.S. Department of Energy, National Aeronautics and Space Administration, and the National Institutes of Health for financial support through the Small Business Innovation Research Program.
Related Research Data
REFERENCES
- Abu-Rahmah, A., Arnott, W. P., and Moosmüller, H. (2006). Integrating Nephelometer with a Low Truncation Angle and an Extended Calibration Scheme. Meas. Sci. Technol., 17:1723–1732.
- Allan, D. W. (1966). Statistics of Atomic Frequency Standard. Proc. IEEE, 54:221–231.
- Anderson, T. L., and Ogren, J. A. (1998). Determining Aerosol Radiative Properties Using the TSI 3653 Integrating Nephelometer. Aerosol Sci. Technol., 29:57–69.
- Baynard, T., Lovejoy, E. R., Pettersson, A., Brown, S. S., Lack, D., Osthoff, H., et al. (2007). Design and Application of a Pulsed Cavity Ring-Down Aerosol Extinction Spectrometer for Field Measurements. Aerosol Sci. Technol., 41:447–462.
- Bohren, C. F., and Huffman, D. R. (1998). Absorption and Scattering of Light by Small Particles. Wiley-VCH Verlag GmbH, Weinheim, Germany.
- Brown, S. S. (2003). Absorption Spectroscopy in High Finesse Cavities for Atmospheric Studies. Chem. Rev., 103:5219–5238.
- Ball, S. M., and Jones, R. L. (2003). Broad-Band Cavity Ring-Down Spectroscopy. Chem. Rev., 103:5239–5262.
- Cappa, C. D., Che, D. L., Kessler, S. H., Kroll, J. H., and Wilson, K. R. (2011). Variations in Organic Aerosol Optical and Hygroscopic Properties upon Heterogeneous OH Oxidation. J. Geophys. Res., 116:D15204, doi:10.1029/2011JD015918.
- Dial, K. D., Hiemstra, S., and Thompson, J. E. (2010). Simultaneous Measurement of Optical Scattering and Extinction on Dispersed Aerosol Samples. Anal. Chem., 82:7885–7896.
- Engeln, R., von Holden, G., Berden G., and Meijer, G. (1996). Phase Shift Cavity Ring-Down Absorption Spectroscopy. Chem. Phys. Lett., 262:105–109.
- Gerber, H. E. (1979a) Portable Cell for Simultaneously Measuring the Coefficients of Light Scattering and Extinction for Ambient Aerosols. Appl. Opt., 18:1009–1014
- Gerber, H. E. (1979b) Absorption of 632.9 nm Radiation by Maritime Aerosols Near Europe. J. Atmos. Sci., 36:2502–2512.
- Heintzenberg, J., and Charlson, R. J. (1996). Design and Applications of the Integrating Nephelometer: A Review. J. Atmos. Oceanic Technol., 13:987–1000.
- Herbelin, J. M., McKay, J. A., Kwok, M. A., Ueunten, R. H., Urevig, D. S., Spencer, D. J., et al. (1980). Sensitive Measurement of Photon Lifetime and True Reflectances in an Optical Cavity by a Phase-Shift Method. Appl. Opt., 19:144–147.
- IPCC (2013). Panel on Climate Change, Climate Change 2013: The Physical Science Basis. Contribution of Working Group I to the Fifth Assessment Report.
- John, W. (2005), Size Distribution Characteristics of Aerosols, in Aerosol Measurement, 2nd ed., P. A. Baron and K. Willeke, eds., Wiley and Sons, Hoboken, pp. 99–115.
- Kahn, R. (2012). Reducing the Uncertainty in Direct Aerosol Radiative Forcing. Surv. Geophys., 33:701–721.
- Kebabian, P. L., Herndon, S. C., and Freedman, A. (2005). Detection of Nitrogen Dioxide by Cavity Attenuated Phase Shift Spectroscopy. Anal. Chem., 77:724–728.
- Kebabian, P. L., Robinson, W. A., and Freedman, A. (2007), Optical Extinction Monitor Using CW Cavity Enhanced Detection. Rev. Sci. Instrum., 78:063102.
- Kebabian, P. L., and Freedman, A. (2007). System and Method for Trace Species Detection using Cavity Attenuated Phase Shift Spectroscopy with an Incoherent Light Source, U.S. Patent 7301639.
- Kebabian, P. L., Wood, E. C., Herndon, S. C., and Freedman, A. (2008). A Practical Alternative to Chemiluminescence-based Detection of Nitrogen Dioxide: Cavity Attenuated Phase Shift Spectroscopy. Environ. Sci. Technol., 42(16):6040–6045.
- Kebabian, P. L., Onasch, T. B., Wormhoudt, J., and Freedman, A. (2012). Doppler Spectrum Based Polar Nephelometer. Opt. Lett. 37:3654–3656.
- Lack, D. A., Cappa, C. D., Covert, D. S., Baynard, T., Massoli, P., Sierau, B., et al. (2008). Bias in Filter-Based Aerosol Light Absorption Measurements due to Organic Aerosol Loading: Evidence from Ambient Measurements. Aerosol Sci. Technol., 42:1033–1041.
- Lambe, A. T., Cappa, C. D., Massoli, P., Onasch, T. B., Forestieri, S. D., Martin, A. T., et al. (2013). Relationship Between Oxidation Level and Optical Properties of Secondary Organic Aerosol. Environ. Sci. Technol., 47:6349–6357.
- Langridge, J. M., Richardson, M. S., Lack, D. A., Brock, C. A., and Murphy, D. M. (2013). Limitations of the Photoacoustic Technique for Aerosol Absorption Measurement at High Relative Humidity. Aerosol Sci. Technol. 47:1163–1173.
- Massoli, P., Murphy, D. M., Lack, D. A., Baynard, T., Brock, C. A., and Lovejoy, E. R. (2009). Uncertainty in Light Scattering Measurements by TSI Nephelometer: Results from Laboratory Studies and Implications for Ambient Measurements. Aerosol Sci. Technol., 42:1064–1074.
- Massoli, P., Kebabian, P., Onasch, T. B., Hills, F., and Freedman, A. (2010). Aerosol Light Extinction Measurements by Cavity Attenuated Phase Shift Spectroscopy (CAPS): Laboratory Validation and Field Deployment of a Compact Aerosol Extinction Monitor. Aerosol Sci. Technol., 44:428–435.
- Matzler, C. (2002). MATLAB Functions for Mie Scattering and Absorption, Research Report 2002–08, University of Bern, Institut fur Angewandte Physik, Mikrowellen Abteilung. Available at:www.iap.unibe.ch/publications/download/201/en/.
- McComiskey, A., Schwartz, S. E., Schmid, B., Guan, H., Lewis, E. R., Ricchiazzi, P., et al. (2008). Direct Aerosol Forcing: Calculation from Observables and Sensitivities to Inputs. J. Geophys. Res., 113:D09202.
- Moosmüller, H., and Arnott, W. P. (2003). Angular Truncation Errors in Integrating Nephelometry. Rev. Sci. Instrum., 74(7):3492–3501.
- Moosmüller, H., Varma, R., and Arnott, W. P. (2005). Cavity Ring-Down and Cavity-Enhanced Detection Techniques for the Measurement of Aerosol Extinction. Aerosol Sci. Technol., 39:30–39.
- Muller, T., Laborde, M., Kassell, G., and Wiedensohler, A. (2011). Design and Performance of a Three-Wavelength LED-based Total Scatter and Backscatter Integrating Nephelometer. Atmos. Meas. Tech., 4:1291–1303.
- Petzold, A., Dolpelheuer, A., Brock, C. A., and Schroder, F. (1999). In Situ Observations and Model Calculations of Black Carbon Emission by Aircraft at Cruise Altitude. J. Geophys. Res., 22:171–181.
- Petzold, A., and Schonlinner, M. (2004). Multi-angle Absorption Photometer—a New Method for the Measurement of Aerosol Light Absorption and Atmospheric Black Carbon. J. Aerosol Sci., 35:421–441.
- Petzold, A., Schloesser, H., Sheridan, P. J., Arnott, W. P., Ogren J. A., and Virkkula, A. (2005). Evaluation of Multiangle Absorption Photometry for Measuring Aerosol Light Absorption. Aerosol Sci. Technol., 39:40–51.
- Petzold, A., Rasp, K., Weinzierl, B., Esselborn, M., Hamburger, T., Dörnbrack, A., et al. (2009). Saharan Dust Absorption and Refractive Index from Aircraft-Based Observations during SAMUM 2006. Tellus B, 61:118–130.
- Petzold, A., Onasch, T. B., Kebabian, P., and Freedman, A. (2013). Intercomparison of a Cavity Attenuated Phase Shift-based Extinction Monitor (CAPS PMex) with an Integrating Nephelometer and a Filter-Based Absorption Monitor. Atmos. Meas. Tech. 6:1141–1151.
- Qian, F., Ma, L., and Thompson, J. E. (2012). Modeling and Measurements of Angular Truncation for an Aerosol Albedometer. J. Eur. Opt. Soc., 7:12021.
- Scherer, J. J., Paul, J. B., O’Keefe, A., and Saykally, R. J. (1997). Cavity Ring-Down Laser Absorption Spectroscopy: History, Development and Application to Pulsed Molecular Beams. Chem. Rev., 97:25–51.
- Sheridan, P. J., Arnott, W. P., Ogren, J. A., Andrews, E., Atkinson, D. B., Covert, D. S., et al. (2005). The Reno Aerosol Optics Study: An Evaluation of Aerosol Absorption Measurement Methods. Aerosol Sci. Technol., 39(1):1–16.
- Sharma, N., Arnold, I. J., Moosmüller, H., Arnott, W. P., and Mazzoleni, C. (2013). Photoacoustic and Nephelometric Spectroscopy of Aerosol Optical Properties with a Supercontinuum Light Source. Atmos. Meas. Tech., 6:3501–3513.
- Strawa, A. W., Elleman, R., Hallar, A. G., Covert, D., Ricci, K., Provencal, R., et al. (2006). Comparison of In Situ Aerosol Extinction and Scattering Coefficient Measurements Made During the Aerosol Intensive Operating Period. J. Geophys. Res., 111:D05S03, doi:10.1029/2005JD006056.
- Varma, R., Moosmüller, H., and Arnott, W. P. (2003). Toward an Ideal Integrating Nephelometer. Opt. Lett., 28(12):1007–1009.
- Werle, P., Mucke, R., and Slemr, F. (1993). The Limits of Signal Averaging by Atmospheric Trace-gas Monitoring by Tunable Diode-Laser Absorption Spectroscopy. Appl. Phys. B., 57:131–113.
- Yu, Z., Ziemba, L. D., Wood, E. C., Herndon, S. C., Albo, S. E., Miake-Lye, R., et al. (2011). Direct Measurement of Aircraft Engine Soot Optical Properties using a Cavity-Attenuated Phase Shift (CAPS)-Based Extinction Monitor. Aerosol Sci. Technol., 45:1319–1325.
- Zhao, W., Xu, X., Dong, M., Chen, W., Gu, X., Hu, C., et al. (2014). Development of a Cavity-Enhanced Aerosol Albedometer. Atmos. Meas. Tech., 7:2551–2566, doi:10.5194/amt-7-2551-2014.
APPENDIX: PMssa TRUNCATION COMPUTATION
The truncation in the measured scattering light signal from a single particle is the ratio of the differential angular scattering efficiency, dQsca, integrated over all angles, θ, collected by the integrating sphere, to the total scattering efficiency, Qsca. The total scattering efficiency is a function of the wavelength of light, λ, the particle diameter, D, and the complex refraction index, M. The differential angular scattering efficiency is defined as[A1] where I is the unpolarized scattering intensity and x is the size parameter, defined as
[A2]
For a given wavlength, λ, and refractive index, M, the truncation function reduces to, in the limit of cylindrical symmetry:[A3] where ϑ1 and ϑ2, the integration limits of the scattering angle, are determined by the position of the particle along the flow axis.
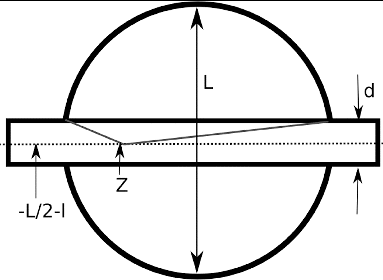
With reference to the sample cell geometry shown in , we define a coordinate axis z to be aligned along the axis of the tube where z = 0 is located at the center of the integrating sphere. We assume that only particles which lie on the tube axis contribute to the scattered light and that the system is symmetric about the z = 0 plane. The length of the effective light scattering region is defined as the diameter of the integrating sphere, L, and a smaller region, l, which extends beyond the boundaries of the integrating sphere. The inner diameter of the tube which confines the sample flow, is defined as d. For our particular geometry, the values for these variables are L = 10 cm, l = 1 cm and d = 1 cm.
FIG. A1. CAPS PMssa sample cell geometry. Particles transit horizontally through the central tube. L is the inner diameter of the integrating sphere (10 cm). The diameter of the tube is d (1 cm). The z integration is carried out over the interval z = −1/2 L - l to z = 1/2 L + l, where l is the “extra” length outside of the sphere (see text in main part of the article).
We can now define the limits of integration for light traveling in the positive z direction as a function of the position z along the tube axis as[A4]
Light traveling in the negative z direction is equivalent to our present calculation. Summing the contribution from light passing in both directions will just produce a factor of two times our current truncation value. This factor of two will also be present in the denominator of EquationEquation (A3)[3] . We can thus drop the factor of two.
In order to calculate the truncation, we integrate EquationEquation (A3)[A3] (again assuming a fixed wavelength, λ, and index of refraction, M) according to the limits presented in EquationEquation (A4)
[A4] :
[A5] where the end points of the z integration are defined as
and and
are defined in EquationEquation (A4)
[4] .
In practice, we recommend that the calibration of the monitor be carried out using small (100–200 nm) white (i.e., purely scattering) particles instead of non-absorbing gases, which are truly isotropic scatterers. The advantage of doing so is that the SSA can be measured more accurately since the ±5% uncertainty in the accuracy of the geometry correction for the extinction measurement is removed. Thus, the truncation calculated in EquationEquation (A5)[A5] must be further normalized to the truncation of the calibration particle, Trunc(D0). For real indices of refraction of atmospheric interest, the truncation factor, while not exactly unity, is quite flat for D0 < λ/2. Thus, the choice of D0 in the calculation is not materially important as long as it is chosen to be sufficiently small. The truncation calculation program provided with the monitor assumes that the calibration of the scattering channel is made using small diameter particles.