
Abstract
We investigated the effect of particle morphology on unipolar charging of nanowires. The average diameters of silver nanowires were 32, 48, and 68 nm. Particle electrical capacitance is an important parameter that determines the mean charge per particle in a continuum regime. We predicted that a nanowire has larger electrical capacitance than a sphere, and for a nanowire, the electrical capacitance increases as its diameter decreases. The mean charge per nanowire particle was calculated with the electrical capacitance obtained from theoretical analysis as a function of electrical mobility diameter. The mean charge per particle was measured for polystyrene latex particles with an electrical mobility diameter of 100–300 nm, and silver nanowires with an electrical mobility diameter of 200–400 nm. For a given electrical mobility diameter, the mean charge per particle of a nanowire in theoretical analysis and experiments was larger than that of a sphere, and it increased as the diameter of the nanowire decreased. Our results indicate that the mean charge per particle of a nanowire is dependent on particle morphology such as the diameter and the length.
Copyright 2015 American Association for Aerosol Research
1. INTRODUCTION
Particle morphology can affect the optical property (Djurišić and Leung Citation2006), filtration process (Son et al. Citation2014), and diffusion charging process (Shin et al. Citation2010). In particular, understanding the charging mechanism is the most important step in measuring the size of aerosol particles based on the electrical mobility theory. Charging of aerosol particles with ions has been investigated for a long time.
The unipolar charging properties of non-spherical particles are very different from the properties of spherical particles because particle morphology affects the electrical capacitance and surface area of the particles (Shin et al. Citation2010). The charging properties of non-spherical particles can be used to obtain morphology information about non-spherical particles combined with electrical mobility analysis (Shin et al. 2007, Citation2010; Wang et al. Citation2010; Liu et al. Citation2012). Diffusion charging properties of non-spherical particles have been investigated for unipolar and bipolar charging environments.
Regarding bipolar diffusion charging of fractal agglomerates, Ouf and Sillon (Citation2009) showed that fractal particles in the range of electrical mobility diameter dm = 0.01–0.5 μm have larger charging efficiency than spherical and cubical aerosol particles for a given electrical mobility diameter. Xiao et al. (Citation2012) found that compact diesel agglomerates with dm = 70–300 nm, which are more compact than the chain aggregates used in Lall and Friedlander's (Citation2006) theory, can show the electrical charging behavior similar to spherical particles.
Regarding the bipolar diffusion charging of fiber-like particles, Kulkarni et al. (Citation2009) investigated the bipolar diffusion charging characteristics of agglomerates of single-walled carbon nanotubes and the relationship between the electrical charge and the electrical mobility diameter in the range of dm = 100–1000 nm. The neutral fraction of single-walled carbon nanotube particles showed a significant deviation from the Boltzmann and Fuchs stationary charge equilibrium, which is 30–53% lower than that of spherical particles with the same electrical mobility. Ku et al. (Citation2011) investigated the equilibrium charging characteristics of carbon nanofibers and multi-walled carbon nanotubes in the bipolar atmosphere. In Ku et al.'s (Citation2011) study, the neutral fractions of carbon nanofibers and multi-walled carbon nanotubes were lower than the corresponding values of the Boltzmann distribution by 20–50% for dm = 300–700 nm.
Regarding unipolar diffusion charging properties of aggregate particles, Oh et al. (Citation2004) evaluated the unipolar diffusion charging characteristics of TiO2 particles with various morphologies. The researchers found that TiO2 aggregates can obtain 30% more charge than spherical particles in the unipolar diffusion charging process for a given electrical mobility diameter. Biskos et al. (Citation2004) carried out Monte-Carlo calculations on the unipolar diffusion charging of non-spherical particles, including rectangular particles, chain aggregates, and three-dimensional cross-shaped aggregates. For aggregate particles consisting of primary particles with an average diameter of 50 nm, the mean charge calculated from Monte-Carlo simulations appears to be approximately 10% lower compared with the dimensions of rectangular particles similar to aggregate particles. The unipolar charging behavior of fibrous particles with a rectangular cross section was shown to be dependent on their aspect ratio. Biskos et al. (Citation2005) showed that the mean charge per particle for monodisperse combustion aerosol particles with a diameter of 10–300 nm in the transition regime in the unipolar diffusion charging process is in good agreement with Fuchs’ limiting-sphere theory-based prediction results. Shin et al. (Citation2010) investigated the effect of particle morphology of agglomerate particles on unipolar diffusion charging. A new model that can predict the electrical capacitance of an agglomerate was developed using Lall and Friedlander's (Citation2006) and Brown and Hemingway's (Citation1995) models. Shin et al. (Citation2010) found that the mean charge of silver agglomerates is about 24% larger than that of silver spheres. Wang et al. (Citation2010) demonstrated that universal nanoparticle analyzer (UNPA) sensitivity, the current per particle in the unipolar charging process, can be used as an indicator of particle morphology, and the primary particle diameter can be obtained from fitting experimental data. In addition, the number concentration, surface area concentration, and volume concentration can be corrected with the primary particle diameter obtained from a fitting procedure. In addition, there is a very small dependence of unipolar diffusion charging on materials (Shin et al. Citation2009).
Regarding unipolar diffusion charging properties of fibrous particles, Yu et al. (Citation1987) showed that experimental results and theoretical predictions are in good agreement, although the measured number of charges on asbestos fibers with 0.3-μm average diameter and 3-μm average length is 5–10% lower than calculated from Laframboise and Chang's (Citation1977) theory. Han and Gentry (Citation1993a) showed that for iron fibers with an average diameter of around 0.15 μm and an average length of 50 μm, experimentally measured charge quantity is in good agreement with the theoretical prediction based on the continuum regime diffusional charging model. Numerical simulation results showed that the mean charge per particle for fibrous particles is 25% greater than for spheres with the same surface area as fibers. It was also found that the mean charge per particle for fibers is more quickly increased in the longitudinal direction by about 30% than in the equatorial direction when the continuum regime-charging model was used. Han and Gentry (Citation1993b) theoretically investigated the diffusion charging characteristics of both field charging and combined diffusional and field charging of fibrous aerosol particles in the continuum regime. Fibers with small diameter of 0.13, 0.15, and 0.17 μm and large diameter of 0.5, 1.0, and 1.5 μm were compared with spherical particles that had the same volume as the fibers. Fibers with small diameters had more charge than fibers that had a large diameter for equal volume spheres.
In this study, we investigated the unipolar diffusion charging of silver nanowires in the continuum regime. To understand the unipolar diffusion charging properties of nanowires, we present a new approach for estimating the mean charge per particle of nanowires as a function of electrical mobility diameter using a theory for the electrical capacitance of a cylinder. In our study, we used a unipolar diffusion charger that has been implemented in three commercial instruments (Electrical Aerosol Detector, TSI 3070A; Nanoparticle Surface Area Monitor, TSI 3550, and AeroTrak 9000; UFP Monitor, TSI 3031). The unipolar charger was also used in UNPA (Wang et al. 2010; Liu et al. Citation2012). This charger proved that particle loss can be minimized by eliminating the electrical field in the charging zone (Medved et al. Citation2000). We experimentally measured the mean charge of silver nanowires in the range dm = 200–400 nm, and that of spherical particles in the range dm = 100–300 nm.
2. THEORETICAL BACKGROUND
2.1. Chang's Theory for Non-Spherical Particles
Chang (Citation1981) re-examined Laframboise and Chang's theory for arbitrarily shaped particles, and provided simpler equations depending on the Knion. The charging behavior of a particle in the unipolar diffusion charging process is determined by the ionic Knudsen number Knion: the continuum regime (Knion 1) and the free molecular regime (Knion 1). The ionic Knudsen number is expressed as the ratio of the mean free path of ions λion to the particle diameter d,[1]
Chang's theory indicates that particle morphology can affect the unipolar diffusion charging of particles since the charging quantity is influenced by the surface area and electrical capacitance of a particle. Using Chang's theory, Shin et al. (Citation2010) modeled the mean charge per particle for agglomerate particles and showed that it is larger than that for spheres for a given electrical mobility diameter. Similar to Shin et al.'s (Citation2010) approach, we used Chang's theory for calculating the mean charge per particle of a nanowire.
We used 1.15 cm2/V for the ion mobility, 290 amu for the ion mass, and 12.7 nm for the mean free path of ions as ion properties for our calculations (Reischl et al. Citation1996). Since the silver nanowires used in our experiments were in the range of dm = 200–400 nm, the ionic Knudsen number, Knion = 0.0635–0.127 based on the electrical mobility diameter, meaning that silver nanowires belong to the continuum regime. In the continuum limit (Knion → 0), Chang (Citation1981) proposed that the mean charge per particle Np is determined with the following equation:[2] where
is the non-dimensional potential expressed by (e2Np)/(CpkT), Cp is the electrical capacitance, ϵ0 is the permittivity of the vacuum,
is the Boltzmann's constant, D is the ion diffusion coefficient, Ni is the ion concentration, e is the elementary electric charge, and t is the charging time. EquationEquation (2)
[2] indicates that the mean charge of the particle in the continuum regime is predominately determined by the electrical capacitance.
2.2. Electrical Capacitance of a Nanowire
The nanowires used in our experiments looked like a cylinder (). Thus, a model for the electrical capacitance of a cylinder can be used to estimate the capacitance of a nanowire. The electrical capacitance of a right circular cylinder has been investigated using numerical methods (Smythe Citation1956; Vainshtein Citation1963; Wang Citation1984). Smythe (Citation1956) calculated the capacitance for a relatively low aspect ratio ranging from 1 to 8 using an approximation technique. Vainshtein's (Citation1963) formula is suitable for a cylinder with an aspect ratio larger than 10. Since the nanowires used in our experiments ranged from 10 to 50, we used the capacitance of a nanowire Cp from the Vainshtein's (Citation1963) formula. Then the electrical capacitance of the nanowire is expressed as,[3]
FIG. 1. Schematic diagram for measuring the mean charge per particle.
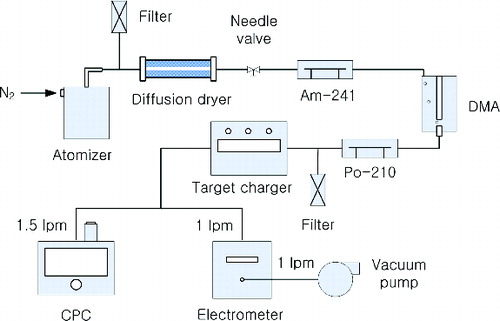
FIG. 2. SEM images of a silver nanowire (a) and dm = 200 nm, (b)
and dm = 300 nm, (c)
and dm = 200 nm, (d)
and dm = 300 nm, (e)
and dm = 200 nm, and (f)
and dm = 300 nm.
3. EXPERIMENTAL METHODS
In our experiments, we used polystyrene latex particles with dp = 100, 200, and 300 nm as monodispersed spherical particles and two types of the polydispersed silver nanowires that have average diameters of 48 and 68 nm, respectively. The silver nanowires used in our experiments were synthesized using a modified polyol reduction process. A detailed description can be found in Park et al. (Citation2014).
shows a schematic diagram of the experimental setup for measuring the mean charge on a particle. Silver nanowires generated from a colloidal solution with a collison atomizer were passed through a diffusion dryer. The aerosol flow was set to 1 lpm by a needle valve. The particles were neutralized by passing them through an Am-241 neutralizer, and then the monodispersed particles were classified with a long differential mobility analyzer (DMA; Model 3081, TSI Inc.). The sheath flow rate for DMA was set to 5 lpm. We selected silver nanowires with electrical mobility diameter of 200, 300, and 400 nm.
In our experiments, the unipolar diffusion charger inside the nanoparticle surface area monitor (NSAM) was used as the target charger. The operational flow rate through the test charger, 2.5 lpm, was the same as those used in the corresponding commercial instruments. In our experiments, the condensation particle counter (CPC, Model 3775, TSI Inc.) had an inlet flow rate of 1.5 lpm, and the electrometer had an inlet flow rate of 1.0 lpm. The monodispersed aerosol from DMA was sent into a Po-210 neutralizer and followed by the test unipolar charger. The ion trap voltage was fixed at 20 V to remove extra ions coming from the unipolar charger chamber. To obtain samples for the scanning electron microscope (SEM) image analysis of silver nanowires, the particles classified with DMA were deposited on Si-wafer using an electrostatic sampler (HCT Model NCP-10). The sampler was operated at 9 kV and 1 lpm.
4. RESULTS AND DISCUSSION
4.1. SEM Image Analysis of Silver Nanowires
shows the SEM images of the nanowires sampled at dm = 200 nm and 300 nm. The SEM images confirmed that the morphology of a nanowire is similar to that of a cylinder. Thus, a nanowire can be modeled as a cylinder.
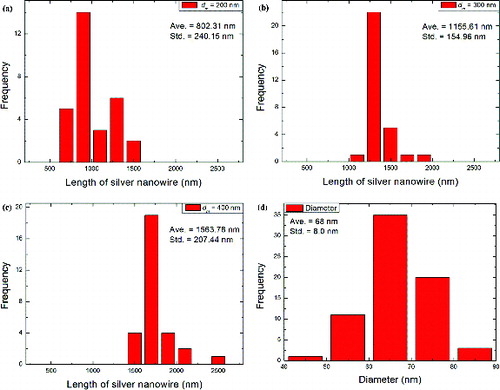
In , histograms of the average length and diameter of the monodispersed silver nanowires are plotted. The average length and diameter were obtained with SEM image analysis using ImageJ software. The length with a specific electrical mobility diameter can be affected by the electric field intensity inside the DMA since the electric field intensity influences the degree of particle alignment inside the DMA (Park et al. Citation2014). The silver nanowires were nearly aligned along the electric field under our experimental conditions.
FIG. 3. Histograms for silver nanowires with silver nanowire length, (a) dm = 200 nm, (b) dm = 250 nm, (c) dm = 300 nm, and (d) silver nanowire diameter.
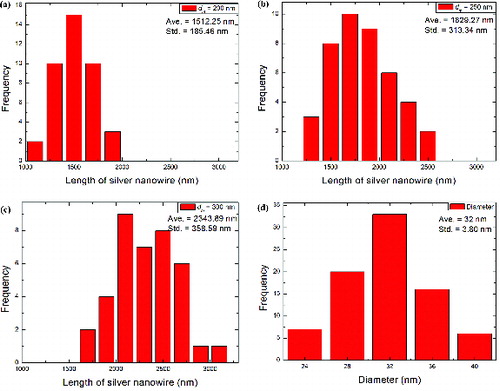
FIG. 4. Histograms for silver nanowires with silver nanowire length (a) dm = 200 nm, (b) dm = 300 nm, (c) dm = 400 nm, and (d) silver nanowire diameter.
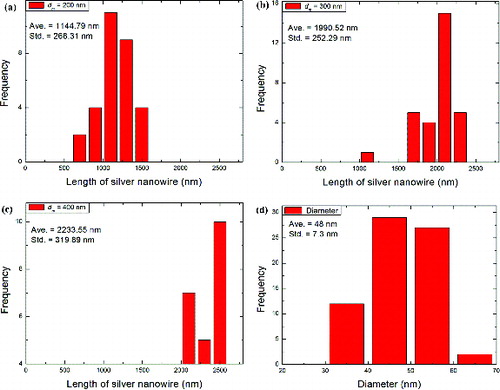
FIG. 5. Histograms for silver nanowires with silver nanowire length (a) dm = 200 nm, (b) dm = 300 nm, (c) dm = 400 nm, and (d) silver nanowire diameter.
4.2. Relationship Between Electrical Capacitance and Particle Morphology
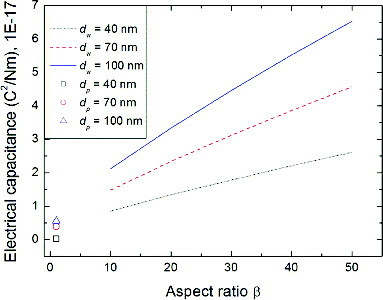
In , we plot the electrical capacitance as a function of the aspect ratio for various diameters of the nanowire. Particles with 40, 70, and 100-nm diameter were considered. The electrical capacitance of a spherical particle with 40, 70, and 100-nm diameter is plotted, assuming that those spherical particles have an aspect ratio of 1. The electrical capacitance of a nanowire is proportional to for a given aspect ratio and increases with the aspect ratio for a given diameter of a particle. The electrical capacitance of nanowires increases by a factor of 2 as the aspect ratio increases from 10 to 50 for a given
.
FIG. 6. Electrical capacitance of a spherical particle with a diameter of 40, 70, and 100 nm (symbol) and a nanowire with (line).
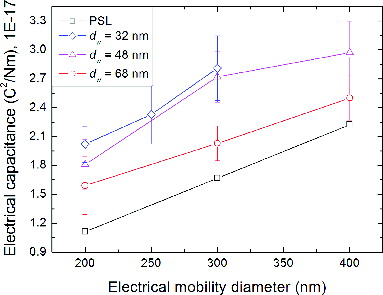
In , the electrical capacitance of spherical particles and silver nanowires as a function of electrical mobility diameter is compared. We theoretically calculated the electrical capacitance using Vainshtein's model, EquationEquation (4)[4] , using morphology information such as the aspect ratio and the diameter shown in – shows that the capacitance of silver nanowires is larger than the capacitance of spherical particles. In addition, the electrical capacitance of a nanowire decreases with
indicating the electrical capacitance is affected by
. The electrical capacitance of the silver nanowires that have
was about 68–81% larger than that of spherical particles ranging from dm = 200 to 300 nm. The electrical capacitance of the silver nanowires that have
and
nm was about 33–63% and 12–43% larger than that of spherical particles ranging from dm = 200 to 400 nm, respectively.
FIG. 7. The electrical capacitance of silver nanowires and PSL particles by theoretical analysis at an electrical mobility diameter (dm) of 200, 300, and 400 nm.
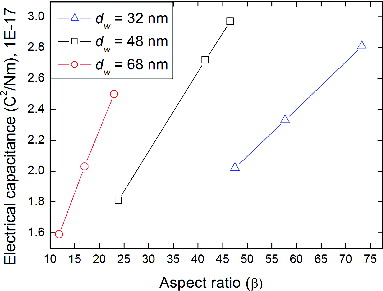
We plot the electrical capacitance as a function of the aspect ratio in . For the case of and
, each data point in corresponds to data points for dm = 200, 300, and 400 nm in . For the case of
data point in corresponds to data points for electrical dm = 200, 250, and 300 nm in . As shown in , electrical capacitance is influenced by the aspect ratio (β). For a given
, the electrical capacitance increases when the particles have a higher aspect ratio, similar to the results in .
FIG. 8. The electrical capacitance of silver nanowires expressed as a function of the aspect ratio.
4.3. Mean Charge per Particle
In , we compared predicted results with experimental data for the mean charge per particle of silver nanowires and PSL particles as a function of the electrical mobility diameter (dm). In this figure, we theoretically calculated the mean charge per particle using Chang's theory in EquationEquation (2)[2] . In EquationEquation (2)
[2] , the electrical capacitance was calculated using the Vainsthein's model in EquationEquation (4)
[4] using morphology information from SEM image analysis, and then the calculated electrical capacitance was used for the mean charge per particle.
FIG. 9. Comparison of predicted results and experimental data for the mean charge per particle of silver nanowires and PSL particles using particle morphology information from SEM image analysis (line), and the experimental results for the mean charge on the silver nanowires and PSL particles (symbol).
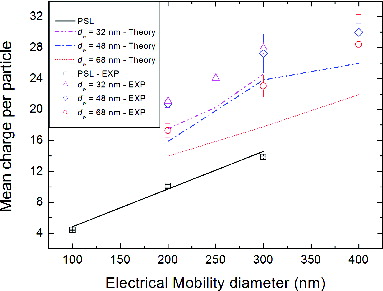
In our experiments, the mean charge per particle was obtained by measuring the number concentration and the electrical current. The experimental mean charge of the particle Np is expressed as,[5] where NCPC is the particle concentration measured by CPC, Ie is the electrical current measured by the electrometer, Qe is the flow rate into the electrometer, and e is the unit charge. In order to obtain the best fit of our experimental data for the mean charge of PSL particles, we used Nit = 2.7 E13/m3, which was used in Shin et al.'s (Citation2009) study. Comparing the theoretical and experimental mean charge of PSL particles, the theoretically predicted mean charge and the experimentally obtained mean charge are in good agreement within 5% error. The theoretically calculated results demonstrated that silver nanowires have about 68–80% more charge for
, 63% more charge for
and 22–44% more charge for
than spherical particles in the size range of dm = 200–300 nm. In addition, nanowires with
had about 13–34% more charge than nanowires with
in the size range of dm = 200–400 nm, which is almost equivalent to the difference in the electrical capacitance of about 14–34%.
In the size range of dm = 200–300 nm, the experimental results showed that the mean charge per particle of the silver nanowires with ,
and 68 nm was 102–109%, 97–105%, and 66–71% larger than that of the spherical particles, respectively. The difference in the mean charge per particle between dw = 48 nm and 68 nm was about 5–20% for a given electrical mobility diameter in the size range of dm = 200–400 nm. A similar trend was also observed in Han and Gentry's (Citation1993a) study. Han and Gentry (Citation1993a) also showed in their simulation results that the charge number of a fiber is 25% greater than a spherical particle with the same surface area as the fiber. Han and Gentry (Citation1993a) used iron fibers with an average diameter of around 150 nm and an average length of 50 μm. While Han and Gentry's (1993a) study used very large fibers, we used silver nanowires with a diameter of 48 nm or 68 nm and an average length in the 1 to 3-μm range.
Regarding the mean charge per particle of silver nanowires, both theoretical prediction and the experimental data show a similar trend. However, the theoretical predictions underestimated the experimental results by about 20 to 30%. Shin et al. (Citation2010) also showed that there is a similar difference between theoretical prediction and experimental data for the mean charge per particle of agglomerated particles.
The mean charge and the electrical mobility diameter are related to the diameter and length of the nanowire. For this reason, the mean charge per particle can shed light on the prediction of the diameter of a nanowire for a given electrical mobility diameter.
5. CONCLUSIONS
We investigated the effect of particle morphology on the unipolar diffusion charging of silver nanowires. The electrical capacitance of a particle is an important parameter that determines the mean charge per particle in the continuum regime. We analyzed the electrical capacitance of a nanowire using Vainsthein's model. The electrical capacitance increased as the diameter of a nanowire decreased in the range of dm = 200–400 nm. It is predicted that silver nanowires with have 68–81%, 33–63%, and 12–43% larger electrical capacitance compared with that of a sphere with the same electrical mobility diameter as nanowires in the range of dm = 200 to 300 nm for
and in the range of dm = 200 to 400 nm for
and
respectively. The predicted electrical capacitance was used to calculate the mean charge per particle of a nanowire.
Theoretical predictions show that mean charge per particle of silver nanowires with has 68–80%, 63%, and 22–44% more charge, respectively, than that of a sphere in the range of dm = 200–300 nm. In our experiments, we found that silver nanowires with dw = 32, 48, and 68 nm had more mean charge per particle by 102–109%, 97–105%, and 66–71% than that of a sphere in the range of dm = 200–300 nm, respectively. The theoretical prediction and experimental data were qualitatively in good agreement considering that for a given dm the mean charge per particle of a silver nanowire is larger than that of a sphere and increases as the nanowire diameter decreases.
Funding
This research was supported by the Basic Science Research Program through the National Research Foundation of Korea (NRF) funded by the Ministry of Science, ICT and Future Planning (2014-008356).
REFERENCES
- Biskos, G., Mastorakos, E., and Collings, N. (2004). Monte-Carlo Simulation of Unipolar Diffusion Charging for Spherical and Non-Spherical Particles. J. Aerosol Sci., 35(6):707–730.
- Biskos, G., Reavell, K., and Collings, N. (2005). Unipolar Diffusion Charging of Aerosol Particles in the Transition Regime. J. Aerosol Sci., 36(2):247–265.
- Brown, R. C., and Hemingway, M. A. (1995). Electric Charge Distribution and Capacitance of Agglomerates of Spherical Particles: Theory and Experimental Simulation. J. Aerosol Sci., 26(8):1197–1206.
- Chang, J. S. (1981). Theory of Diffusion Charging of Arbitrarily Shaped Conductive Aerosol Particles by Unipolar Ions. J. Aerosol Sci., 12(1):19–26.
- Djurišić, A. B., and Leung, Y. H. (2006). Optical Properties of ZnO Nanostructures. Small, 2(8–9):944–961.
- Han, R. J., and Gentry, J. W. (1993a). Unipolar Diffusional Charging of Fibrous Aerosols—Theory and Experiment. J. Aerosol Sci., 24(2):211–226.
- Han, R. J., and Gentry, J. W. (1993b). Field and Combined Diffusional and Field Charging of Fibrous Aerosols. Aerosol Sci. Technol., 18(2):165–179.
- Ku, B. K., Deye, G. J., Kulkarni, P., and Karon, P. A. (2011). Bipolar Diffusion Charging of High-Aspect Ratio Aerosols. J. Electrostat., 69(6):641–647.
- Kulkarni, P., Deye, G. J., and Baron, P. A. (2009). Bipolar Diffusion Charging Characteristics of Single-Wall Carbon Nanotube Aerosol Particles. J. Aerosol Sci., 40(2):164–179.
- Laframboise, J. G., and Chang, J. S. (1977). Theory of Charge Deposition on Charged Aerosol Particles of Arbitrary Shape. J. Aerosol Sci., 8(5):331–338.
- Lall, A. A., & Friedlander, S. K. (2006). On-line Measurement of Ultrafine Aggregate Surface Area and Volume Distributions by Electrical Mobility Analysis: I. Theoretical Analysis. J. Aerosol. Sci. 37(3):260–271.
- Liu, Z., Kim, S. C., Wang, J., Shin, W. G., Fissan, H., and Pui, D. Y. H. (2012). Measurement of Metal Nanoparticle Agglomerates Generated by Spark Discharge Using the Universal Nanoparticle Analyzer (UNPA). Aerosol Sci. Technol., 46(3):333–346.
- Medved, A., Dorman, F., Kaufman, S. L., and Pöcher, A. (2000). A New Corona-Based Charger for Aerosol Particles. J. Aerosol Sci., 31:616–617.
- Oh, H., Park, H., and Kim, S. (2004). Effects of Particle Shape on the Unipolar Diffusion Charging of Nonspherical Particles. Aerosol Sci. Technol., 38(11):1045–1053.
- Ouf, F. X., and Sillon, P. (2009). Charging Efficiency of the Electrical Low-Pressure Impactor's Corona Charger: Influence of the Fractal Morphology of Nanoparticle Aggregates and Uncertainty Analysis of Experimental Results. Aerosol Sci. Technol., 43(7):685–698.
- Park, M., Li, M., Shin, W. G., Moon, H. J., and Ko, S. H. (2014). Electrical Mobility of Silver Nanowires in Transition and Continuum Regimes. J. Aerosol Sci., 72(6):21–31.
- Reischl, G. P., Mäkelä, J. M., Karch, R., and Necid, J. (1996). Bipolar Charging of Ultrafine Particles in the Size Range Below 10 nm. J. Aerosol Sci., 27(6):931–949.
- Shin, W. G., Pui, D. Y. H., Fissan, H., Neumann, S., and Trampe, A. (2007). Calibration and Numerical Simulation of Nanoparticle Surface Area Monitor (TSI model 3550 NSAM). J. Nanopart. Res., 9:61–69.
- Shin, W. G., Qi, C., Wang, J., Fissan, H., and Pui, D. Y. H. (2009). The Effect of Dielectric Constant of Materials on Unipolar Diffusion Charging of Nanoparticles. J. Aerosol Sci., 40(5):463–468.
- Shin, W. G., Wang, J., Mertler, M., Sachweh, B., Fissan, H., and Pui, D. Y. H. (2010). The Effect of Particle Morphology on Unipolar Diffusion Charging of Nanoparticle Agglomerates in the Transition Regime. J. Aerosol Sci., 41(11):975–986.
- Smythe, W. R. (1956). Charged Right Circular Cylinder. J. Appl. Phys., 27(8):917–920.
- Son, M., Park, H., Park, M., Wang, J., and Shin, W. G. (2014). Silver Nanowire Penetration through Screen Filter. Aerosol Sci. Technol., 48(5):480–488.
- Vainshtein, L. A. (1963). Static Boundary Problems for a Hollow Cylinder of Finite Length. 2. Numerical Results. Sov. Phys. Tech. Phys., 7(10):855.
- Wang, P. (1984). Calculation of Electrostatic Fields Surrounding Finite Circular Cylindrical Conductors. Antennas and Propagation. IEEE Trans. Antennas Propag., 32(9):956–962.
- Wang, J., Shin, W. G., Mertler, M., Sachweh, B., Fissan, H., and Pui, D. Y. H. (2010). Measurement of Nanoparticle Agglomerates by Combined Measurement of Electrical Mobility and Unipolar Charging Properties. Aerosol Sci. Technol., 44(2):97–108.
- Xiao, K., Swanson, J. J., Pui, D. Y., and Kittelson, D. B. (2012). Bipolar Diffusion Charging of Aggregates. Aerosol Sci. Technol., 46(7):794–803.
- Yu, P. Y., Wang, C. C., and Gentry, J. W. (1987). Experimental Measurement of the Rate of Unipolar Charging of Actinolite Fibers. J. Aerosol Sci., 18(1):73–85.