
Abstract
The key characteristics of an air filter—flow resistance and filtration efficiency—are strongly affected by captured particles. The impact of exposing loaded heating, ventilating, and air conditioning air filters to a relative humidity (RH) other than that experienced during loading is investigated to develop an understanding of the role of RH throughout filter operation. Flat sheets of commercial filter media were loaded with hygroscopic, non-hygroscopic, or a mixture of particles in a laboratory apparatus. When filters loaded with hygroscopic particles in dry air were exposed to an elevated RH of 40%, the flow resistance reduced by up to 47%, depending on the filter being tested. Investigation of filter efficiency before and after changes in RH in the same samples shows reductions of up to 11 percentage points in the 130-nm size range. Further increasing RH causes additional drops in flow resistance and efficiency whereas reverting back to a lower humidity does not change the filter characteristics. The irreversibility of the particle-loaded filter characteristics implies that the RH increases are associated with an irreversible change in the particle structure. The response to humidity was reduced if an aerosol mixture of hygroscopic and non-hygroscopic particles is used. Exposure of filters loaded with only non-hygroscopic particles does not show the same dependence on RH. Small increases in growth factor for RH changes below deliquescence, causing morphological changes in captured particle aggregates, is a potential explanation for the changes observed.
Copyright 2015 American Association for Aerosol Research
1. INTRODUCTION
Air filters are commonly manufactured using media formed from randomly oriented polymer fibers. Filters manufactured for installation in heating, ventilating, and air conditioning (HVAC) systems are classified based on the minimum efficiency reporting value (MERV) as defined by ASHRAE 52.2-2012 (ASHRAE Citation2012). HVAC filters, in the range of MERV 6 to MERV 16, are typically characterized by low flow resistance and moderate filtration efficiency when compared with high-efficiency particle air (HEPA) filters required for high performance applications such as clean room filtration.
Filter performance changes throughout the lifetime of the filter as particles are captured within the media. The efficiency due to mechanical capture mechanisms increases, while efficiency from electrostatic capture mechanisms decreases with filter loading (Brown Citation1993). The flow resistance of air filters increases with dust loading but follows different profiles depending on the loading characteristic of the filter type. HVAC filters typically operate as depth loading filters—those that capture particles throughout the depth of the media—and are characterized by a loading profile approximated by an exponential curve (Sun and Woodman Citation2009; Montgomery et al. Citation2012). HEPA filters exhibit a very short depth loading stage that transitions to surface loading, where the dust forms a cake layer on the surface (Endo et al. Citation1998; Thomas et al. Citation1999, 2001). The cake continues to grow as incident particles are captured at the surface. The relation between flow resistance and dust loading follows a linear profile with a slope determined by particle characteristics.
The change in filter performance with dust loading is an important characteristic of filter operation. The filtration efficiency can change the amount of suspended particles within a space and limit the benefits of the installed filter system. The flow resistance is directly related to the energy consumption of the filter and plays a large part in determining the overall operation cost (Fisk et al. Citation2002; Arnold et al. Citation2005; Montgomery et al. Citation2012). Changes in filter operations have been shown to depend on the filter characteristics (fiber diameter, solid volume fraction, fiber charge, etc.; Brown Citation1993; Walsh and Stenhouse Citation1997; Raynor and Chae Citation2003), particle characteristics (size distribution, charge, shape, etc.; Novick et al. Citation1992; Japuntich et al. Citation1994; Bémer and Callé Citation2000; Song et al. Citation2006), and loading conditions (face velocity, relative humidity (RH), etc.; Walsh and Stenhouse Citation1998; Thomas et al. Citation1999; Miguel Citation2003).
While the impact of filter and particle characteristics on properties of a loaded filter has been extensively studied, the impact of system conditions, and especially RH, is less well understood. In general, high RH reduces the flow resistance of HEPA filters when loading occurs with hygroscopic particles and has no impact for non-hygroscopic particles (Gupta et al. Citation1993; Miguel Citation2003; Joubert et al. Citation2010). Joubert et al. (Citation2011) performed surface loading of HEPA filters at 0% RH and showed that exposing the loaded filter to a higher RH of 20–60% resulted in reduction in specific cake resistance that did not depend on mass loading. It was postulated that the drop in specific cake resistance was a result of a change in size of the particles in the filter cake.
At high RH, salt particles will deliquesce. Changes in the properties of hygroscopic particles are impacted by particle size and have been shown to occur at RH far below the deliquescence RH for nano-sized particles (Biskos et al. Citation2006; Wise et al. Citation2008). The Growth Factor (GF) represents the change in particle size from the dry diameter and is a function of particle size, RH, and the studied salt. For low RH (<70%) and nano-sized particles (diameter <200 nm), the GF is larger for smaller particles and higher RH (Hu et al. Citation2010). Sodium chloride has also been shown to have a reversible uptake of liquid water on the surface for RH below deliquescence that can affect particle shape (Wise et al. Citation2008), and potentially particle–particle interactions. These mechanisms could be responsible for structural changes in particles with changing RH supporting the hypothesis of Joubert et al. (Citation2011).
Joubert et al. (Citation2011) show that RH influences loading behavior and can change resistance of loaded HEPA filters. The previous focus was on surface loading filters and operation at flow resistance higher than those seen for HVAC systems. Particles captured throughout the depth of HVAC filters are dispersed and characterized by dendrite growth instead of the densely packed particles in surface-loaded HEPA filters (Brown Citation1993). The purpose of this study is to evaluate the impact of changes in RH on the properties of loaded HVAC filters. Filter loading is performed for hygroscopic and non-hygroscopic particles to compare the impact of particle properties. This work provides insight into the importance of RH for operation of real HVAC air filters, which are subject to variations in RH throughout the loading cycle.
2. EXPERIMENT AND METHODS
The experiments were performed in a laboratory test bench () that allows for control of flow rate, aerosol size and concentration, and RH. The flow in the circuit is controlled at a constant flow rate throughout the experiment using a vacuum pump with a critical orifice on the inlet side. The aerosol source is a TSI 3076 constant output atomizer connected to cleaned and dried compressed air. The aerosol is passed through a desiccant drier to remove all moisture within the airstream. A TSI 3077 aerosol neutralizer is used to achieve a Boltzmann charge distribution. A make-up air stream ensures flow balance in the system, and is used to control RH by modulating the proportion of make-up air that passes through a humidifier or desiccant drier.
FIG. 1. Schematic of filter loading test bench.
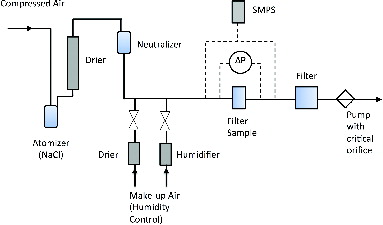
The samples tested are 50-mm-diameter flat sheets of media from commercial filters. The flow velocity on the filter face is maintained at a constant rate of 11 cm/s during testing by means of a critical orifice. This velocity was selected, as it is representative of the flow velocity through the media of typical pleated filters during normal operation. The flow resistance is measured throughout the experiment using a pressure transducer (Omega Model PX274) connected to a data acquisition system (LabJack U3-HV). The size-resolved aerosol number concentration is determined using a TSI 3936 scanning mobility particle sizer (SMPS). Continuously alternating measurements upstream and downstream of the filter were taken throughout the experiment, and later used to determine filter efficiency at any time during loading.
The filter is loaded with hygroscopic (NaCl), non-hygroscopic (Al2O3), or a mixture of particles. The normalized particle number size distributions are shown in for particles during testing of hygroscopic or non-hygroscopic loading only. For loading with mixtures of particles, the particles are atomized and dried separately to ensure consistency in size distribution before mixing, and an additional vacuum pump and critical orifice are used to maintain the same total particle concentration and filter face velocity as that in the single particle-type experiments.
FIG. 2. Normalized size distribution of Al2O3 and NaCl particles used for filter loading.
The filter media properties are shown in . The initial flow resistance of each filter was determined by averaging the initial flow resistance for all samples tested in this work. The range reported indicates the standard deviation. The average fiber diameter was determined by calculating the length-weighted mean fiber diameter from scanning electron microscope (SEM) images of the filter media samples. The media thickness was determined by measuring the cross section of the media from SEM images.
Table 1 Filter properties
Media from two different commercial HVAC filters were tested: one electret and another mechanical. The mechanical filter (Filter 2) is rated as MERV 14 by ASHRAE 52.2-2012 testing (ASHRAE Citation2012). The electret filter (Filter 1) is rated as MERV 14 by ASHRAE 52.2-2012 and A13 by ASHRAE 52.2-2012, Appendix J (ASHRAE Citation2012) for discharged performance. The charged samples are designated as Filter 1c and the discharged samples as Filter 1d. The charge was removed from the electret filter by submerging the media in isopropyl alcohol for 30 min and letting it dry for 24 h. Submersion in isopropyl alcohol does not change filter's physical properties and acts only to remove the electric charge (Romay et al. Citation1998), as is confirmed by comparing the initial pressure drop of the charged and discharged filter samples in . The 30-min submersion was chosen after comparing the filter efficiency of media samples submerged for 5–120 min and finding no difference for submersion time greater than 15 min. This is in line with a previous review of electret filter discharge by submersion that found a variety of procedures between 2 min and 2 h with no clearly developed standard (Sanchez et al. Citation2013).
The purpose of this work is to investigate the impact of RH changes on the flow resistance and filtration efficiency of loaded HVAC air filters. The air filters are loaded under a range of RH values from 0–60% to represent low to medium RH conditions in real filter operations. The RH during loading remains below the deliquescence RH of NaCl, 75% (Hu et al. Citation2010; Langlet et al. Citation2011), for all experiments in this work. Filters may experience RH of 0–100% during real operating conditions. The results above deliquescence are expected to vary from those below, and are the topic of potential future investigations.
After the end of the loading process (determined by a desired flow resistance), the atomizers were switched to a low concentration (resulting in a total concentration of ∼4×10⁵ particles per m3 of air) to ensure that the RH conditions were maintained but no significant change in filter performance (resistance or efficiency) resulted from the continuous flow of particles. The loaded filter efficiency was determined under these steady state airflow conditions with RH equal to that during loading. The RH of the airstream is then modified by adjusting the make-up air control valves to allow for exposure to RH of a predetermined level. The filter efficiency is once again measured after the system reaches equilibrium.
3. RESULTS
3.1. Impact of Relative Humidity on Clean Filter Properties
The initial filter conditions were tested for three levels of RH with hygroscopic particles (NaCl). The filter sample was placed in the apparatus with clean air and the flow resistance recorded for 1 h at 0%, 20%, and 40% RH. No difference in flow resistance and filtration efficiency of clean filter samples was observed for either the electret (charged or discharged) or mechanical filters. This finding is in line with previous experiments (Joubert et al. Citation2010).
3.2. Hygroscopic Particles
Filters were loaded with hygroscopic particles to a final normalized flow resistance, P* = (P – Pi)/Pi, equal to 4, where P is the flow resistance (Pa) and Pi is the flow resistance of a clean filter sample (Pa). The loaded filter samples were then exposed to a clean air stream controlled to a predetermined RH. The system was allowed to come to equilibrium, and the filter properties were determined in the new state.
3.2.1. Charged Electret Filter
shows curves of normalized flow resistance versus time for Filter 1c samples loaded with NaCl. Time t equal to zero indicates the time at which the RH was changed from the RH at loading to the RH of exposure. The curves are labeled as A%–>B%, where A is the RH during loading (t < 0) and B indicates the RH that the loaded filter is exposed to for t > 0. The filter loading stage (t < 0) to achieve Pf* = 4 occurs over approximately 2.5 h.
FIG. 3. Change in resistance of Filter 1c when exposed to clean air with RH = B% after loading with NaCl at RH = A%. Curves are labeled as A%–>B%.
When filters loaded with hygroscopic particles at 0% RH are exposed to a higher RH, there is an associated reduction in flow resistance. The reduction in flow resistance increases with increased exposure to RH. The average reductions in a normalized flow resistance after exposure to Filter 1c were 0.65 ± 0.08, 1.74 ± 0.20, and 2.86 ± 0.08 for 0%–>20%, 0%–>40%, and 0%–>60%, respectively. When filters are exposed to RH lower than or equal to that during loading (i.e. 40%–>0% and 0%–>0%), there is no change in associated flow resistance. In addition, reductions in flow resistance when exposing the loaded filters to a higher RH are not reversed if the RH is then lowered to 0%, indicating that an irreversible physical change has occurred. This trend of reduced flow resistance with exposure to high RH was seen for all filters tested. A subset of the results is shown in this work, which is in agreement with the existing literature (Joubert et al. Citation2010).
Changes in flow resistance are not limited to experiments with loading at 0% RH. When filters are loaded at 20% RH and then exposed to 40% RH, reduction in normalized flow resistance was found to be 1.49 ± 0.03; greater than that from the 0%–>20% (0.65 ± 0.08) and less than the 40%–>60% (2.50 ± 0.01) experiments. The 40%–>60% experiment results in a greater loss of flow resistance than the 0%–>40% experiment, but less than the 0%–>60% experiment, which has the maximum reduction in resistance of all the scenarios tested. These comparisons indicate that the change in flow characteristics is a function of both the RH during loading and the exposure RH.
When a filter is loaded at 40% RH and exposed to clean air at 40% RH, a small reduction in flow resistance is seen with time. This could be due to the particles requiring more time to achieve equilibrium than is provided between generation and deposition in the media. The particles are generated from liquid solution, dried to 0% RH in a desiccant drier, and then mixed with moist air to adjust RH. The slight decline in RH between t = 0, when the RH changes, and the equilibrium point of constant P* could be a result of changes in particle size as the last particles deposited come into equilibrium. Joubert et al. (Citation2011) noted a similar phenomenon when dust cakes were formed at 46% RH and left to come to equilibrium with 46% RH air.
shows the change in filtration efficiency (for 130-nm particles) versus change in normalized flow resistance of filter samples loaded and exposed to a range of RH values tested in this work.
FIG. 4. Change in efficiency (Dp = 130 nm) and normalized flow resistance of Filter 1c when loaded with NaCl at RH = A% and then exposed to clean air with RH = B% (A%–>B%). The error bars represent the standard deviation of all the experiments performed at the indicated condition (min. of 4).
The results in show that the changes in flow resistance due to exposure of loaded filters to varying levels of RH are accompanied by the changes in filtration efficiency. Filters exposed to a RH equal to or less than that during loading show little change in either filtration efficiency or flow resistance. The general trend shows that larger changes in normalized flow resistance after exposure are accompanied by larger changes in efficiency as would be expected from filtration theory. Filters loaded at 0% RH and then exposed to 20% or 40% RH show a reduction of approximately 5 and 15 percentage points, respectively, in filter efficiency. Filters loaded at 20% RH and exposed to 40% RH show a smaller decrease in efficiency and flow resistance than those loaded at 0% RH and exposed to 40% RH. The Filters loaded at 20% RH and exposed to 40% RH show a similar change in filtration efficiency as the 0%–>20% experiments but have a significantly greater change in flow resistance. Exposure of filters to 60% RH after loading at 0%, 20%, or 40% RH show the highest changes in flow resistance, and a change in efficiency approximately equals to the 0%–>40% tests.
3.2.2. Discharged and Mechanical Filters
Similar experiments were performed for the discharged electret and mechanical filters. The results follow a similar trend as those discussed in detail for experiments with charged electret filters, indicating that the impact of RH is not unique to electret filters. shows the change in filtration efficiency for 130-nm particles versus the change in normalized flow resistance for Filter 1d and Filter 2 after loading with NaCl. Exposure of the loaded filter to an RH lower than or equal to that during loading produces little to no change in either flow resistance or filtration efficiency. Filter 1d shows a reduction of approximately 15 percentage points in filtration efficiency and a drop in normalized flow resistance of approximately 1.9 when exposed to 40% RH after loading at 0% RH.
FIG. 5. Change in efficiency (Dp = 130 nm) and normalized flow resistance of Filters 1d and 2 when loaded with NaCl at RH = A% and then exposed to clean air with RH = B% (A%–>B%). The error bars represent the standard deviation of all the experiments performed at the indicated condition (min. of 4).
In contrast, Filter 2 shows no change in filtration efficiency when exposed to 40% RH after loading at 0% RH but has an associated reduction of normalized flow resistance equal to approximately 0.68. The lack of efficiency change may be explained by the high efficiency of the filter, which reaches a plateau of approximately 0.95 before reaching P* = 4 (fully loaded). Just as it is possible for a filter to have increasing flow resistance with no increase in efficiency during loading, it is plausible that the restructuring of the particles present in the filter can influence flow resistance without an appreciable change in efficiency.
3.2.3. Impact of Filter Loading
shows change in normalized resistance and efficiency (Dp = 130 nm) of filters loaded and exposed to different RH for final loaded normalized resistances (Pf*) of up to 5. The loading is performed with NaCl particles. This allows for a comparison of the impact of different filter loading levels on the importance of RH during filter operation. Each of the three filters are presented in the figure: (a) Filter 1c, 0%–>40%, (b) Filter 1c, 40%–>60%, (c) Filter 1d, 0%–>40%, and (d) Filter 2, 0%–>40%.
FIG. 6. Change in normalized flow resistance and filtration efficiency (Dp = 130 nm) for varying levels of loading with NaCl: (a) Filter 1c, 0%–>40%, (b) Filter 1c, 40%–>60%, (c) Filter 1d, 0%–>40%, and (d) Filter 2, 0%–>40%. The error bars represent the standard deviation of all the experiments performed at the indicated condition (min. of 4).
The change in normalized flow resistance after exposure shows a linear dependence on the final normalized resistance due to dust loading in the filter. When the filters are loaded with more salt (higher Pf*), a larger drop in resistance occurs after exposure to elevated RH. The slope of the linear regression lines for each filter tested for 0%–>40% are statistically significantly different (within a 95% confidence interval), indicating that the dust load is a factor in final flow resistance and captured dust is impacted by RH in different ways depending on the filter properties. The slopes of the –ΔP* versus Pf* regression lines are 0.35 ± 0.04 and 0.46 ± 0.04 for Filter 1c and 1d, respectively. Filter 2 has a lower slope (0.21 ± 0.02) than Filter 1, indicating that it is not as heavily influenced by the degree of salt loading. Potential reasons for this may be the salt aggregate structures, distribution, or density. The regression lines shown have an intercept of ∼0, as expected, because the filter structure itself is not impacted by RH in the absence of particle loading.
The change in efficiency for 130-nm particles (–ΔE130nm) after exposure to 40% RH is also best described by a linear relation with the final normalized resistance due to dust loading in the filter, although the data show significantly greater variability. This is in part due to the uncertainty in efficiency measurements from comparisons of upstream and downstream particle number concentrations. Both charged and discharged variations of Filter 1 show a general trend of greater changes in efficiency after exposure to 40% RH when these are loaded to higher levels of dust loading. Filter 2 shows essentially no change in efficiency due to exposure to 40% RH regardless of the level of salt loading. This could be explained by the high efficiency of mechanical media and rapid increase in efficiency during loading. There is only a small difference in the efficiency of Filter 2 loaded to Pf* = 2 and 5 (0.94 and 0.97, respectively, a difference of 0.03), indicating that the dust is not adding appreciably to the efficiency of the filter and will therefore not influence the efficiency if it undergoes morphological changes. In contrast, the efficiency of Filter 1d loaded to Pf* = 2 and 5 is 0.68 and 0.79, respectively, a difference of 0.11, which shows that the salt continues to add significantly to the efficiency of the filter throughout all levels of loading investigated.
A comparison of shows the impact of different loading and exposure RH on changes to loaded filter characteristics. The slope of the linear regression lines are statistically significantly different (within a 95% confidence interval) with a larger slope for 40%–>60% tests (0.62 ± 0.02) than for 0%–>40% tests (0.35 ± 0.04) even though the humidity range is smaller. This supports the previous evidence showing that the change in loaded filter properties is a function of both loading and exposure RH and is seen over the entire range of loading tested in this work. The filtration efficiency shows greater variability than the changes in normalized flow resistance but the slope of the 40%–>60% tests (0.029 ± 0.007) is greater than that of the 0%–>40% tests (0.019 ± 0.004). This comparison indicates that the particles captured within the filter media are more sensitive to changes in RH for exposure closer to the deliquescence RH.
3.3. Non-Hygroscopic Particles
Similar experiments were performed using Filter 1c and loading with alumina to determine the impact of RH changes on non-hygroscopic particles. shows the results of filtration efficiency changes for 130-nm particles versus changes in normalized flow resistance for the combination of experiments with an RH of 0% and 40%. Similar to the experiments with hygroscopic particles, there is no substantial change in properties when a loaded filter is exposed to an RH less than or equal to that during loading. A small change in normalized flow resistance (<0.4) is seen when filters loaded at 0% RH with alumina are exposed to 40% RH. This result differs slightly from the findings for surface-loaded filters, which showed no change in flow resistance of filters loaded with alumina in dry air and exposed to a higher RH (Joubert et al. Citation2011). This may be the result of small impurities in the Al2O3 powder used in the experiments. The change in Filter 1c loaded with NaCl at 0%–>40% RH conditions is shown in the figure for reference.
FIG. 7. Change in filtration efficiency (Dp = 130 nm) and normalized flow resistance of Filter 1c loaded with Al2O3 at RH = A% and then exposed to clean air with RH = B% (A%–>B%). The error bars represent the standard deviation of all the experiments performed at the indicated condition (min. of 4).
3.4. Mixtures of Hygroscopic and Non-Hygroscopic Particles
Experiments were also conducted with mixtures of hygroscopic (NaCl) and non-hygroscopic (Al2O3) particles to more closely approximate real air systems. The composition of atmospheric aerosols is a complex function of time and location. Atmospheric aerosols include organic and inorganic, and hygroscopic and non-hygroscopic particles that cannot be truly simulated within the lab environment. As a general approximation, the fraction of hygroscopic particles can be taken as 0.5 ± 0.3 (Pöschl Citation2005).
shows the change in (a) normalized flow resistance and (b) filtration efficiency when Filter 1c samples are loaded with a mixture of hygroscopic (NaCl) and non-hygroscopic (Al2O3) particles at 0% RH and exposed to 40% RH. The experiments have been performed for aerosol mixtures between 0% and 100% Al2O3 particles to provide an indication of the importance of aerosol mixture composition and allow for a comparison with real operations over a range of conditions.
FIG. 8. Change in (a) normalized pressure and (b) filtration efficiency for Filter 1c exposed to 40% RH after loading with a mixture of NaCl and Al2O3 aerosols in varying proportions at 0% RH. The error bars represent the standard deviation of all the experiments performed at the indicated condition (min. of 4).
The impact of exposure to elevated RH is a function of the aerosol mixture present during the loading process. The change in filter performance characteristics is greater for higher fractions of hygroscopic particles. The change in normalized flow resistance due to exposure to elevated RH is the lowest for 100% Al2O3 particles and is potentially present because of hygroscopic impurities in Al2O3 powder as discussed in Section 3.3. The change in normalized flow resistance after exposing the loaded filter to 40% RH decreases as the ratio of Al2O3 particles to NaCl particles increases. The increased change in normalized flow resistance is nonlinear with the greatest rise seen for initial addition of NaCl to 10% and 25% of the total aerosols. The change in normalized flow resistance after exposure to 40% RH when loaded with a 50:50 particle mixture at 0% RH is approximately half of that found for 100% NaCl particles in .
The impact of exposure to elevated RH on filtration efficiency is also increased as the fraction of Al2O3 particles decreases. The relation is best described by a linear fit but has a higher degree of variability than the normalized flow resistance. The change in filtration efficiency for exposure to 40% RH is ∼0 for an aerosol of 100% Al2O3 particles and rises to ∼0.1 for 100% NaCl. A filter loaded with a 50:50 particle mixture shows a loss of efficiency equal to somewhat less than half of that found for the same filter loaded only with NaCl particles. As the non-hygroscopic particles have shown no response to changes in RH, any changes are a result of the fraction of loaded particles represented by NaCl. The NaCl particles can have an impact on the non-hygroscopic Al2O3 particles as they are mixed in the flow and will deposit as mixed aggregates on the filter media.
Similar to the experiments with either hygroscopic or non-hygroscopic particles, exposing a filter loaded with a mixture of particles to an RH less than or equal to the RH during loading results in insignificant changes in normalized flow resistance and efficiency (results not shown).
4. DISCUSSION
The results in this work show that RH during loading and exposure of air filters with hygroscopic particles can significantly influence the filter properties. Reductions in filtration efficiency and/or flow resistance were seen for all tests where a filter loaded with hygroscopic particles was exposed to an RH higher than that during loading. No changes in properties were seen with RH changes when the filter was loaded with non-hygroscopic (Al2O3) particles. Filters loaded with mixtures of hygroscopic and non-hygroscopic particles showed a response to humidity changes, indicating that RH can be an important factor in real filter operation. Changes in filter properties after exposure to an elevated RH were found to be irreversible when the filter was again exposed to a reduced RH, but further changes were seen upon subsequent exposure to even higher RH. The irreversible nature of the process along with the constant properties of a clean filter at varying levels of RH indicates that the particles captured in the filter media are undergoing a morphological or structural change. Measurements of downstream particle concentration during the testing show that the loss of flow resistance due to exposure is not accompanied by an increase in downstream particle concentration and that the entire particle mass remains within the filter media during the changes.
Joubert et al. (Citation2011) have proposed that similar changes seen in the filtration characteristics when HEPA filters are exposed to elevated RH is a result of swelling of individual particles in the filter cake. The work of Hu et al. (Citation2010) shows that hygroscopic particles exhibit a GF of 0–10% for particles of 20–200 nm over a RH range of 0–70%. The HVAC filters investigated in this study do not form dust cakes but rather capture the particles throughout the depth of the media. Captured particles grow as aggregates into dendrite structures (Kasper et al. Citation2010). A potential explanation for the change in loaded filter properties with RH is a change in the physical structure of these aggregates and dendrites.
shows a schematic of a possible structural change of a dendrite of captured particles when exposed to elevated RH. The initial dendrite structure is formed as particles are captured within the media at low RH (). If air at an elevated RH passes through the filter, the hygroscopic particles will absorb moisture and grow in size (). This growth in individual particles can impose forces on the dendrite structure if they are constrained, resulting in potential damage or reshaping of the aggregates (). A change in shape would result in changes of flow resistance and filtration efficiency, both of which are the functions of particle arrangement within the filter media (Thomas et al. Citation2001).
FIG. 9. Schematic of potential particle aggregate changes due to growth of individual particles constrained in the structure when exposed to elevated RH.
As the non-hygroscopic particles have shown no response to changes in RH, any changes are a result of the fraction of loading represented by hygroscopic particles. The hygroscopic particles can have an impact on the non-hygroscopic particles as they are mixed in the flow and will deposit as mixed aggregates on the filter media. Therefore, a possibility exists for a dendrite to contain hygroscopic particles at the base that can cause the entire structure of mixed particles to collapse.
Another potential cause of changes in aggregate shape along with growth of the particles could be uptake of water on the particle surface. Nano-sized NaCl particles have been shown to uptake liquid water films when exposed to high RH below the deliquescence point (Wise et al. Citation2008). Water uptake has been shown at an RH of as low as 65% (Bruzewicz et al. Citation2011). The potential exists for this mechanism at lower RH, although it has not been observed experimentally. The uptake of liquid water would result in surface tension being imposed on adjacent particles in the aggregate structures, which could add to the change or collapse of the aggregate morphology.
The general trends of flow resistance changes in this work were also seen for filters loaded with Na2SO4 particles and carbon soot particles generated from a PALAS GFG 1000. The similar response of both Na2SO4 and NaCl particles indicates that the structural change is not a result of the specific hygroscopic particle used. Weingartner et al. (Citation1997) have shown that suspended carbon soot agglomerates show reductions in mobility size when exposed to airstreams with increasing RH. This lends support to the potential for collapse of aggregates of hygroscopic particles when exposed to RH well below deliquescence.
The changes in loaded filter characteristics seen in this study will also be present in filters loaded under similar conditions in real installations. The range of RH tested (0%–60%) is common in many HVAC systems. For example, cities in Arizona and other desert locations experience long periods with outdoor RH of less than 20% during summer months and increasing humidity through the winter. Under these conditions, the flow resistance and filtration efficiency resulting from loading under dry conditions could be dramatically altered after exposure to the elevated RH.
The response of loaded filters to changes in RH presented in this work shows that a change or cycling from low to high RH will result in a different filter performance than would be seen for a filter operating under constant RH conditions. Changes in filter properties due to changes in RH can result in variations in performance characteristics between installations at different locations or at different times and present a barrier for even comparison of in situ filter operation. The existing ASHRAE 52.2-2012 test methods do not account for variations in RH during loading. The significant impact of RH on loaded filter properties is a potential explanation for the differences seen between real and laboratory filter operations (Raynor and Chae Citation2003). These discrepancies are likely to be greater for filters operating at locations with higher fractions of hygroscopic particles and will be difficult to predict from the existing knowledge on this topic. Future iterations of the standardized test method should be developed that account for humidity variations to ensure that the filter performance during standardized testing more closely resembles the performance in real installations.
5. CONCLUSIONS
This study investigated the influence of RH on the properties of air filters loaded with hygroscopic and non-hygroscopic particles. Flat sheets of commercial filter media were loaded with NaCl and Al2O3 particles in a laboratory test apparatus. After loading at a specified RH, the filters were exposed to clean air. A reduction in flow resistance and filtration efficiency were seen when the RH of the clean air for exposure was higher than that during loading for filter media loaded with hygroscopic particles. The changes observed were found to be irreversible in nature, indicating an underlying physical change in the structure of the captured dust. No changes were observed for the bare filter or for filters with adhering non-hygroscopic particles.
The impact of exposure to RH was found to be a function of filter media, the level of dust loading, and both the loading and exposure RH. The changes were greater with increased levels of dust loading and for filters loaded with higher proportions of hygroscopic particles. The greatest changes were seen when the loaded filter was exposed to the highest level of RH in the study (RH = 60%). The RH range tested was limited to 60% to ensure no deliquescence of hygroscopic particles but is still relevant for many real world HVAC installations.
A hypothesis for the underlying physical change in particle properties responsible for the change in filter characteristics was presented. It is postulated that the aggregates of particles captured within the filter media while loading at low RH undergo a growth in the primary particle size when exposed to elevated RH. This increase in particle size could impose stress on the structure resulting in physical restructuring of the captured dust, which would explain the irreversible changes. Further research to identify and quantify changes in particle aggregate structures with RH is required to confirm this hypothesis.
The results from this work have shown that RH can be an important factor in determining the operation characteristics of an HVAC air filter. This can result in modifications in effectiveness or energy costs to operate a filter between installations that has not previously been considered. The impact of RH should be accounted for in future filter test standards to ensure that they more closely represent real filter operations.
REFERENCES
- Arnold, B. D., Matela, D. M., and Veeck, A. C. (2005). Life-Cycle Costing of Air Filtration. ASHRAE J. 47(11):30–32.
- ASHRAE. (2012). ANSI/ASHRAE Standard 52.2–2012, Method of Testing General Ventilation Air-Cleaning Devices for Removal Efficiency by Particle Size. American Society of Heating, Refrigerating, and Air Conditioning Engineers, Atlanta, GA.
- Bémer, D., and Callé, S. (2000). Evolution of the Efficiency and Pressure Drop of a Filter Media with Loading. Aerosol Sci. Technol. 33(5):427–439.
- Biskos, G., Russell, L. M., Buseck, P. R., and Martin, S. T. (2006). Nanosize Effect on the Hygroscopic Growth Factor of Aerosol Particles. Geophys. Res. Lett. 33(7):L07801.
- Brown, R. C. (1993). Air Filtration—An Integrated Approach to the Theory and Applications of Fibrous Filters. Pergaman Press, New York, NY.
- Bruzewicz, D. A., Checco, A., Ocko, B. M., Lewis, E. R., McGraw, R. L., and Schwartz, S. E. (2011). Reversible Uptake of Water on NaCl Nanoparticles at Relative Humidity below Deliquescence Point Observed by Noncontact Environmental Atomic Force Microscopy. J. Chem. Phys. 134(4):044702.
- Endo, Y., Chen, D. R., and Pui, D. (1998). Bimodal Aerosol Loading and Dust Cake Formation on Air Filters. Filtr. Sep. 35(2):191–195.
- Fisk, W. J., Faulkner, D., Palonen, J., and Seppanen, O. (2002). Performance and Costs of Particle Air Filtration Technologies. Indoor Air 12(4):223–234.
- Gupta, A., Novick, V. J., Biswas, P., and Monson, P. R. (1993). Effect of Humidity and Particle Hygroscopicity on the Mass Loading Capacity of High Efficiency Particulate Air (HEPA) Filters. Aerosol Sci. Technol. 19(1):94–107.
- Hu, D., Qiao, L., Chen, J., Ye, X., Yang, X., Cheng, T., and Fang, W. (2010). Hygroscopicity of Inorganic Aerosols: Size and Relative Humidity Effects on the Growth Factor. Aerosol Air Qual. Res. 10:255–264.
- Japuntich, D. A., Stenhouse, J., and Liu, B. Y. H. (1994). Experimental Results of Solid Monodisperse Particle Clogging of Fibrous Filters. J. Aerosol Sci. 25(2):385–393.
- Joubert, A., Laborde, J. C., Bouilloux, L., Callé-Chazelet, S., and Thomas, D. (2010). Influence of Humidity on Clogging of Flat and Pleated HEPA Filters. Aerosol Sci. Technol. 44(12):1065–1076.
- Joubert, A., Laborde, J. C., Bouilloux, L., Chazelet, S., and Thomas, D. (2011). Modelling the Pressure Drop Across HEPA Filters During Cake Filtration in the Presence of Humidity. Chem. Eng. J. 166(2):616–623.
- Kasper, G., Schollmeier, S., and Meyer, J. (2010). Structure and Density of Deposits Formed on Filter Fibers by Inertial Particle Deposition and Bounce. J. Aerosol Sci. 41(12):1167–1182.
- Langlet, M., Nadaud, F., Benali, M., Pezron, I., Saleh, K., Guigon, P., and Metlas-Komunjer, L. (2011). Kinetics of Dissolution and Recrystallization of Sodium Chloride at Controlled Relative Humidity. Kona Hosokawa Powder Technol. Found. 29:168–179.
- Miguel, A. F. (2003). Effect of Air Humidity on the Evolution of Permeability and Performance of a Fibrous Filter During Loading with Hygroscopic and Non-Hygroscopic Particles. J. Aerosol Sci. 34(6):783–799.
- Montgomery, J. F., Green, S. I., Rogak, S. N., and Bartlett, K. (2012). Predicting the Energy use and Operation Cost of HVAC Air Filters. Energy Buildings. 47:643–650.
- Novick, V. J., Klassen, J. F., and Monson, P. R. (1992). Predicting Mass Loading as a Function of Pressure Difference Across Prefilter/Hepa Filter Systems. 22nd DOE/NRC Nuclear Air Cleaning and Treatment Conference, Denver, CO.
- Pöschl, U. (2005). Atmospheric Aerosols: Composition, Transformation, Climate and Health Effects. Angew. Chem. Int. Edit. 44(46):7520–7540.
- Raynor, P. C., and Chae, S.-J. (2003). Dust Loading on Electrostatically Charged Filters in a Standard Test and a Real HVAC System. Filtr. Sep. 40(2):35–39.
- Romay, F. J., Liu, B. Y. H., and Chae, S.-J. (1998). Experimental Study of Electrostatic Capture Mechanisms in Commercial Electret Filters. Aerosol Sci. Technol. 28(3):224–234.
- Sanchez, A. L., Hubbard, J. A., Dellinger, J. G., and Servantes, B. L. (2013). Experimental Study of Electrostatic Aerosol Filtration at Moderate Filter Face Velocity. Aerosol Sci. Technol. 47(6):606–615.
- Song, C. B., Park, H. S., and Lee, K. W. (2006). Experimental Study of Filter Clogging with Monodisperse PSL Particles. Powder Technol. 163(3):152–159.
- Sun, C., and Woodman, D. (2009). Delivering Sustainability Promise to HVAC Air Filtration—Part I: Classification of Energy Efficiency for Air Filters. ASHRAE Trans. 115:581.
- Thomas, D., Contal, P., Renaudin, V., Penicot, P., Leclerc, D., and Vendel, J. (1999). Modelling Pressure Drop in HEPA Filters During Dynamic Filtration. J. Aerosol Sci. 30(2):235–246.
- Thomas, D., Penicot, P., Contal, P., Leclerc, D., and Vendel, J. (2001). Clogging of Fibrous Filters by Solid Aerosol Particles—Experimental and Modelling Study. Chem. Eng. Sci. 56(11):3549–3561.
- Walsh, D. C., and Stenhouse, J. (1997). The Effect of Particle Size, Charge, and Composition on the Loading Characteristics of an Electrically Active Fibrous Filter Material. J. Aerosol Sci., 28(2):307–321.
- Walsh, D. C., and Stenhouse, J. I. T. (1998). Parameters Affecting the Loading Behavior and Degradation of Electrically Active Filter Materials. Aerosol Sci. Technol. 29(5):419–432.
- Weingartner, E., Burtscher, H., and Baltensperger, U. (1997). Hygroscopic Properties of Carbon and Diesel Soot Particles. Atmos. Environ. 31(15):2311–2327.
- Wise, M. E., Martin, S. T., Russell, L. M., and Buseck, P. R. (2008). Water Uptake by NaCl Particles Prior to Deliquescence and the Phase Rule. Aerosol Sci. Technol. 42(4):281–294.