
Abstract
The soot particle aerosol mass spectrometer (SP-AMS) instrument combines continuous wave laser vaporization with electron ionization aerosol mass spectrometry to characterize airborne, refractory black carbon (rBC) particles. The laser selectively vaporizes absorbing rBC-containing particles, allowing the SP-AMS to provide direct chemical information on the refractory and non-refractory chemical components, providing the potential to fingerprint various rBC particle types. In this study, SP-AMS mass spectra were measured for 12 types of rBC particles produced by industrial and combustion processes to explore differences in the carbon cluster (Cn+) mass spectra. The Cn+ mass spectra were classified into three categories based on their ion distributions, which varied with rBC particle type. The carbon ion distributions were investigated as a function of laser power, electron ionization (on/off), and ion charge (positive or negative). Results indicate that the dominant positive ion-formation mechanism is likely the vaporization of small, neutral carbon clusters followed by electron ionization (C1+ to C5+). Significant ion signal from larger carbon cluster ions (and their fragment ions in the small carbon cluster range), including mid carbon (C6+ to C29+) and fullerene (greater than C30+) ions, were observed in soot produced under incomplete combustion conditions, including biomass burning, as well as in fullerene-enriched materials. Fullerene ions were also observed at high laser power with electron ionization turned off, formed via an additional ionization mechanism. We expect this SP-AMS technique to find application in the identification of the source and atmospheric history of airborne ambient rBC particles.
Copyright 2015 American Association for Aerosol Research
INTRODUCTION
Black carbon (BC) containing particles are generated as industrial products and as a byproduct of incomplete combustion processes. Industrial applications include reinforcing material in rubber compounds, ink pigments as well as fullerenes and carbon nanotubes for a variety of technical and medical products (Baughman et al. Citation2002; Scida et al. Citation2011). Combustion-generated soot particles, which contain black carbon, are an important airborne pollutant (Bond et al. Citation2007). Black carbon, also termed as refractory black carbon (rBC) or sometimes elemental carbon (EC) (Andreae and Gelencsér Citation2006; Petzold et al. Citation2013), is the dominant light-absorbing particulate material that heats the atmosphere (Bond et al. Citation2013). In addition to directly absorbing sunlight, BC particles can become incorporated into cloud droplets and deposit on snow and ice surfaces, changing cloud properties and surface reflectivity, respectively (Jacobson Citation2006; Hadley and Kirchstetter Citation2012). These processes significantly modify the earth's radiation balance (Ramanathan and Carmichael Citation2008; Bond et al. Citation2013). Furthermore, atmospheric BC containing particles have been demonstrated to be deleterious to human health (Dockery et al. Citation1993; Brugge et al. Citation2007; Lee et al. Citation2010).
The chemical composition and structure of BC particles, and thus their physical and optical properties (Bond and Bergstrom Citation2006), depend on their methods of production (Vander Wal and Tomasek Citation2004). For example, BC-containing soot produced rapidly by spark discharge is highly disordered, and therefore highly reactive (Schmid et al. Citation2011). At the other extreme, thermally treated and laser-heated BC contains more-ordered graphitic structures (Oberlin Citation1984; Vander Wal and Jensen Citation1998), which are correspondingly less reactive (Schmid et al. Citation2011). Environmentally relevant BC samples produced by diesel engines, aircraft turbines, or biomass burning exhibit a wide range of chemical structures, which may aid in the identification of ambient soot sources (Vander Wal et al. Citation2010, Citation2014). This range of chemical and physical properties, which depends upon the efficiency of combustion, affects the BC optical properties and has been described as soot “maturity” (López-Yglesias et al. Citation2014). Traditional measurements of chemical and physical properties of BC particulate materials include a variety of offline, filter-based techniques, such as Raman and X-ray-based spectroscopies, transmission electron microscopy (TEM) and scanning electron microscopy (SEM), and EC/OC thermal optical techniques (Vander Wal Citation1997; Bond and Bergstrom Citation2006; Lack et al. Citation2014). Laser vaporization and mass spectrometric measurements are other important approaches with the potential for rapid, on-line analysis, including soot particle aerosol mass spectrometry (SP-AMS) (Onasch et al. Citation2012; Corbin et al. Citation2014) and single particle laser ablation mass spectrometry (Sinha Citation1984; Ferge et al. Citation2006; Maricq Citation2009).
Mass spectrometric studies of the carbon vapors formed from heated (<2500 K) graphitic carbon filaments were initiated in the 1950s (Chupka and Inghram Citation1953a,Citationb). Laser vaporization mass spectrometry was employed to study carbon clusters (i.e., pure carbon molecules) in supersonic beams, specifically for clusters with greater than four carbon atoms (Rohlfing et al. Citation1984; Pflieger et al. Citation2008). Such studies led to the discovery of buckminsterfullerene (C60) and the classification of fullerenes, in general, as a carbon allotrope (Kroto et al. Citation1985; Krätschmer et al. Citation1990). Following the discovery of C60, a wide range of laser vaporization mass spectrometric studies were conducted on BC-containing material. Most of these studies utilized single wavelength, high intensity pulsed lasers for desorption and ionization, which have been shown to directly influence the measured carbon cluster ion distributions; in particular, the distribution of fullerene species (Elsila et al. Citation2005; Spencer et al. Citation2008). Previous studies have shown that various carbon materials undergo temperature-driven annealing or graphitizing to different extents (i.e., graphitizing and non-graphitizing carbon) (Harris Citation2005). High-resolution transmission electron microscopy (HR-TEM) studies have shown partial annealing of BC particles due to heat treatment via pulsed laser light (e.g., laser-induced incandescence techniques), even for extremely rapid (greater than 109 K/s) heating and cooling rates and total times at elevated temperatures of the order of microseconds (Vander Wal and Jensen Citation1998; Vander Wal and Choi Citation1999). A subgroup of these studies focused on vaporizing carbon using laser beams with light intensities below the threshold for plasma formation to investigate the thermodynamic parameters of vaporized carbon clusters or the presence of fullerenes (Buseck et al. Citation1992; Wilson et al. Citation1993; Pflieger et al. Citation2008).
The mass spectrometric studies described in this work were conducted using a recently developed instrument, designated as SP-AMS (Onasch et al. Citation2012), that relies on a continuous wave (CW) laser to vaporize sampled airborne BC particles. The refractory and non-refractory particulate matter (R-PM, including rBC, and NR-PM, respectively) components of absorbing rBC particles are detected using electron ionization mass spectrometry (hereafter, BC detected by the SP-AMS will be referred as refractory black carbon [rBC]). Previous SP-AMS work has shown that the sum of the measured carbon cluster ions is proportional to sampled particulate rBC mass (Onasch et al. Citation2012) and that differences in the Cn+ mass spectra may be related to the chemical structure of rBC (Corbin et al. Citation2014). Here we focus on the measured Cn+ mass spectra for 12 different rBC particle types, including graphitic, amorphous, and fullerenic carbon, and investigate the mechanisms behind the formation of these ions. We investigated the Cn+ mass spectra as a function of the SP-AMS laser power, electron ionization (on/off), and the charge of the resulting ions (positive or negative). The real-time, online aerosol particle measurements of SP-AMS are shown to provide potentially useful information for apportioning the mass loading of ambient rBC particles to different sources.
EXPERIMENTAL SECTION
Soot Particle Aerosol Mass Spectrometer
The SP-AMS instrument measures the mass spectra of vaporized material from sampled particles containing rBC. A detailed description of the SP-AMS is presented in Onasch et al. (Citation2012). The SP-AMS is a high-resolution aerosol mass spectrometer (HR-AMS) (DeCarlo et al. Citation2006; Kimmel et al. Citation2011) equipped with a CW laser vaporizer based on the Single Particle Soot Photometer (SP2) instrument design (Baumgardner et al. Citation2004; Schwarz et al. Citation2006, Citation2010). The HR-AMS 600°C thermal vaporizer may be used in combination with the CW laser vaporizer to study both NR-PM and light-absorbing R-PM (e.g., rBC). In the experiments presented here, the SP-AMS instrument was operated with only the CW laser vaporizer, making it selectively sensitive to laser light absorbing particles, such as those containing rBC (Cross et al. Citation2010).
Airborne particles are sampled by the instrument through an aerodynamic lens inlet that focuses particles into a converging beam while the sampled gas is removed via multiple stages of differential pumping. The particle beam intersects the laser vaporizer in the detection region and vaporized R-PM and NR-PM components are ionized by a 70-eV electron beam (electron ionization) and detected by high-resolution time-of-flight mass spectrometry (HR-TOF-MS).
The CW laser vaporizer is an intracavity Nd:YAG laser (1064 nm) pumped using an 808-nm diode laser. The laser cavity, defined by the distance from the Nd:YAG crystal to the mirror and the curvature of the mirror, is designed to generate a Gaussian laser beam with ∼1-mm diameter (defined for a width of 4σ, ±2σ from mean, where σ is the standard deviation) inside the ionization/detection region of the SP-AMS. Willis et al. (Citation2014) estimate that the effective laser beam diameter in the SP-AMS for rBC detection is smaller than the optical diameter (4σ ≤ 0.72 mm). An externally mounted CCD camera is used to track the power, alignment, and the transverse electro-magnetic (TEM) modes of the laser beam by monitoring the small fraction of light transmitted through the mirror. The laser beam power density in the cavity (0.2 MW/cm2) was estimated by measuring the transmission coefficient of the mirror (3 × 10⁻⁴). During standard operation, the laser power is monitored in real-time using the light leaking through the mirror. The laser energy deposited into a single rBC particle is estimated to be ∼1 nJ (or ∼1 erg/pg), assuming a typical rBC particle mass of ∼6 fg (volume equivalent diameter of 200 nm and effective density of 1.4 g/cm3) (Schwarz et al. Citation2006). Previous studies suggest that this energy density is below the threshold for plasma formation from black carbon materials (Buseck et al. Citation1992; Gamaly et al. Citation1999; Pflieger et al. Citation2008), although the particles’ temperature increase and heating rates may induce partial annealing (Vander Wal and Choi Citation1999).
The HR-TOF-MS is an orthogonal extraction, reflectron, time-of-flight mass spectrometer from Tofwerk AG (HTOF Platform, Thun, Switzerland), which is standard on all HR-AMS instruments and has been described in detail by DeCarlo et al. (Citation2006). The ion formation chamber is a cross-beam ion source (Pfeiffer Vacuum GmbH) modified to place the electron filament on the ion-extraction axis and with holes drilled on the sides for the laser vaporizer. Ions are accelerated with a 100–200 V potential between the ion source and pulsers and extracted orthogonally into the time-of-flight path every 30–100 μs, depending upon the m/z range of interest. The ion detector comprises two multichannel plates in chevron operated at ∼2 kV with a post-acceleration voltage of ∼3.5 kV. As reported by Gilmore and Seah (Citation2000), the detection efficiencies for high mass ions (>300 m/z) are a strong function of the ion impact energy at the MCP detector. While the current system has not been tested for detecting high mass ions in this regard, all the data in the current study were obtained with SP-AMS instruments operated with similar MS tuning voltages, implying similar detection efficiencies as a function of m/z. This study focuses on qualitative, rather than quantitative, changes to the measured carbon cluster ion mass spectra with the intent of explaining the origins for the observed carbon ion signals in the SP-AMS, and our observations and conclusions should not be significantly affected by this issue. Future work to quantitatively assess SP-AMS carbon cluster ion signals will need to explicitly account for this issue.
The HR-TOF-MS was operated with a mass resolving power, m/Δm, of ∼2000–3000 (V-mode) measured at m/z 200 (m is the mass of a specific ion; Δm is the measure of the peak width, e.g., full width at half maximum [FWHM]) (DeCarlo et al. Citation2006). This resolution enables the identification, separation, and quantification of carbon ions from typical organic and inorganic ions at a given m/z, such as SO2+ (47.96698), C4+ (48.00000), and CH4O2+ (48.02113) at 48 m/z. Polycyclic aromatic hydrocarbons (PAH's), which can be co-generated by rBC particle sources, produce ions in the midrange region ∼300 m/z (Dzepina et al. Citation2007), which may also be resolved from carbon cluster ions.
The ion optics in the SP-AMS instrument were equipped with a bipolar power supply, enabling the sequential study of both positive and negative ions. Standard impact energies of 70 eV typically generate positive ions from neutral molecules; however, secondary electrons may also attach to neutral molecules, generating negative ions. Positive ions may also be generated via other ionization mechanisms, such as thermal ionization, which may occur during particle vaporization for materials with low ionization potentials (e.g., alkali metals).
In this study, we focus exclusively on the carbon cluster ion signals (Cn+ or Cn−). The sum of these Cn+ (Cn−) ions is a measure of sampled particulate rBC mass (Onasch et al. Citation2012). In addition to the Cn+ (Cn−) ion signals, the SP-AMS mass spectra contained ion signals due to organic and inorganic compounds associated with rBC materials. For laboratory-generated rBC particles with little or no associated organic components (RBC < 0.5), there is negligible (<1%) interference at these Cn+ ion signals (Corbin et al. Citation2014). For rBC particles with significant associated organic material (RBC ≥ 10), the fraction of Cn+ ion signal from organic materials can become significant (>10%), depending upon the chemical composition and fragmentation of the associated organic material. However, the Cn+ fragmentation patterns from organic and rBC material differ, with C3+ the dominate fragment (∼0.45) of the low carbon ion signal from rBC material and C1+ the dominant fragment (>0.6) of the low carbon ion signal from organic material. Note that one could use the correction to C1+, based on the measured C3+ ion signal from Onasch et al. (Citation2012) to reduce the potential impact of Cn+ ion signal interference from associated organic material, although this correction was not used in the current study.
Typical measurements using the SP-AMS are done with the laser vaporizer set at maximum power (∼105 W/cm2), 70 eV electron ionization, and positive ion detection. Here we varied the following instrument settings to investigate the parameters affecting Cn+ ion signal distributions: (i) positive and negative ion detection, (ii) ionizing electron filament on (70 eV) and off (i.e., thermal ionization only), and (iii) laser vaporizer power.
Materials Studied
For this study, we selected 12 rBC particle types representing a variety of refractory carbon nanostructures, ranging from amorphous to graphitic to fullerenic (Vander Wal et al. Citation2010). A complete list and description is given in . The materials included are as follows: graphitic carbon nanoparticles (Aquadag), carbon black (Regal black), amorphous carbon (carbon nanoparticles and glassy carbon spheres), surface-oxidized carbon (NoritSX-activated charcoal), combustion-generated soots (premixed ethylene flame and methane diffusion flame soots generated at several fuel equivalence ratios, φ), and fullerene-enriched carbon (Alfa Aesar fullerene soot and Nano-C fullerene black). In addition, we aerosolized and sampled particles of 99.9% pure C60 (buckminsterfullerene), specified by the manufacturer (MER Corporation). All of these rBC particle types were measured by the SP-AMS to have rBC mass fractions greater than 0.65 (RBC < 0.5), with the majority having rBC mass fractions greater than 0.9.
TABLE 1 Refractory black carbon (rBC) materials sampled in this work
All the manufactured materials, except for C60, were dispersed in distilled water via sonication, aerosolized using a TSI constant output atomizer (model 3076), and dried in a diffusion drier to less than 20% relative humidity (RH) prior to sampling by the SP-AMS instrument. The materials were sampled as either polydisperse or monodisperse aerosol, with peak and selected mobility diameters in the range of 100 to 400 nm. The C60 material was milled in a nitrogen atmosphere and aerosolized via a dry powder dispersion process (Tiwari et al. Citation2013). The laboratory-based combustion soot particles, generated using either premixed ethylene (Cross et al. Citation2010) or methane diffusion flame (Stipe et al. Citation2005) sources, were sub-sampled from the flame effluent, diluted with particle-free air, and mobility size selected prior to measurement.
In addition to the laboratory-generated rBC particle types, we sampled rBC particles in situ using extractive sampling methods from open flame burning of biomass materials obtained during the FLAME3 study at the Montana Fire Science Laboratory (McMeeking et al. Citation2009) and from the exhaust of diesel trucks in traffic at the Caldecott Tunnel in Berkeley, California (Dallmann et al. Citation2014). The diesel truck exhaust was measured to have an average rBC mass fraction of 0.38 ± 0.12 (RBC ∼ 1.6) (Dallmann et al. Citation2012). The biomass burning soots exhibited measured average rBC mass fractions that ranged from 0.07 (lodgepole pine and turkey oak; RBC ∼ 13) to 0.13 (gallberry; RBC ∼ 7) to 0.47 (manzanita; RBC ∼ 1.1).
RESULTS AND DISCUSSION
Positive Carbon Ion Mass Spectra
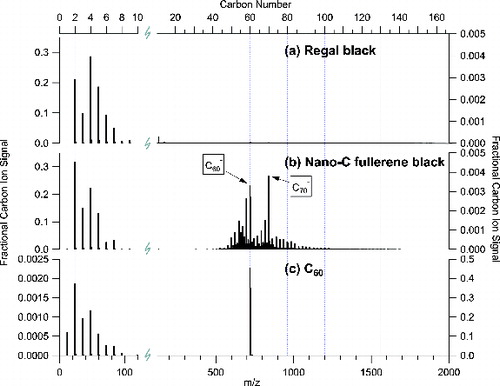
We obtained SP-AMS Cn+ mass spectra for all of the rBC materials listed in . shows the positive ion mass spectra for four laboratory-generated particle types selected for their distinct spectral profiles: (a) Regal black, (b) premixed ethylene flame soot generated with a fuel equivalence ratio (φ) of 2, (c) Nano-C fullerene black, and (d) C60 (buckminsterfullerene). The number of carbon atoms comprising Cn+ in each mass spectrum are separated into three basic categories (low carbon: C1+ to C5+, mid carbon: C6+ to C29+, and fullerenes: C30+/C602+ to C166+), which may be related to the stable structures of Cn+ ions (i.e., linear, rings, and fullerenes) as indicated at the top of (Bowers Citation2014).
FIG. 1. Normalized positive ion mass spectra for (a) Regal black, (b) ethylene soot, (c) Nano-C fullerene black, and (d) C60. Mass spectra represent the measured refractory carbon ion count rate (Hz) normalized to the total carbon ion signal as a function of mass-to-charge ratio (m/z) up to 2000 m/z. The displayed m/z scale corresponds to carbon cluster ions from C1+ (12 m/z) to C166+ (1992 m/z) as shown on top axis. The C1+–C5+ region has been expanded for clarity. The top of the figure shows the SP-AMS mass spectrometric categories and the related structures for stable carbon clusters.
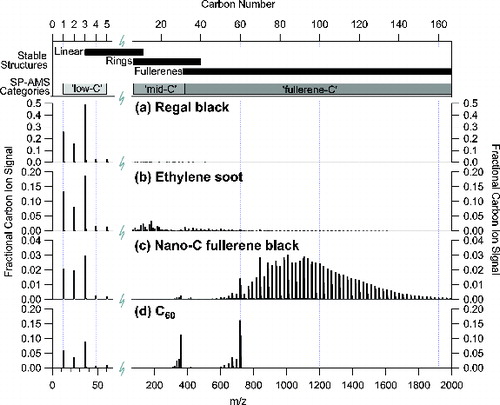
A common feature of all the mass spectra shown in is the presence of significant signals at low carbon numbers (C1+ to C5+). The higher signals of cations with odd numbers of carbons is consistent with their greater stability (Drowart et al. Citation1959). In the mass spectra shown in , the mass spacing for the dominant Cn+ ion signals below C30+ is 12 m/z (C1), whereas the spacing for dominant carbon ion signals above C30+ is 24 m/z (C2). This spacing change may represent a transition from carbon clusters with open 1D and 2D structures (e.g., linear chains, monocyclic and polycyclic rings) to closed or hollow 3D, geodesic structures (Rohlfing et al. Citation1984; Bloomfield et al. Citation1985; von Helden et al. Citation1993; Handschuh et al. Citation1995; Bowers Citation2014).
The mass spectrum of Regal black particles (a) consists primarily of the carbon cluster ions C1+ to C5+ (∼99% of the total Cn+ signals), with a minor contribution from clusters greater than C5+. Similar carbon ion distributions were measured for Aquadag (graphitic carbon), carbon nanoparticles and glassy carbon spheres (amorphous carbon), methane diffusion flame soot (φnet = 0.7), and NoritSX (activated charcoal).
Mass spectra of ethylene flame soot (φ = 2) contained significant fractions of ions greater than C5+ (b), including measureable, although small, ion signals for carbon clusters beyond 2000 m/z (C166+) (not shown). In particular, ethylene flame soot exhibited significant ion signals in the mid carbon range between 60 m/z (C5+) and 360 m/z (C30+ and C602+) (∼0.25 of the total Cn+ signals). The rBC materials with significant mid carbon ion fractions (ranging from >0.5 to ∼0.03) in decreasing order included (i) laboratory-based ethylene soot generated in a pre-mixed, flat-burner flame source (φ = 5, 4, 3, 2), (ii) biomass burning soot (gallberry, turkey oak, lodgepole pine, and manzanita), and (iii) Alfa Aesar fullerene soot. All other samples generated negligible (<0.03) fractions of carbon ion signals in the mid carbon category. Mid carbon ion signals were not observed consistently, even for similar rBC particle types. This observation will be discussed later in more detail. These Cn+ ion signals appear to be sensitive either to source conditions (e.g., combustion conditions), instrument parameters, or both.
The Cn+ mass spectrum of Nano-C fullerene black (c) was dominated by a series of ion signals greater than 360 m/z (corresponding to C30+ and C602+) (>95% of the total Cn+ signals), although it also exhibited signals at low carbon numbers. While the large carbon cluster ion distribution peaks around 1200 m/z, there are large signals at 720 m/z (C60+) and 840 m/z (C70+), which stand out in the sequence (i.e., as “magic numbers”), indicating the presence of especially stable fullerenes (Fowler Citation1986). This positive carbon ion series has been identified as being dominated by fullerene ions, especially for carbon numbers greater than 45 (Bowers Citation2014). In this work, we define total positive fullerene ion signals as being the sum of Cn+ signal from C30+/C602+ to C166+.
The carbon ion mass spectrum for C60 (d) was dominated by signals at 720 m/z (C60+) and 360 m/z (C602+). The carbon-13 isotope abundances at 720 to 726 m/z match those of C60+; in addition, the carbon-13 isotope abundances at 360 m/z also match those of C60+, but at every half mass (i.e., doubly charged). The formation of doubly charged fullerenes, C602+ and C702+ in particular, is also observed in the spectra of Nano-C fullerene black in c. The C60 mass spectrum (d) contained ions reflecting the loss of C2 from both C60+ (m/z spacing of 24) and C602+ (m/z spacing of 12) during fragmentation of the parent ions ( O’Brien et al. Citation1988; Scheier et al. Citation1994). The C60 mass spectrum also shows ion signals at low carbon numbers, which may represent Cn+ ion signals due to potential break up of C60 during preparatory ball milling or carbon vapor (e.g., C2) lost due to fullerene fragmentation during laser vaporization and electron ionization.
In addition to the laboratory rBC material, we also examined rBC containing particles from two common ambient sources. shows measured SP-AMS Cn+ ion mass spectra for (a) on-road diesel truck exhaust and (b) open air biomass burning soot. The diesel truck exhaust was sampled from a single on-road vehicle in the Caldecott Tunnel (Dallmann et al. Citation2012). The Cn+ mass spectrum for the single diesel truck matches the average rBC mass spectrum obtained over 2 h (12:00–14:00 local time) of continuous sampling, during which ∼5% of the vehicles sampled were diesel trucks, suggesting that diesel soot was the dominant source of rBC (Dallmann et al. Citation2014). The diesel soot Cn+ mass spectra were dominated by low carbon ion signals (>0.97).
FIG. 2. Positive carbon ion mass spectra measured in (a) exhaust emissions from a single on-road diesel truck, and (b) smoke from the biomass burning of lodgepole pine. The C1+–C5+ region (1–60 m/z) has been expanded for clarity, and the intensity scales for the C6+ to C83+ region (60–1000 m/z) have been expanded to 1:10 (right axes).
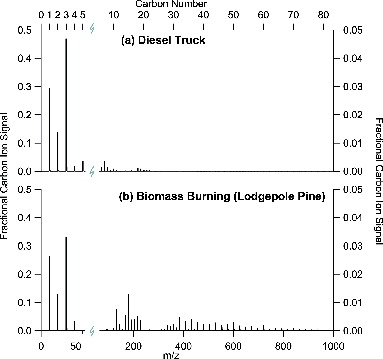
The biomass burning soot (b) was sampled during the open-air combustion of lodgepole pine during the FLAME 3 laboratory experiments (McMeeking et al. Citation2009). Three other biomass fuel types (gallberry, turkey oak, and manzanita) were included in this study to show a range of measured Cn+ ion distributions (mass spectra not shown). All of these biomass fuel types exhibited SP-AMS Cn+ ion distributions with significant ion signals at low carbon numbers (0.68 to 0.92), although lower than diesel soot. It is apparent from that two distinct combustion sources (diesel fuel and lodgepole pine) generated different SP-AMS Cn+ ion mass spectra. These differences illustrate the potential of the SP-AMS Cn+ measurements to provide identification of ambient particulate rBC sources. In the following sections, we explore some of the complexities in the observed mass spectra that are inherent in the SP-AMS technique.
Multiple Sources of Positive Fullerene Ions
Positive ion mass spectra were obtained with 70-eV electron ionization as well as with the electron source (heated tungsten wire filament) turned off. With the filament off, the only ions observed from the sampled rBC particles were alkali metal ions, such as sodium and potassium, and fullerene ions (no multiply charged ions or smaller carbon fragment ions were observed). For rBC particles with no measureable fullerene ion signal using electron ionization (e.g., Regal black and other graphitic and amorphous rBC particle types), no Cn+ ions were observed with the filament off.
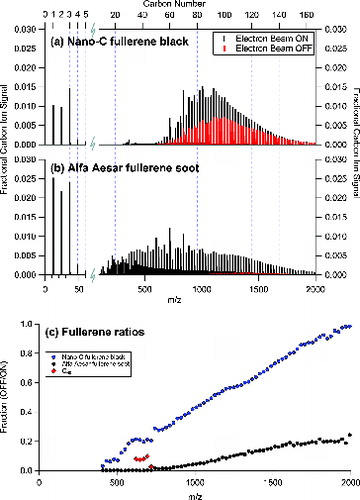
a and b compare the positive ion mass spectra obtained with the filament on and off for (a) Nano-C fullerene black and (b) Alfa Aesar fullerene soot, respectively. c shows the ratio of the positive ion signal with the filament off-to-on for Nano-C fullerene black, Alfa Aesar fullerene soot, and C60 as a function of m/z. Note that the C60 filament off-to-on ratios were only included if the absolute signals had sufficient signal-to-noise; the C60 ratios at 720 m/z were lower than the ratios observed for the fragment ions at C58+, C56+, C54+, and C52+. As is evident in c, the ratio of fullerene ions during filament off-to-on (i) increased with increasing carbon number, with a few exceptions, and (ii) varied significantly between the fullerene-containing materials.
FIG. 3. (a) Normalized carbon ion mass spectra for Nano-C fullerene black with electron beam on (black) and off (gray/red). (b) Normalized mass spectra for Alfa Aesar fullerene soot with electron beam on (black) and off (gray/red). The laser vaporizer is on in both cases. (c) The ratio of carbon ions with electron beam OFF-to-ON for both materials as a function of m/z. The fractional carbon ion signals for electron beam OFF-to-ON from pure C60 is also included in (c) for the five m/z ion peaks with reasonable signal-to-noise; C60+ is the lowest point at the highest m/z in this case.
These observations indicate that in addition to electron ionization, there is, at least, one other mechanism capable of producing positive fullerene ions during CW-laser vaporization. It is likely that the additional ion formation mechanism is via thermionic emission (i.e., thermal energy-driven ionization). Two possible mechanisms for thermionic emission include (1) incoherent, sequential photoexcitation of fullerene molecules in gas phase after vaporization from the laser-heated rBC particles (Ding et al. Citation1994), and (2) direct release of fullerene ions from laser-heated rBC surfaces during the vaporization process. Mechanism (1) would depend on the laser power density (W/cm2) within the ion formation chamber of the instrument and the transit time of the vaporizing fullerene molecules within the laser beam. Mechanism (2) would depend on fullerenes remaining on the laser-heated rBC particle surfaces until heated to the high temperatures of incandescence/sublimation, at that temperature thermal ionization may become efficient. We are unable to positively identify the ionization mechanism that generates positive fullerene ions with the electron filament turned off. However, it is apparent that positive fullerene ion signal levels (i.e., quantification) and ion distributions in the SP-AMS may be affected by other ionization mechanisms in addition to electron ionization, and therefore may change as a function of the laser vaporizer power.
Laser Vaporizer Power Dependence
Laser vaporizer power is an important instrument parameter which influences the total amount of energy available per rBC particle and its corresponding heating rate, and must be controlled to ensure the laser light intensity is high enough to achieve complete vaporization of the rBC particles passing through the laser (Onasch et al. Citation2012). Increasing the laser power increases both the total light intensity and the laser beam cross section, which is important, given the potentially incomplete overlap between the laser beam and sampled particle beams (Willis et al. Citation2014). The results of laser power experiments represent ensemble averages over all of the different trajectories of rBC particles through a given laser beam profile, as governed by the laser beam–particle beam overlap.
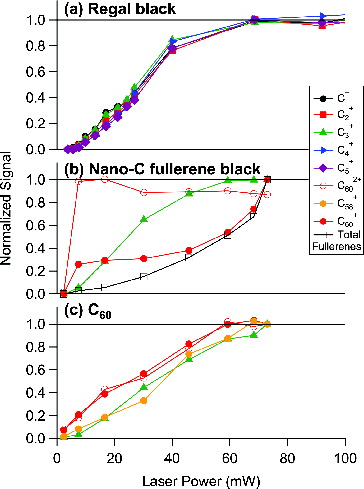
shows selected carbon ion signals (C1+ to C5+, C602+, C58+, C60+, and the total fullerene ion signals) as a function of laser vaporizer power for three rBC particle types: (a) Regal black, (b) Nano-C fullerene black, and (c) C60. All of the carbon ion signals show apparent saturation at the highest laser power attained for each rBC particle type except the fullerene signals in the Nano-C fullerene black sample.
FIG. 4. Laser power studies for (a) Regal black, showing the invariance of C1+–C5+ with laser power, (b) Nano-C fullerene black, showing different laser power dependences for C3+, C602+, C60+, and the total fullerene ion signal (C30+/C602+ to C166+), and (c) C60, showing similarities in laser power dependences for the parent C60+ and C602+ ions and the fragment C3+ and C58+ ions. The laser power axis is a relative measure of the intracavity laser vaporizer power obtained by measuring light leaking through the mirror end of the laser cavity (see text for details).
Regal Black
The carbon ion distribution (C1+–C5+) for Regal black was invariant with laser power, that is, the relative ratios between individual carbon ions (C1+–C5+) were constant with laser power, even as the total ion signal for all ions increases with increasing laser power. The plateau of carbon ion signals with increasing laser power suggests that all Regal black particles passing through the effective region of the laser vaporizer beam were fully vaporized and detected at the higher laser powers. Therefore, the measured C1+–C5+ ion distributions may be a fundamental signature of this carbon type (i.e., carbon black), as there was no evidence for interferences from other ionization mechanisms or fragmentation from larger carbon cluster ions.
Nano-C Fullerene Black
The laser power dependence of the selected ion signals for the fullerene black sample, shown in b, is more complex. As shown in , Nano-C fullerene black samples exhibited ion signals at low (C1+–C5+) and high (fullerene ions >C30+, with some doubly charged fullerene ions, such as C602+) carbon numbers. The low carbon ion signals for Nano-C fullerene black, for clarity shown in b using C3+ only, followed a similar trend to the low carbon ion signals of Regal black (a), saturating at high laser power with invariant relative ratios (latter not shown in the figure). On the other hand, the total fullerene ion signals for Nano-C fullerene black increased with increasing laser power.
Several distinct trends with laser power can be identified for select fullerene ions in the Nano-C fullerene black case. Specifically, the C60+, which is zero at zero laser power, rapidly reaches a relatively constant value at intermediate laser vaporizer powers and subsequently increases significantly with increasing laser power. The C60+ power dependence at higher laser power matches the total fullerene ion signal trend. In contrast, C602+ appears to rapidly saturate with increasing laser power, with only a slight decrease at high laser power. These observations suggest that C60+ from Nano-C fullerene black are produced by two different mechanisms as a function of laser power, one that dominates at low laser power that also generates C602+ and another at high laser power that does not generate C602+ ions. All these observations appear to be consistent with the conclusions of the previous section of an additional laser power-dependent ionization mechanism for fullerene ions that does not generate multiply charged fullerene ions or fragment ions.
C60
The selected C60 carbon ions shown in c did not change significantly with laser power. The parent ion signals, C60+ and C602+, and the small carbon cluster ion signals, C3+ and C58+ (generated via fragmentation of parent ions during ionization or potentially due to non-C60 carbon material generated by the breakup of C60 during preparatory ball milling), all increased with increasing laser power and appeared to level off at higher laser powers, similar to the behavior of low carbon ion signals for Regal black and Nano-C fullerene black but different from the fullerene ion signals (C60+, C602+, and total fullerene ions) of the Nano-C fullerene black. In contrast to Nano-C fullerene black, the fullerene ions from the C60 sample appear to be generated by only one dominant ionization mechanism over the studied range in laser power, which generates both C60+ and C602+ in a constant ratio. This observation agrees with the ratios in c, which suggests that the C60 sample generates fewer C60+ ions (approximately a factor of ∼7 lower) with the filament off than Nano-C fullerene black sample under high laser power conditions. We do not know why the C602+ ions, and associated C60+ ions, saturate at higher laser power conditions for the C60 sample, compared with the Nano-C fullerene black. We included the C60 sample in this study as a known quantity, in contrast to the other fullerene-enriched carbon samples whose compositions are not well characterized; however, pure C60 may have a different absorption cross section than other rBC samples, which may affect its laser power dependence in the SP-AMS.
Negative Ion Mass Spectra
In addition to positive ion mass spectrometry, we also obtained mass spectra of negatively charged carbon ions for several of the sampled rBC materials. This mode of operation provides additional information relevant to understanding the SP-AMS technique. shows normalized negative carbon ion mass spectra for three (Regal black, Nano-C fullerene black, and C60) of the four rBC materials shown in .
FIG. 5. Normalized negative carbon ion mass spectra for (a) Regal black, (b) Nano-C fullerene black, and (c) C60. The scales for the right axes of (a) and (b) are 1:70; the scale for the left axis of (c) is 1:200. The C1−–C10− region has been expanded for clarity.
Five features are notable in . First, at low carbon numbers, the Cn− ion distributions extend to larger cluster sizes (C2−–C10− compared with C1+–C5+) and exhibit an even carbon number preference. This trend is opposite to that observed with the low carbon Cn+ distributions and is consistent with previous observations (Bloomfield et al. Citation1985). Second, virtually no negative mid carbon ions (here defined as between C10− and C30−) were observed. Third, negative fullerene ions were only observed for rBC samples which produced positive fullerene ions (e.g., Nano-C fullerene black, and C60 but not for Regal black, Aquadag, carbon nanoparticles, glassy carbon spheres, or methane diffusion flame soot). Fourth, the apparent fragmentation of C60 in negative ion mode (c) was significantly reduced compared with fragmentation observed in the positive ion mode (d); low carbon negative ion signals were very low (note the scale changes for c), and the negative C2-loss ions (C(60–2n)−) were absent. There were also no multiply charged negative fullerene ions. Fifth, the negative fullerene ion distribution for Nano-C fullerene black (b) was significantly different from the positive fullerene ion distribution (c); the negative ion distribution exhibited a narrower range of fullerene ions with the exceptionally stable C60− and C70− ions more prominent than their positive ion counterparts (c).
Origins of Carbon Cluster Ions in SP-AMS
Low Carbon C1+–C5+
All rBC materials sampled using the SP-AMS exhibit measureable positive ion signals in the low carbon category (C1+–C5+). There are two potential sources for these low carbon ion signals: (i) electron ionization of small carbon clusters in the vapor phase, and (ii) ions generated by vapor phase fragmentation of larger carbon clusters during laser vaporization and/or electron impact. Our observations suggest that both sources may be important, although the latter may be secondary.
Previous work has shown that neutral C1–C5 carbon clusters represent the main vapor components from heated graphitic carbon materials (Pflieger et al. Citation2008) and the most stable geometries of these clusters are linear (von Helden et al. Citation1993). The positive and negative ion mass spectra for Regal black show that the measured carbon ion fraction in the low carbon category (C1+–C5+ or C2−–C10−) is more than 99%. As the distribution of low carbon ions did not change as a function of laser power (a), and low carbon ions were absent in the filament-off mass spectra (), we conclude that the low carbon ion signals from Regal black particles, a high temperature carbon black, are generated by electron ionization of neutral carbon clusters vaporized directly from the rBC particulate material at ∼4000 K (i.e., incandescence) (Schwarz et al. Citation2006; Moteki and Kondo Citation2010). Other rBC materials that also exhibited only low carbon ion signals in the SP-AMS included graphitic nanoparticles (Aquadag), amorphous carbon (carbon nanoparticles and glassy carbon spheres), and “mature” soot (methane diffusion flame soot).
It is also possible that a fraction of low carbon ion signals will be generated from fragmentation of larger carbon clusters. Previous work has shown that fullerene ions, such as C60+, can fragment by expelling small carbon clusters, such as C2, and reclosing into smaller fullerene ions, such as C58+ (Kroto et al. Citation1991; Foltin et al. Citation1993); smaller carbon cluster ions (<C20+) may fragment expelling C3 (Geusic et al. Citation1987). We observed evidence for fullerene ion fragmentation; the positive ion mass spectrum of C60 in d shows significant Cn+ ion signals in the low carbon category (C1+–C5+; ∼20%) and for several fullerene ions smaller than C60+ (e.g., 696 m/z C58+), the latter consistent with the loss of C2. The negative ion mass spectrum of C60 (c) exhibited reduced fragmentation, which may be due to the lower energy inherent in the negative ion formation of C60− (Cox et al. Citation1991; Huang et al. Citation1995). Finally, recent work has shown that the relative ratios of low carbon ions (e.g., C1+/C3+) appear to be correlated with the presence of larger carbon cluster ions, potentially due to the fragmentation of larger clusters (Corbin et al. Citation2014). Corbin et al. (Citation2014) noted that rBC particulate materials with higher graphitic content exhibited lower C1+/C3+ ratios than less graphitic rBC material. These observations agree with the Cn+ positive ion distributions shown in . The comparison between diesel exhaust and lodgepole pine combustion shown in illustrates that diesel exhaust has a lower C1+/C3+ ratio and less mid and fullerene carbon ion signals than lodgepole pine combustion, suggesting diesel exhaust is a more graphitic rBC particulate material (Corbin et al. Citation2014) or a more mature soot (López-Yglesias et al. Citation2014). These combined observations suggest that fragmentation of larger Cn+ clusters, such as C60+, is likely to be a function of internal energy in vapor phase (Kroto et al. Citation1991; Foltin et al. Citation1993) and may affect the formation and relative ratios of low carbon ion signals.
All ambient and ambient-related rBC particle sources measured to date appear to exhibit SP-AMS-measured Cn+ ion distributions that are dominated (>60% of the total Cn+ ion signals) by ion signals in low carbon numbers (C1+–C5+), with source-specific differences in the low, mid, and high carbon ion signals being secondary features. We have not observed SP-AMS Cn+ ion distributions from ambient measurements that resemble the industry-generated fullerene-rich rBC samples included in this study. Based on our current observations, we recommend using low carbon number ions (C1+–C5+) for ambient rBC mass calibrations and quantitative rBC mass and size measurements for the following reasons: (1) ambient Cn+ ion measurements are dominated by low carbon ion signals, and (2) low carbon ion signals appear to be generated solely via electron ionization in the SP-AMS, unlike fullerene ions, and therefore appear to be most directly related to the vaporized components of rBC particulate material.
Mid Carbon C6+–C29+
The mid carbon category includes Cn+ ions in the mass spectral region from 72 to 348 m/z (C6+ to C29+), excluding multiple charged larger carbon cluster ions. Carbon clusters in this category have been reported to be typically the most stable ring structures (von Helden et al. Citation1993) and likely fragment via C3 expulsion (Geusic et al. Citation1987). The rBC materials during this study that exhibited significant mid carbon ion signals were generated by fuel-rich, incomplete combustion processes, suggesting that mid carbon ion signals may originate from incompletely graphitized rBC or not mature soot. The mid carbon ions were always associated with rBC materials that also exhibited fullerene ions, suggesting that mid carbon ions may form, at least in part, via fragmentation of fullerenes.
As previously noted, the mid carbon ion signals were sensitive to either source conditions for rBC particles or instrument parameters. This variability is illustrated by three Cn+ mass spectra for nominally the same Alfa Aesar fullerene soot (Product 40791, different lots) sampled by different SP-AMS instruments (not shown). In all spectra, low carbon and fullerene ions are present, but the mid carbon ion fractions varied from significant (0.2) to essentially zero (<0.01). The reasons for the observed variability for a specific rBC material are unclear as studies of Alfa Aesar fullerene soot using a single SP-AMS instrument and varying laser power, filament emission current, electron impact energies, laser beam spread, and mass spectrometer tuning voltages could not reproduce these observed changes in the Cn+ mass spectra. Thus, the mid carbon ion distributions appear to be affected by a currently unconstrained instrument or sampling-related variable, such as the extent of sampled rBC particle annealing in the laser beam discussed in the next section.
Fullerenes C30+/C602+ to C166+
As is evident in , fullerene ion signals vary widely for the rBC materials studied. An important issue here is the extent to which the fullerene ion signals represent the original fullerene content of the rBC material, or whether these signals are generated in the process of laser vaporization. This has implications on the distribution of smaller carbon ions as well, which may potentially form from fragmentation of larger carbon clusters. Several previous laser-assisted studies have reported the mass spectrometric detection of fullerene ions from rBC materials (Rohlfing et al. Citation1984; Spencer et al. Citation2008; Maricq Citation2009), and high laser power densities (>108 W/cm2) have been shown to produce fullerene ions as artifacts of the vaporization process (Buseck Citation2002). In contrast, low laser power densities (103–105 W/cm2) have been shown to be less prone to generate species not originally present and yield carbon cluster distributions similar to thermal desorption results, indicating the minimal influence of laser power density on the resulting carbon clusters, including fullerenes (Buseck et al. Citation1992; Wilson et al. Citation1993; Pflieger et al. Citation2008).
In our SP-AMS experiments, the laser power density was low (∼105 W/cm2), minimizing the potential for producing fullerene structures by the laser vaporization process (Greenwood et al. Citation1991). This is supported by the fact that the SP-AMS-measured fullerene ion signals where expected in the sampled rBC material (i.e., fullerene black/soot and C60) and none where fullerenes were not expected (e.g., graphitic and amorphous carbon) for both positive and negative ion detection. However, laser power dependence was observed for fullerene ion signals (b), indicating that the laser power density plays a substantial role in the fullerene ion production. Our studies suggest that increasing the laser power density may increase the measured fullerene ion signal due to an additional ionization mechanism (i.e., thermionic emission). In addition to this observation, HR-TEM studies in the literature highlight the potential for rapid annealing of rBC particles in laser-based systems such as SP-AMS (Ugarte Citation1994; Vander Wal and Choi Citation1999). We discuss both issues here.
The formation of positive fullerene ions with the filament off (i.e., ion formation via thermionic emission) indicates that there is more than one mechanism for generating fullerene positive ions. An additional ionization mechanism complicates the quantification and interpretation of fullerene content distribution within sampled particles. The additional ionization may be the reason for the large increase observed in total fullerene ion signals with increasing laser power. b shows that the mechanism responsible for increase in C60+ (and total fullerene ions) in Nano-C fullerene black at high laser power does not generate C602+ ions, consistent with the lack of C602+ ion formation with the filament off in . As C602+ appears to be generated via electron ionization only, the C602+ ion signal may be useful in separating the measured C60+ ion signal into fractions generated by the dominant ionization mechanisms: electron ionization and thermionic emission. The C602+ ion signal (and presumably the corresponding C60+ ion signal) appears to be laser power-independent (b), suggesting that C60 structures are not produced by the laser and that the carbon cluster ion signals generated by electron ionization may represent the pre-existing C60 content. Therefore, SP-AMS fullerene ion signals may reflect pre-existing fullerene content in the sampled rBC particulate material, although the amount and distribution are not yet quantitatively determined.
Another laser power density-dependent mechanism that may be playing a substantial role in governing the Cn+ mass spectra obtained with the SP-AMS may be the annealing of the sampled rBC particles at high temperatures in the laser vaporizer. While the SP-AMS laser is considered to have a relatively low laser power density, rBC particles transit time through laser of the order of microseconds and heat to incandescence (∼4000 K), and generate heating rates of the order of 1 e7 K/s. Heating rBC higher than 2000 K allows disordered rBC materials to anneal, meaning that the disordered carbon structures of the initial rBC undergo solid-state rearrangement to a more thermodynamically stable configuration. Previous HR-TEM studies have shown partial annealing occurring in rBC particles due to pulsed laser light (i.e., laser-induced incandescence techniques) at power densities ∼107 W/cm2, where the heating (cooling) rates were in excess of 1e11 K/s (1e9 K/s) and the total time at elevated temperature conditions is of the order of microseconds (Vander Wal and Jensen Citation1998; Vander Wal and Choi Citation1999). Therefore, some level of annealing may be expected to occur within rBC particles in the SP-AMS.
The chemical processes that govern the annealing of carbon materials at high temperatures (3000–4000 K) are not well understood, although some form crystalline graphite (i.e., graphitizing carbon) and others do not (i.e., non-graphitizing carbon) (Harris Citation2004, Citation2005). HR-TEM and Raman results indicate that some non-graphitizing carbons generate fullerene-like structures during heat treatment (Ugarte Citation1994; Burian and Dore Citation2000; Harris Citation2005). Thus, it is possible that the laser power dependence of the fullerene ion signals from the Nano-C fullerene black sample (b) may be due, in part, to heat-related annealing processes prior to vaporization. In this case, strong fullerene ion signals in the SP-AMS may result from rBC materials with pre-existing carbon structures that facilitate fullerene formation during heating. This potential mechanism is consistent with both our observations of fullerene ions only being generated from a subset of rBC materials, not including graphitic (e.g., mature soot) or amorphous carbon, and our observations of an additional ionization mechanism for generating positive fullerene ions. Furthermore, variations in the initial chemical composition of the rBC material and particle heating rates in the SP-AMS may influence the extent of annealing prior to complete vaporization and may explain the variations observed in the fullerene and mid carbon ions distributions.
CONCLUSIONS
The SP-AMS utilizes a new technique designed to detect and identify, in real-time, airborne rBC containing particles using a CW laser vaporizer. The instrument aims to measure the size, mass, and chemical composition of rBC particles, including both refractory and non-refractory materials. The present study focused on the origin and nature of refractory carbon cluster ions produced in the SP-AMS. The Cn+ mass spectra were measured for 12 types of rBC particles produced by industrial and combustion processes, including diesel truck particulate exhaust, and biomass combustion soot. The measured carbon cluster ion distributions varied as a function of rBC particle type and may serve as a fingerprint for the nature of the particles.
The Cn+ ion distributions were classified into three categories (low, mid, and fullerene carbons), based on the carbon ion cluster size and the measured mass spectra. The low carbon number (C1+–C5+) ion signals are consistent with a direct measure of small, neutral carbon clusters in the vapor phase, with potential contributions from ions generated by the fragmentation of larger carbon clusters. The mid carbon ions may be related to the fragmentation of fullerene-like structures but have not been consistently reproducible and warrant further study. The fullerene ions were likely produced by the electron ionization of pre-existing fullerenes or fullerene-like structures vaporized from the sampled rBC materials and modified by an additional, thermionic ionization mechanism under high laser power densities. The SP-AMS carbon ion distributions are likely governed, in part, by the annealing of the rBC particulate material at high temperatures in the laser vaporizer prior to complete vaporization, a process that is dependent upon the initial chemical composition of the rBC material and the rate of particle heating.
To date, the most observed ambient and ambient-related rBC particle sources exhibit SP-AMS measured carbon ion distributions that are dominated by ion signals in low carbon numbers (C1+–C5+) (Fortner et al. Citation2012; Massoli et al. Citation2012; Corbin et al. Citation2014; Dallmann et al. Citation2014), with the source-specific differences presented here being a secondary perturbation. Therefore, we recommend using low carbon number ions (C1+–C5+) for ambient rBC mass calibrations and quantitative rBC mass and size measurements. We expect our observations to provide a basis for the interpretation of future SP-AMS studies aiming to identify the source and atmospheric history of airborne ambient rBC particles.
ACKNOWLEDGMENTS
The authors acknowledge Jason Olfert and Rouzbeh Ghazi for help with the inverted diffusion flame source, and helpful discussions with Joakim Pagels and Axel Eriksson from Lund University.
Funding
This research was supported by DOE ASR grants DE-FG02-05ER63995, DE-SC0006980, and DE-SC0011935, DOE SBIR DE-FG02-07ER84890, NASA SBIR NNX-10CA32C, NSF Atmospheric Science Program grants 1244918 and 1244999, NSF Center for the Environmental Implications of Nanotechnology grant EF-0830093, an EPA STAR Graduate Fellowship to Andrea J. Tiwari, and EPA STAR grants R833747 and 83503301. Any opinions, findings, and conclusions or recommendations expressed in this material are those of the authors and do not reflect the views of the funding agencies.
REFERENCES
- Andreae, M. O., and Gelencsér, A. (2006). Black Carbon or Brown Carbon? The Nature of Light-Absorbing Carbonaceous Aerosols. Atmos. Chem. Phys., 6:3131–3148.
- Baughman, R. H., Zakhidov, A. A., and de Heer, W. A. (2002). Carbon Nanotubes—The Route Toward Applications. Science, 297:787–792.
- Baumgardner, D., Kok, G., and Raga, G. (2004). Warming of the Arctic Lower Stratosphere by Light Absorbing Particles. Geophys. Res. Lett., 31:L06117.
- Bloomfield, L., Geusic, M. E., Freeman, R. R., and Brown, W. (1985). Negative and Positive Cluster Ions of Carbon and Silicon. Chem. Phys. Lett., 121:33–37.
- Bond, T. C., and Bergstrom, R. W. (2006). Light Absorption by Carbonaceous Particles: An Investigative Review. Aerosol Sci. Technol., 40:27–67.
- Bond, T. C., Bhardwaj, E., Dong, R., Jogani, R., Jung, S., Roden, C., Streets, D. G., and Trautmann, N. M. (2007). Historical Emissions of Black and Organic Carbon Aerosol from Energy-Related Combustion, 1850–2000. Global Biogeochem. Cycles, 21:GB2018.
- Bond, T. C., Doherty, S. J., Fahey, D. W., Forster, P. M., Berntsen, T., DeAngelo, B. J., Flanner, M. G., Ghan, S., Kärcher, B., Koch, D., Kinne, S., Kondo, Y., Quinn, P. K., Sarofim, M. C., Schultz, M. G., Schulz, M., Venkataraman, C., Zhang, H., Zhang, S., Bellouin, N., Guttikunda, S. K., Hopke, P. K., Jacobson, M. Z., Kaiser, J. W., Klimont, Z., Lohmann, U., Schwarz, J. P., Shindell, D., Storelvmo, T., Warren, S. G., and Zender, C. S. (2013). Bounding the Role of Black Carbon in the Climate System: A Scientific Assessment. J. Geophys. Res. Atmos., 118:5380–5552.
- Bowers, M. T. (2014). Ion Mobility Spectrometry: A Personal View of its Development at UCSB. Int. J. Mass Spectrom., 370:75–95.
- Brugge, D., Durant, J. L., and Rioux, C. (2007). Near-Highway Pollutants in Motor Vehicle Exhaust: A Review of Epidemiologic Evidence of Cardiac and Pulmonary Health Risks. Environ. Health, 6:23.
- Burian, A., and Dore, J. C. (2000). Does Carbon Prefer Flat or Curved Surfaces? Acta Phys. Pol. A, 98:457–468.
- Buseck, P. R. (2002). Geological Fullerenes: Review and Analysis. Earth Planet. Sci. Lett., 203:781–792.
- Buseck, P. R., Tsipursky, S. J., and Hettich, R. (1992). Fullerenes from the Geological Environment. Science, 257:215–217.
- Chupka, W. A., and Inghram, M. G. (1953a). Investigation of the Heat of Vaporization of Carbon. J. Chem. Phys., 21:371.
- Chupka, W. A., and Inghram, M. G. (1953b). Molecular Species Evaporating from a Carbon Surface. J. Chem. Phys., 21:1313.
- Corbin, J. C., Sierau, B., Gysel, M., Laborde, M., Keller, A., Kim, J., Petzold, A., Onasch, T. B., Lohmann, U., and Mensah, A. A. (2014). Mass Spectrometry of Refractory Black Carbon Particles from Six Sources: Carbon-Cluster and Oxygenated Ions. Atmos. Chem. Phys., 14:2591–2603.
- Cox, D. M., Behal, S., Disko, M., Gorun, S. M., Greaney, M., Hsu, C. S., Kollin, E. B., Millar, J., and Robbins, J. (1991). Characterization of C60 and C70 Clusters. J. Am. Chem. Soc., 113:2940–2944.
- Cross, E. S., Onasch, T. B., Ahern, A., Wrobel, W., Slowik, J. G., Olfert, J., Lack, D. A., Massoli, P., Cappa, C. D., Schwarz, J. P., Spackman, J. R., Fahey, D. W., Sedlacek, A., Trimborn, A., Jayne, J. T., Freedman, A., Williams, L. R., Ng, N. L., Mazzoleni, C., Dubey, M., Brem, B., Kok, G., Subramanian, R., Freitag, S., Clarke, A., Thornhill, D., Marr, L. C., Kolb, C. E., Worsnop, D. R., and Davidovits, P. (2010). Soot Particle Studies – Instrument Inter-Comparison – Project Overview. Aerosol Sci. Technol., 44:592–611.
- Dallmann, T. R., DeMartini, S. J., Kirchstetter, T. W., Herndon, S. C., Onasch, T. B., Wood, E. C., and Harley, R. A. (2012). On-Road Measurement of Gas and Particle Phase Pollutant Emission Factors for Individual Heavy-Duty Diesel Trucks. Environ. Sci. Technol., 46:8511–8518.
- Dallmann, T. R., Onasch, T. B., Kirchstetter, T. W., Worton, D. R., Fortner, E. C., Herndon, S. C., Wood, E. C., Franklin, J. P., Worsnop, D. R., Goldstein, A. H., and Harley, R. A. (2014). Characterization of Particulate Matter Emissions from On-Road Gasoline and Diesel Vehicles Using a Soot Particle Aerosol Mass Spectrometer. Atmos. Chem. Phys., 14:7585–7599.
- DeCarlo, P. F., Kimmel, J. R., Trimborn, A., Northway, M. J., Jayne, J. T., Aiken, A. C., Gonin, M., Fuhrer, K., Horvath, T., Docherty, K. S., Worsnop, D. R., and Jimenez, J. L. (2006). Field-Deployable, High-Resolution, Time-of-Flight Aerosol Mass Spectrometer. Anal. Chem., 78:8281–8289.
- Ding, D., Huang, J., Compton, R., Klots, C., and Haufler, R. (1994). CW Laser Ionization of C60 and C70. Phys. Rev. Lett., 73:1084–1087.
- Dockery, D. W., Pope, C. A., Xu, X., Spengler, J. D., Ware, J. H., Fay, M. E., Ferris, B. G., and Speizer, F. E. (1993). An Association Between Air Pollution and Mortality in Six US Cities. N. Engl. J. Med., 329:1753–1759.
- Drowart, J., Burns, R. P., DeMaria, G., and Inghram, M. G. (1959). Mass Spectrometric Study of Carbon Vapor. J. Chem. Phys., 31:1131.
- Dzepina, K., Arey, J., Marr, L. C., Worsnop, D. R., Salcedo, D., Zhang, Q., Onasch, T. B., Molina, L. T., Molina, M. J., and Jimenez, J. L. (2007). Detection of Particle-Phase Polycyclic Aromatic Hydrocarbons in Mexico City Using an Aerosol Mass Spectrometer. Int. J. Mass Spectrom., 263:152–170.
- Elsila, J. E., de Leon, N. P., Plows, F. L., Buseck, P. R., and Zare, R. N. (2005). Extracts of Impact Breccia Samples from Sudbury, Gardnos, and Ries Impact Craters and the Effects of Aggregation on C60 Detection. Geochim. Cosmochim. Acta, 69:2891–2899.
- Ferge, T., Karg, E., Schröppel, A., Coffee, K. R., Tobias, H. J., Frank, M., Gard, E. E., and Zimmermann, R. (2006). Fast Determination of the Relative Elemental and Organic Carbon Content of Aerosol Samples by On-Line Single-Particle Aerosol Time-of-Flight Mass Spectrometry. Environ. Sci. Technol., 40:3327–3335.
- Foltin, M., Lezius, M., Scheier, P., and Märk, T. D. (1993). On the Unimolecular Fragmentation of C60 +Fullerene Ions: The Comparison of Measured and Calculated Breakdown Patterns. J. Chem. Phys., 98:9624.
- Fortner, E. C., Brooks, W. A., Onasch, T. B., Canagaratna, M. R., Massoli, P., Jayne, J. T., Franklin, J. P., Knighton, W. B., Wormhoudt, J., Worsnop, D. R., Kolb, C. E., and Herndon, S. C. (2012). Particulate Emissions Measured During the TCEQ Comprehensive Flare Emission Study. Ind. Eng. Chem. Res., 51:12586–12592.
- Fowler, P. W. (1986). How Unusual is C60? Magic Numbers for Carbon Clusters. Chem. Phys. Lett., 131:444–450.
- Gamaly, E. G., Rode, A. V., and Luther-Davies, B. (1999). Laser Ablation of Carbon at the Threshold of Plasma Formation. Appl. Phys. A, 69:S121–S127.
- Geusic, M. E., Jarrold, M. F., McIlrath, T. J., Freeman, R. R., and Brown, W. L. (1987). Photodissociation of Carbon Cluster Cations. J. Chem. Phys., 86:3862.
- Gilmore, I. S., and Seah, M. P. (2000). Ion Detection Efficiency in SIMS: Dependencies on Energy, Mass and Composition for Microchannel Plates Used in Mass Spectrometry. Int. J. Mass Spectrom., 202:217–229.
- Greenwood, P. F., Dance, I. G., Fisher, K. J., Willett, G. D., Pang, L. S. K., and Wilson, M. A. (1991). Laser Desorption Fourier Transform Ion Cyclotron Resonance (ICR) Mass Spectrometry of Synthetic C60 and C70 from Coalderived Coke and From Graphite. Org. Mass Spectrum., 26:920–922.
- Hadley, O. L., and Kirchstetter, T. W. (2012). Black-Carbon Reduction of Snow Albedo. Nat. Clim. Change, 2:437–440.
- Handschuh, H., Ganteför, G., Kessler, B., Bechthold, P., and Eberhardt, W. (1995). Stable Configurations of Carbon Clusters: Chains, Rings, and Fullerenes. Phys. Rev. Lett., 74:1095–1098.
- Harris, P. J. F. (2004). Fullerene-Related Structure of Commercial Glassy Carbons. Philos. Mag., 84:3159–3167.
- Harris, P. J. F. (2005). New Perspectives on the Structure of Graphitic Carbons. Crit. Rev. Solid State Mater. Sci., 30:235–253.
- Von Helden, G., Hsu, M. T., Gotts, N., and Bowers, M. T. (1993). Carbon Cluster Cations with up to 84 Atoms: Structures, Formation Mechanism, and Reactivity. J. Phys. Chem., 97:8182–8192.
- Huang, J., Carman, H. S., and Compton, R. N. (1995). Low-Energy Electron Attachment to C60. J. Phys. Chem., 99:1719–1726.
- Jacobson, M. Z. (2006). Effects of Externally-Through-Internally-Mixed Soot Inclusions within Clouds and Precipitation on Global Climate. J. Phys. Chem. A, 110:6860–73.
- Kimmel, J. R., Farmer, D. K., Cubison, M. J., Sueper, D., Tanner, C., Nemitz, E., Worsnop, D. R., Gonin, M., and Jimenez, J. L. (2011). Real-Time Aerosol Mass Spectrometry with Millisecond Resolution. Int. J. Mass Spectrom., 303:15–26.
- Krätschmer, W., Fostiropoulos, K., and Huffman, D. R. (1990). The Infrared and Ultraviolet Absorption Spectra of Laboratory-Produced Carbon Dust: Evidence for the Presence of the C60 Molecule. Chem. Phys. Lett., 170:167–170.
- Krätschmer, W., Lamb, L. D., Fostiropoulos, K., and Huffman, D. R. (1990). Solid C60: A New Form of Carbon. Nature, 347:354–358.
- Kroto, H. W., Allaf, A. W., and Balm, S. P. (1991). C60: Buckminsterfullerene. Chem. Rev., 91:1213–1235.
- Kroto, H. W., Heath, J. R., O’Brien, S. C., Curl, R. F., and Smalley, R. E. (1985). C60: Buckminsterfullerene. Nature, 318:162–163.
- Lack, D. A, Moosmüller, H., McMeeking, G. R., Chakrabarty, R. K., and Baumgardner, D. (2014). Characterizing Elemental, Equivalent Black, and Refractory Black Carbon Aerosol Particles: A Review of Techniques, their Limitations and Uncertainties. Anal. Bioanal. Chem., 406:99–122.
- Lee, J., Mahendra, S., and Alvarez, P. J. J. (2010). Nanomaterials in the Construction Industry: A Review of Their Applications and Environmental Health and Safety Considerations. ACS Nano., 4:3580–90.
- López-Yglesias, X., Schrader, P. E., and Michelsen, H. A. (2014). Soot Maturity and Absorption Cross Sections. J. Aerosol Sci., 75:43–64.
- Maricq, M. M. (2009). An Examination of Soot Composition in Premixed Hydrocarbon Flames via Laser Ablation Particle Mass Spectrometry. J. Aerosol Sci., 40:844–857.
- Massoli, P., Fortner, E. C., Canagaratna, M. R., Williams, L. R., Zhang, Q., Sun, Y., Schwab, J. J., Trimborn, A., Onasch, T. B., Demerjian, K. L., Kolb, C. E., Worsnop, D. R., and Jayne, J. T. (2012). Pollution Gradients and Chemical Characterization of Particulate Matter from Vehicular Traffic near Major Roadways: Results from the 2009 Queens College Air Quality Study in NYC. Aerosol Sci. Technol., 46:1201–1218.
- McMeeking, G. R., Kreidenweis, S. M., Baker, S., Carrico, C. M., Chow, J. C., Collett, J. L., Hao, W. M., Holden, A. S., Kirchstetter, T. W., Malm, W. C., Moosmüller, H., Sullivan, A. P., and Wold, C. E. (2009). Emissions of Trace Gases and Aerosols During the Open Combustion of Biomass in the Laboratory. J. Geophys. Res., 114:D19210.
- Moteki, N., and Kondo, Y. (2010). Dependence of Laser-Induced Incandescence on Physical Properties of Black Carbon Aerosols: Measurements and Theoretical Interpretation. Aerosol Sci. Technol., 44:663–675.
- O’Brien, S. C., Heath, J. R., Curl, R. F., and Smalley, R. E. (1988). Photophysics of Buckminsterfullerene and Other Carbon Cluster Ions. J. Chem. Phys., 88:220.
- Oberlin, A. (1984). Carbonization and Graphitization. Carbon N. Y., 22:521–541.
- Onasch, T. B., Trimborn, A., Fortner, E. C., Jayne, J. T., Kok, G. L., Williams, L. R., Davidovits, P., and Worsnop, D. R. (2012). Soot Particle Aerosol Mass Spectrometer: Development, Validation, and Initial Application. Aerosol Sci. Technol., 46:804–817.
- Petzold, A., Ogren, J. A., Fiebig, M., Laj, P., Li, S.-M., Baltensperger, U., Holzer-Popp, T., Kinne, S., Pappalardo, G., Sugimoto, N., Wehrli, C., Wiedensohler, A., and Zhang, X.-Y. (2013). Recommendations for Reporting “Black Carbon” Measurements. Atmos. Chem. Phys., 13:8365–8379.
- Pflieger, R., Sheindlin, M., and Colle, J.-Y. (2008). Advances in the Mass Spectrometric Study of the Laser Vaporization of Graphite. J. Appl. Phys., 104:054902.
- Ramanathan, V., and Carmichael, G. (2008). Global and Regional Climate Changes Due to Black Carbon. Nat. Geosci., 1:221–227.
- Rohlfing, E. A., Cox, D. M., and Kaldor, A. (1984). Production and Characterization of Supersonic Carbon Cluster Beams. J. Chem. Phys., 81:3322.
- Scheier, P., Dünser, B., Wörgötter, R., Lezius, M., Robl, R., and Märk, T. D. (1994). Appearance and Ionization Energies of Singly, Doubly and Triply Charged C60 and Its Fragment Ions Produced by Electron Impact Ionization. Int. J. Mass Spectrom. Ion Process., 138:77–93.
- Schmid, J., Grob, B., Niessner, R., and Ivleva, N. P. (2011). Multiwavelength Raman Microspectroscopy for Rapid Prediction of Soot Oxidation Reactivity. Anal. Chem., 83:1173–1179.
- Schwarz, J. P., Gao, R. S., Fahey, D. W., Thomson, D. S., Watts, L. A., Wilson, J. C., Reeves, J. M., Darbeheshti, M., Baumgardner, D. G., Kok, G. L., Chung, S. H., Schulz, M., Hendricks, J., Lauer, A., Kärcher, B., Slowik, J. G., Rosenlof, K. H., Thompson, T. L., Langford, A. O., Loewenstein, M., and Aikin, K. C. (2006). Single-Particle Measurements of Midlatitude Black Carbon and Light-Scattering Aerosols from the Boundary Layer to the Lower Stratosphere. J. Geophys. Res., 111:D16207.
- Schwarz, J. P., Spackman, J. R., Gao, R. S., Perring, A. E., Cross, E., Onasch, T. B., Ahern, A., Wrobel, W., Davidovits, P., Olfert, J., Dubey, M. K., Mazzoleni, C., and Fahey, D. W. (2010). The Detection Efficiency of the Single Particle Soot Photometer. Aerosol Sci. Technol., 44:612–628.
- Scida, K., Stege, P. W., Haby, G., Messina, G. A., and García, C. D. (2011). Recent Applications of Carbon-Based Nanomaterials in Analytical Chemistry: Critical Review. Anal. Chim. Acta, 691:6–17.
- Sinha, M. P. (1984). Laser-Induced Volatilization and Ionization of Microparticles. Rev. Sci. Instrum., 55:886.
- Spencer, M. K., Hammond, M. R., and Zare, R. N. (2008). Laser Mass Spectrometric Detection of Extraterrestrial Aromatic Molecules: Mini-Review and Examination of Pulsed Heating Effects. Proc. Natl. Acad. Sci. USA, 105:18096–18101.
- Stipe, C. B., Higgins, B. S., Lucas, D., Koshland, C. P., and Sawyer, R. F. (2005). Inverted Co-Flow Diffusion Flame for Producing Soot. Rev. Sci. Instrum., 76:023908.
- Tiwari, A. J., Fields, C. G., and Marr, L. C. (2013). A Cost-Effective Method of Aerosolizing Dry Powdered Nanoparticles. Aerosol Sci. Technol., 47:1267–1275.
- Ugarte, D. (1994). High-Temperature Behaviour of “Fullerene Black.” Carbon N. Y., 32:1245–1248.
- Vander Wal, R. L. (1997). A TEM Methodology for the Study of Soot Particle Structure. Combust. Sci. Technol., 126:333–351.
- Vander Wal, R. L., Bryg, V. M., and Hays, M. D. (2010). Fingerprinting Soot (Towards Source Identification): Physical Structure and Chemical Composition. J. Aerosol Sci., 41:108–117.
- Vander Wal, R. L., Bryg, V. M., and Huang, C.-H. (2014). Aircraft Engine Particulate Matter: Macro-, Micro-, and Nanostructure by HRTEM and Chemistry by XPS. Combust. Flame, 161:602–611.
- Vander Wal, R. L., and Choi, M. Y. (1999). Pulsed Laser Heating of Soot: Morphological Changes. Carbon N. Y., 37:231–239.
- Vander Wal, R. L., and Jensen, K. A. (1998). Laser-Induced Incandescence: Excitation Intensity. Appl. Opt., 37(6):1607–1616
- Vander Wal, R. L., and Tomasek, A. J. (2004). Soot Nanostructure: Dependence upon Synthesis Conditions. Combust. Flame, 136:129–140.
- Willis, M. D., Lee, A. K. Y., Onasch, T. B., Fortner, E. C., Williams, L. R., Lambe, A. T., Worsnop, D. R., and Abbatt, J. P. D. (2014). Collection Efficiency of the Soot-Particle Aerosol Mass Spectrometer (SP-AMS). for Internally Mixed Particulate Black Carbon. Atmos. Meas. Tech. Discuss., 7:5223–5249.
- Wilson, M. A., Pang, L. S. K., Quezada, R. A., Fisher, K. J., Dance, I. G., and Willett, G. D. (1993). Fullerene Production in Alternative Atmospheres. Carbon N. Y., 31:393–397.