
Abstract
By combination of a differential mobility analyzer (DMA) with a filter with uniform pores, namely a filter sensor, a new method for differentiating nanoparticles with various mass-mobility fractal dimensions, Dfm, was developed and validated experimentally and theoretically. The sensor is also able to measure the effective length (or maximum projected length) of nanoparticles with different shapes, which is an important parameter responsible for the lung deposition due to interception. At the same mobility diameter, it was observed that the compact NaCl had the highest penetration followed by partially sintered silver (Ag) aggregates and then the loose Ag and soot agglomerates. The result indicates that the stronger interception by the filter is correlated to the more elongated shape of the particles. A modified capillary tube model for predicting the penetration of Ag nanoparticles with different mass-mobility fractal dimensions was validated by experimental data. By using the validated model, this study found that the sensor could have a further enhanced sensitivity if the porosity and thickness of the filter were adjusted to 0.01 and 5 µm, respectively. The penetration differences obtained from the model are as high as 7–18%, 14–35%, and 24–40% between spheres and loose agglomerates (Dfm = 2.1) for 50–100, 100–300, and 300–1000 nm particles as the filter pore sizes are 0.4, 1, and 3 µm, respectively. This new filter sensor can measure the effective length and mass-mobility fractal dimension in nearly real-time and may be applied in nanotoxicity studies and quality control of nanomaterial productions (e.g., by flame reactors).
Copyright 2015 American Association for Aerosol Research
INTRODUCTION
Surface area and effective length (maximum projected length) of engineered non-spherical nanoparticles are functions of their morphologies and are crucial parameters responsible for their toxicity (Poland et al. Citation2008; Shvedova et al. Citation2008; Chen et al. Citation2013a). The National Institute for Occupational Safety and Health (NIOSH), USA, suggested that efforts should be made to reduce the exposure to engineered nanoparticles until more in vivo data can fully explain the effects of their shape, size, length, surface chemistry, functionalization, etc., on toxicity (NIOSH Citation2009, Citation2013). Many real-time aerosol instruments have been developed to help assess the exposure risk of workers working with engineered nanomaterials. For example, the scanning mobility particle sizer (SMPS, Model 3936; TSI Inc., Shoreview, MN, USA) measures the size distribution of nanoparticles and the nanoparticle surface area monitor (NSAM, Model 3550; TSI Inc., Shoreview, MN, USA) measures the human lung-deposited surface area of particles. To date, very few online instruments or methods are designed for measuring particle length, which is an important parameter responsible for the respiratory deposition due to interception, e.g., the Real-Time Fiber Monitor (M7400AD; MSP Corp., Shoreview, MN, USA), the pulse-field voltage differential mobility analyzer, DMA (Li et al. Citation2014), interception equivalent diameter of spark discharge carbon agglomerates by filtration (Lange et al. Citation2000), and our previous work on carbon nanotube (CNT) length also by filtration (Bahk et al. Citation2013). In addition to the particle surface area and length, mass-mobility fractal dimension of non-spherical particles are also of high interest in nanomaterial manufacturing industries (e.g., carbon black, titania, silica, and alumina by flame reactors). The mass-mobility fractal dimension, Dfm, and the derivative dynamic shape factor and effective density of the engineered nanomaterial could be important parameters for quality control of their productions (Scheckman et al. Citation2009).
It is acknowledged that the mass-mobility fractal dimension cannot fully represent the traditional geometric size-based fractal dimension. But the former is often and widely present in the aerosol literature as a reference fractal dimension in recent years because of its significant correlation with particle mobility diameter, dynamic shape factor, as well as effective density (Park et al. Citation2004; Kim et al. Citation2009a; Scheckman et al. Citation2009; Eggersdorfer et al. Citation2012). Sorensen (Citation2011) found that the mass-mobility fractal dimension for a linear chain was 1.78–1.92 instead of 1.0 that determined with the traditional fractal dimension. Therefore, one should not ascribe the particles to diffusion limited cluster-cluster agglomerates (DLCAs) when obtaining a mass-mobility fractal dimension of 1.78–1.92. Recently, we have also observed the differences between the two fractal dimensions from characterizing the silver DLCAs produced by an electric tube furnace. The mass-mobility and traditional fractal dimensions were found to be 2.1 and 1.74–1.84, respectively (Kim et al. Citation2009a; Shin et al. Citation2009). The latter value is often measured for DLCAs in a wealth of studies (Sorensen Citation2011). In the present study, we use the mass-mobility fractal dimension throughout as an index for the fractal particle morphology.
For separating non-spherical particles and spheres, Li et al. (Citation2012, Citation2013, Citation2014) found that the electrical mobility of non-spherical particles was dependent on the particle orientation in the DMA. However, the method only identified non-spherical particles with aspect ratios at least 10, such as nanorods. It may not be applicable for agglomerates, which have aspect ratios of only about 2–10 (Chen et al. Citation2013b, Citation2014). The DMA-aerosol particle mass analyzer (DMA-APM) method has been extensively applied to characterize the physical properties such as mass-mobility fractal dimension, effective density, and dynamic shape factor for engineered nano-aggregates and nano-agglomerates or soot agglomerates (Kelly and McMurry Citation1992; Park et al. Citation2004; Kim et al. Citation2009a,Citationb; Scheckman et al. Citation2009). However, the cost of the system is relatively high and the length is not directly measured. It is meaningful to develop other alternative and cheaper methods that can provide various parameters of non-spherical particles.
Filtration techniques are widely used to mitigate indoor particulate matter (PM) pollution such as high-efficiency particulate air (HEPA) filters applied in cleanrooms and heating ventilating and air conditioning (HVAC) filters in buildings and residences. Filtration is also used to control the outdoor on-road and off-road engine emissions (Kladopoulou et al. Citation2003; Mathur and Chavan Citation2008; Pui et al. Citation2014). The particle removal efficiency is a function of particle properties (e.g., particle size, density, shape, etc.) and filtration conditions (e.g., filter types and properties and face velocities). As generally known, relatively large particles are mainly removed by impaction as their inertia does not allow them to follow the streamline but gets them impacted onto the collection objects. Interception contributes significantly to removal of the slightly smaller particles without sufficient inertia as they follow the streamline with a distance to the objects smaller than their radius. Tiny particles are mainly collected by diffusion as they overcome the flow and diffuse to the objects by Brownian motion provided there are no electrical effects. Before conducting filtration tests, models are usually available and adopted to predict the performance of the filters. For example, the single fiber theory is for fibrous filter media and capillary tube models are for Nuclepore filters (Wang et al. Citation2011; Chen et al. Citation2013a,b).
Lange et al. (Citation2000) were the first to use a filtration method to differentiate carbon agglomerates and spherical wax particles. Our previous study also found that with the same mobility diameter, spherical polystyrene latex particles (PSLs) had a significantly higher penetration than that of CNTs in the screen filter (Model 3040; TSI Inc., Shoreview, MN, USA) due to the elongated shape of the CNTs that enhanced their interception deposition. The effective length of the CNTs was much larger than their mobility diameter (Wang et al. Citation2011). However, the screen filter was not able to differentiate nanosized agglomerates from spheres with the same mobility very well due to its large pore size of 20 μm (Lange et al. Citation2000). In comparison, Nuclepore filters have much smaller pore sizes with 0.01–10 μm; meanwhile, their qualities in terms of pore size uniformity, thickness, and porosity regularity are usually satisfactory. By scanning electron microscopy (SEM) analysis, shows that the 1 μm pore diameter Nuclepore filters used in this study had a uniform pore size. The regularity of the thickness and porosity were checked by measuring the pressure drop across the filter at a fixed flow rate. It can be seen that the 350 nm mobility diameter Ag agglomerates (with the maximum length of ∼1000 nm) were intercepted at the pore opening. From the capillary tube model, it was calculated that the 350 nm Ag agglomerates had a deposition efficiency of 99.9% while that of 350 nm Ag spheres was 80% (Chen et al. Citation2013b). The significant penetration difference of ∼20% inspires us to investigate whether the difference of interception deposition is sufficient to differentiate the particles with the same mobility diameter but different morphologies using Nuclepore filters.
FIG. 1. SEM image of the 1 μm pore diameter Nuclepore filter with 350 nm mobility diameter Ag agglomerates deposited.
In order to predict the penetrations of differently shaped nanoparticles including sphere-like particles, partially sintered aggregates, and loose agglomerates through Nuclepore filters, a modified capillary tube model was developed and validated by experimental data (Chen et al. Citation2013a,b). Good agreement between the data and model for both aggregates and agglomerates was obtained upon applying their effective lengths as the interception lengths and taking the dynamic shape factors into account in the impaction deposition (Kim et al. Citation2009a). The interception mechanism dominated the particle deposition and the impaction was minor when the face velocity was low (≤5 cm s−1) and the particle diameter was from tens of nanometers to hundreds of nanometers.
This study aims to combine a DMA and a Nuclepore filter as a filter sensor to differentiate particles with different morphologies. Models for predicting particle penetration was first validated by comparison with the experimental data and then used to determine the mass-mobility fractal dimension and effective length. In the experiments, differently shaped particles including sphere-like NaCl, Ag spheres, aggregates, and agglomerates and soot agglomerates were generated and classified by the DMA to form monosized particles, which were then neutralized and used to challenge the 1 and 3 μm pore diameter Nuclepore filters. The penetration curves for differently shaped particles were compared to identify the differences and to validate the model. The final goal is to prove the concept that the newly developed sensor is able to measure the effective length of nanoparticles and estimate the mass-mobility fractal dimension by correlating the DMA-APM measurements and penetration data from the sensor.
EXPERIMENTAL METHOD
The filter sensor operation consisted of the following steps: the DMA (Model 3081; TSI Inc., Shoreview, MN, USA) first classified particles to be monodisperse and then the Nuclepore filter was challenged with the monodisperse particles for their penetrations. The Nuclepore filters with 1 or 3 μm pore diameter and a 47 mm outer diameter were purchased from Whatman (WHA-111112 and WHA-111110; GE Healthcare Biosciences, Pittsburgh, PA, USA). The 1 and 3 μm pore filters have porosities of 0.16 and 0.14 and thicknesses of 11 and 9 μm, respectively. Since the Nuclepore filters were challenged with several differently shaped nanoparticles, three different experimental systems as shown in Figures 1 and 2 of Chen et al. (Citation2013a) and Figure 2 of Chen et al. (Citation2013b) were used. Briefly, the evaporation and condensation methods were applied to produce sphere-like, aggregate and agglomerate Ag nanoparticles. By varying the temperature of the sintering furnace (second furnace) from room temperature (25°C) to 150, 200, 250, 300, and 600°C, different shapes from loose agglomerate, partially sintered aggregates, to more compact sphere-like Ag particles can be obtained. The SEM images for the morphological change of Ag particles sintered at different temperatures can be found in Figure 2 of Kim et al. (Citation2009a). Before the particles were sent into the Nuclepore filter, they were neutralized by the Po-210 to minimize the effect of electrostatic depositions. The penetration was determined by taking the ratio of the particle concentration downstream of the filter to that of upstream measured by the condensation particle counter (CPC, Model 3776; TSI Inc., Shoreview, MN, USA).
The atomization method was used to produce sphere-like NaCl nanoparticles. The combustion method using a diffusion burner was employed to produce soot agglomerate nanoparticles. The method of particle penetration determination for NaCl and soot nanoparticles was the same as that for Ag particles and is not described again. For more information on the particle generation and penetration tests, please refer to elsewhere (Chen et al. Citation2013a,Citationb).
THEORETICAL METHOD
The capillary tube models developed by Spurny et al. (Citation1969) and Manton (Citation1978, Citation1979) for spherical particle penetration through Nuclepore filters have been modified for applications to soot and Ag agglomerates in our previous works (Chen et al. Citation2013a,Citationb). In the modified models, the considered mechanisms of particle depositions included the diffusions on filter surface and inside the pore, interception at the pore opening, and impaction on the filter surface. We found the inertia parameter, I, needed to be considered for selecting a suitable model. I was a function of the particle density, medium density, Reynolds number of the flow approaching a pore, filter porosity, face velocity, pore radius, and kinematic viscosity. The calculation can be found elsewhere (Chen et al. Citation2013a). The modified Spurny model was applicable when I was less than 1.0. In comparison, the Manton model was better when the I value was larger than 1. However, the Manton model combined the impaction and interception depositions together with an empirical equation and did not allow one to extract the interception deposition for differentiating particle shapes. On the contrary, individual equations were used for each deposition mechanism in the modified Spurny model. Therefore, the interception length could be predicted by the Spurny model when the surface and pore diffusion and impaction terms were assumed to be known. The interception length was then readily calculated when the experimental penetration was applied in the model.
We found by model calculation that the major differences between spherical and agglomerate particles in the size range of 50–500 nm in 1 μm pore diameter Nuclepore filters were on the interception and impaction, especially on interception, whereas the diffusion deposition did not differ significantly. In the interception modeling, the effective length should be used as the interception length instead of the mobility diameter to account for the elongated shape of aggregates and agglomerates. Kim et al. (Citation2009a) measured the maximum projected length for Ag agglomerates (formed at room temperature or 25°C) and aggregates (sintered at 200°C) by transmission electron microscopy (TEM) and provided a power law expression to relate the length and mobility diameter for the two types of particles. The expression is adopted in the modified capillary tube model (named Spurny-Kim model) for comparison with experimental data. It is noted that the use of the effective length as the interception length is valid when there is no alignment effect or under a relatively low face velocity such as ≦7.5 cm s−1 (Chen et al. Citation2013b, Citation2014). When the alignment effect occurs, elongated particles are oriented with a much smaller projected diameter to approach the filter surface, which substantially increases their penetrations. It was found the Ag agglomerates had close penetration values to the sphere-like Ag at 10 and 15 cm s−1 face velocities as shown in Figure 6 of Chen et al. (Citation2013b) due to the alignment effect.
RESULTS AND DISCUSSION
Penetration Difference Between Morphologically Different Nanoparticles
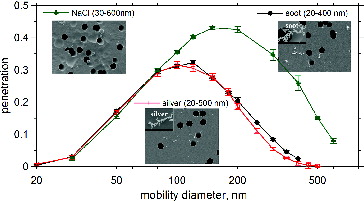
To illustrate the importance of the elongated shape of particles on interception deposition, penetrations among differently shaped nanoparticles through the 1 μm Nuclepore filter with 5 cm s−1 face velocity are compared in . These particles include sphere-like NaCl, soot agglomerates, and Ag loose agglomerates. The SEM images in show that the NaCl particles were close to spheres, and the two agglomerates had a very similar shape. Inspecting the SEM images and penetration curves in , one can see that the more the particles were elongated, the lower the penetration was. In the range below 80 nm mobility diameter, the three particles had close penetrations with differences less than 0.05. This was due to the diffusion mechanism dominating the deposition and the shape effect could be neglected. In the range above 100 nm, the NaCl particles clearly had a higher penetration than other elongated particles. The two agglomerates had an almost identical penetration in the whole size range, which was attributed to the similar morphology of the two types of particles as evidenced by the very close mass-mobility fractal dimensions of them. The DMA-APM measurement showed that the mass-mobility fractal dimensions of the Ag and soot agglomerates were 2.1 and 1.9, respectively (Kim et al. Citation2009a,Citationb). Therefore, they could have a close effective length at the same mobility diameter. However, there were slightly lower penetrations for Ag particles than soot particles for particles larger than 200 nm, which was due to the higher effective density (therefore the higher impaction deposition) of Ag particles. In conclusion, the shape, in terms of the effective length of elongated particles, was a very important property responsible for their enhanced interception deposition in the 1 μm Nuclepore. For a larger pore size Nuclepore filter, the elongated effect of these particles in the same size range considered here on enhancing the interception deposition may not be as significant due to the higher ratio of the pore diameter to the particle effective length.
FIG. 2. Comparison of Nuclepore filter penetrations among NaCl, soot agglomerates, and silver agglomerates at 5 cm s−1 face velocity. The zoom-in images of soot and silver agglomerates are also shown.
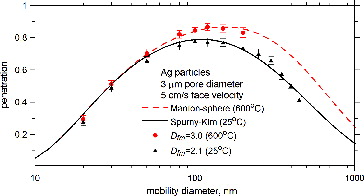
It is interesting to challenge the filter sensor with particles of the same material but different shapes to evaluate its sensitivity (or to test whether these particles could have distinguishable penetration differences in the sensor). shows the penetration of Ag nanoparticles with different mass-mobility fractal dimensions from 2.1 to 3.0 (Kim et al. Citation2009a) through the 1 μm pore diameter Nuclepore filter at 5 cm s−1 face velocity. As can be seen, each mass-mobility fractal dimension Ag particles have an independent penetration curve with statistically significant differences from 80 to 400 nm. This indicates the sensor was able to differentiate among the particles with five different mass-mobility fractal dimensions from Dfm = 2.1 (loose agglomerates) to 3.0 (sphere-like). From the penetration curves, it can be seen these particles with different mass-mobility fractal dimensions can be differentiated even at quite small sizes of 50–80 nm mobility diameter. The experimental penetration differences between 3.0 and 2.1 Dfm Ag particles for 50 and 80 nm were 0.03 and 0.1, respectively. Besides, the differences between sphere-like and loose agglomerate Ag particles were as much as 0.18, 0.18, and 0.19 for 100, 150, and 200 nm mobility diameters, respectively.
FIG. 3. Penetration of Ag particles with different mass-mobility fractal dimensions. Manton model and Spurny-Kim model were in good agreement with data of Dfm = 3.0 and Dfm = 2.1, respectively. Penetrations for Ag particles with Dfm = 2.1, 2.2, 2.6, 2.9, and 3.0 are distinguishable.
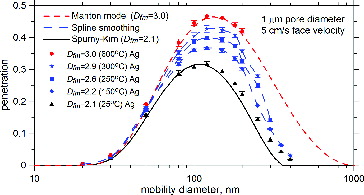
also compares the experimental penetrations of 3.0 Dfm sphere-like Ag particles and 2.07 Dfm loose agglomerates with those predicted by the Manton and Spurny-Kim models, respectively, and good agreement is achieved. The Spurny-Kim model was used for predicting the penetration of 2.1 Dfm Ag open agglomerates because the inertia parameter, I, was below 1. On the contrary, Spurny-Kim model was not suitable for the Ag particles with Dfm larger than 2.1 because the particle effective density increased with increasing Dfm, which resulted in a higher value of I. A more detailed discussion on the change of particle effective density of fractal Ag and soot particles can be found elsewhere (Chen et al. Citation2013b). For the sphere-like Ag, Dfm = 3, the Manton model predicted its penetration very well as expected (I larger than 1). Since the models predicted penetrations for both spheres and agglomerates well, they were used to estimate the penetration difference between Ag particles with Dfm = 3.0 and Dfm = 2.1. The penetration differences were found to be 0.24, 0.23, 0.21, 0.17, and 0.10 for 250, 300, 350, 400, and 500 nm, respectively. To be noted, in order to prevent the effect of alignment for the elongated aggregates and agglomerates, the face velocity has to be kept below ∼7.5 cm s−1 (Chen et al. Citation2013b). Once the effect occurs, the penetration of agglomerate is increased and the model cannot predict their penetrations accurately.
In , we have shown loose Ag agglomerates and soot agglomerates had similar penetration values. It was attributed to the two particles having similar mass-mobility fractal dimensions and effective lengths at the same mobility diameter. Based on the finding, it is expected that the sensor can be applied not only for differentiating furnace-produced Ag particles with different mass-mobility fractal dimensions but also for flame-reactor-produced particles. In the future, it is very meaningful to evaluate the performance of the sensor using lower mass-mobility fractal dimension particles such as gold nanorods to extend the applicability of the sensor.
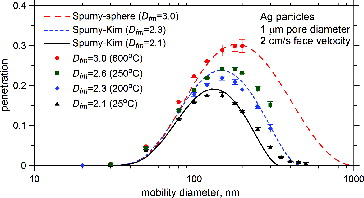
Since the Manton model does not provide the separated interception efficiency, we reduced the face velocity from 5 to 2 cm s−1 (I reduced from 1.35 to 0.54 for Ag spheres) so that the Spurny model was valid for predicting the penetrations of both Ag loose agglomerates and spheres. shows the penetration differences among Ag particles with different mass-mobility fractal dimensions of 2.1, 2.3, 2.6, and 3.0 and compares the data with the predictions by the model. In the model, the effective lengths of 2.1 and 2.3 Dfm Ag agglomerates and aggregates obtained by Kim et al. (Citation2009a) were used as the interception lengths. The model for Dfm = 2.6 was not available because the correlation between the mobility diameter and effective length was not reported by Kim et al. (Citation2009a). It can be seen that the data are in good agreement with the model, indicating the mass-mobility fractal dimension for non-spherical particles can be correlated accurately by Spurny-Kim model and the measured penetration. The penetrations are lower for all particles at 2 cm s−1 face velocity than those at 5 cm s−1 due to the enhanced diffusion depositions. Although the overall penetrations were reduced, the penetration differences between 2.1 and 3.0 Dfm Ag particles were still significant. They were 0.17, 0.21, 0.22, 0.16, and 0.10 for 200, 250, 300, 400, and 500 nm Ag particles, respectively.
FIG. 4. Comparison of experimental and theoretical penetrations at a lower face velocity of 2 cm s−1 for Ag particles with four different mass-mobility fractal dimensions. The model predicted the penetrations of three Ag particles with Dfm = 2.1, 2.3, and 3.0 very well.
According to the results shown in and , there exist significant penetration differences among particles with different mass-mobility fractal dimensions between 2.1 and 3.0. Our experimental data showed that the error bar that represented 95% confidence interval for each penetration datum point was as small as ±2% when quality control was used for the Nuclepore filters. The quality control for the 1 μm Nuclepore filter was based on the pressure drop of the clean filters, which was 8.0–10.0 cm H2O when passing filtered air with 5 cm s−1 face velocity. Therefore, based on the results observed in and , the 1 μm Nuclepore filter is able to differentiate Ag particles with 2.1, 2.2, 2.3, 2.6, 2.9, and 3.0 Dfm.
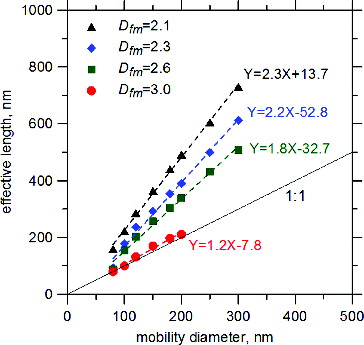
The major goals of this study are to obtain the particle effective length and mass-mobility fractal dimension for non-spherical particles by using the sensor. Based on the data shown in , the effective length was computed by introducing the experimental penetration to the modified Spurny model and assuming the interception length (or effective length) was the only unknown, and then plotted as a function of the mobility diameter in . At the low face velocity of 2 cm s−1, the particle deposition was dominated by diffusion in the range below 50 nm and the sensor was insensitive to the effective length. Therefore, the diameter and length were correlated from 80 nm. It is seen there is a very good linear relationship between the two magnitudes with R-squared values larger than 0.990. Comparing with the power law correlations for Ag particles with Dfm = 2.1 and 2.3 obtained by the TEM method in Kim et al. (Citation2009a), the sensor predicted the effective lengths within 15 and 25% relative differences, respectively, of those from Kim et al. (Citation2009a). For the sphere-like Ag, the model showed a nearly 1:1 relationship between the length and mobility diameter. However, the length was about 10% larger than the mobility diameter when it was over 100 nm.
FIG. 5. Relationship between the mobility diameter and effective length for Ag particles with different mass-mobility fractal dimensions.
Based on the above results, it is concluded that the sensor not only is able to correlate the mass-mobility fractal dimension very well but also provides an accurate effective length for fractal Ag particles and soot agglomerates according to the measured penetration. In addition, it is expected to take only 1–2 min to obtain the penetration data and then convert it to the effective length and mass-mobility fractal dimension by a simple software, which is much faster than the TEM method (Kim et al. Citation2009a).
For a straightforward application of the sensor results shown in , and correlate the particle penetration with the mass-mobility fractal dimension and effective length of the fractal Ag particles, respectively. The results shown in may be applicable for both flame- and furnace-produced engineered nanoparticles since the sensor was validated by comparing experimental data with the model for particles generated by the two methods. From , one could estimate the mass-mobility fractal dimension of the tested particles according to the measured penetration and using interpolation method when the 1 μm Nuclepore filter and 2 cm s−1 face velocity are adopted. For example, for a 150 nm mobility diameter particle, its mass-mobility fractal dimension is between 2.6 and 3.0 when the penetration is 0.26.
FIG. 6. Mass-mobility fractal dimension as a function of penetration of fractal Ag particles with mobility diameters of 30–150 nm (left) and 180–400 nm (right).
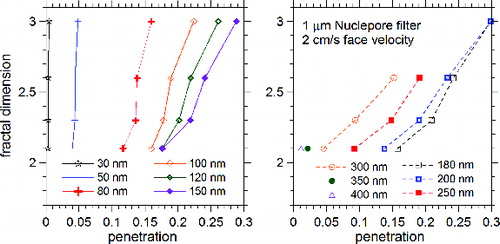
FIG. 7. Effective length as a function of the penetration of fractal Ag particles.
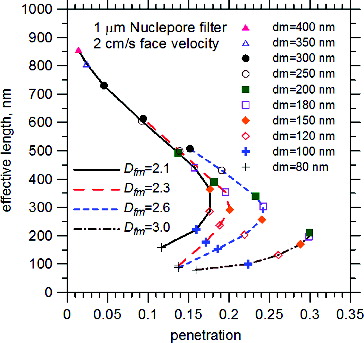
is used for predicting the effective length of the tested particles once the penetration is available. For example, for a 100 nm particle, its effective length is between 100 and 150 nm if the penetration is 0.2. In addition to the effective length, the mass-mobility fractal dimension of tested particles can also be estimated by interpolation method from . For example, for a 100 nm mobility diameter particle, its mass-mobility fractal dimension is between 2.6 and 3.0 if the penetration is 0.2.
Nuclepore filters with a larger pore diameter were used to examine the pore size effect on differentiating particle morphologies. shows the comparison of experimental and theoretical penetrations for the Ag particles with 2.1 and 3.0 Dfm through 3 μm Nuclepore filters. It is seen the models are in good agreement with data and the penetrations of the two particles are distinguishable in the mobility size range above 80 nm. From the models, it was found the differences were improved for particles larger than 300 nm compared with that obtained using 1 μm Nuclepore filters. The differences between the two types of particles were 0.18, 0.19, 0.18, 0.17, and 0.14 for 300, 400, 500, 600, and 800 nm, respectively.
FIG. 8. Comparison of experimental and theoretical penetrations for Ag particles with 2.1 and 3.0 Dfm through 3 μm pore diameter Nuclepore filters at 5 cm s−1 face velocity.
Optimization of the Filter Sensor Using the Validated Model
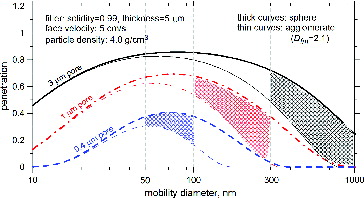
Since the modified capillary tube model predicted the experimental data very well, it is possible to perform a parametric study for the sensor by adjusting the filtration conditions (e.g., face velocity and particle density) and filter properties (e.g., pore diameter, solidity, and thickness) to investigate whether the sensitivity in terms of penetration difference for different fractal particles can be further enhanced. shows that the sphere-like particles and loose agglomerates in the range >50 nm with a material density of 4 g cm−3 could be differentiated easily in the Nuclepore filters with different pore diameters at 5 cm s−1 face velocity when the filters have a solidity of 0.99 and thickness of 5 μm. Although there are no such Nuclepore filters commercially available but they are manufacturable by current etching techniques to our best knowledge. The use of particle density of 4 g cm−3 is because some engineered nanoparticles such as TiO2 and ZnO have densities about 4–5 g cm−3. By using 0.4, 1, and 3 μm pore filters, the two types of particles can be distinguished readily in the mobility diameter ranges of 50–100, 100–300, and 300–1000 nm, respectively, as indicated with the hatching patterns in . It is recommendable to differentiate the smaller mobility diameter particles with smaller pore diameter Nuclepore filters. Since the penetration differences between the spheres and loose agglomerates are as high as 0.07∼0.18, 0.14∼0.35, and 0.24∼0.40 for the three hatching areas representing 50–100, 100–300, and 300–1000 nm size ranges, it is expected that fractal particles with Dfm of 1.9 (soot agglomerates) to 3.0 (sphere-like particles) produced by flame reactor and furnace should be distinguishable because the error bars in all experiments were as small as ±0.01, ±0.025, and ± 0.04 for the three ranges shown in , , and .
FIG. 9. Suggested operational conditions for particles with mobility diameters of 50–100, 100–300, and 300–1000 nm by different pore diameter Nuclepore filters.
CONCLUSION
In the airborne particle filtration, the depositions are mainly by inertia impaction, diffusion, and interception deposition if there is no electrostatic effect. These mechanisms depend on filtration conditions (filter types and face velocity, etc.) and particle properties (particle size, density, shape, etc.). By the use of filtration technique, a new filter sensor for differentiating particles with different morphologies was developed. In the sensor, the DMA first classified particles to be monodisperse and then the monosized particles were passed through the Nuclepore filter. A CPC was used to measure the particle penetration, which was the ratio of the particle concentration downstream of the filter to that of upstream. The experimental data showed that the more elongated the particle shape was, the lower the penetration was obtained due to the enhanced interception. The data were in good agreement with the modified capillary tube model taking into account the effective length for agglomerates and aggregates. By using the validated models, this study found the sensor could have a better sensitivity when the pore diameter, solidity, and thickness of the Nuclepore filter were adjusted. As the solidity is 0.99 and thickness is 5 μm, the sensor equipped with 0.4, 1, and 3 μm pore diameter Nuclepore filters could differentiate particle morphology readily for 50–100, 100–300, and 300–1000 mobility diameter particles, respectively.
The dependence of penetration upon mass-mobility fractal dimension for different fractal particles in the sensor allows one to differentiate and measure their mass-mobility fractal dimension and effective length in few minutes. The curves shown in and could be regarded as the calibration curves for mass-mobility fractal dimension and effective length determination of furnace- and flame-produced fractal particles, which were validated with experimental penetration, theoretical models, and empirical relations between mobility diameter and effective length. The measurements should be valid for calibrated systems but applicability for other particles may need to be verified separately. The development of the sensor provides a cost-effective and fast method for particle measurement in toxicity studies, emission control, as well as nanopowder manufacturing quality control, etc.
ACKNOWLEDGMENTS
The authors thank the support of members of the Center for Filtration Research: 3M Corporation; BASF Corporation; Boeing Commercial Airplanes; Cummins Filtration Inc.; Donaldson Company, Inc.; Entegris, Inc.; H.B. Fuller Company; Ford Motor Company; MANN+HUMMEL GMBH; MSP Corporation; Samsung Electronics Co., Ltd; Shengda Filtration Tech. Co., Ltd; Shigematsu Works Co., Ltd; TSI Inc.; and W. L. Gore & Associates, Inc.; and the affiliate member National Institute for Occupational Safety and Health (NIOSH). Parts of this work were carried out in the Characterization Facility, University of Minnesota, a member of the NSF-funded Materials Research Facilities Network (www.mrfn.org) via the MRSEC program.
FUNDING
This work was supported by the NSF Grant (Award ID: 1236107) on “GOALIE: Unipolar Diffusion Charging of Spherical and Agglomerated Nanoparticles and its Application toward Surface-Area Measurement.”
REFERENCE
- Bahk, Y. K., Buha, J., and Wang, J. (2013). Determination of Geometrical Length of Airborne Carbon Nanotubes by Electron Microscopy, Model Calculation and Filtration Method. Aerosol Sci. Technol., 47:776–784.
- Chen, S. C., Wang, J., Bahk, Y. K., Fissan, H., and Pui, Y. H. D. (2014). Carbon Nanotube Penetration through Fiberglass and Electret Respirator Filter and Nuclepore Filter Media: Experiments and Models. Aerosol Sci. Technol., 48:997–1008.
- Chen, S. C., Wang, J., Fissan, H., and Pui, Y. H. D. (2013a). The Use of Nuclepore Filters for Ambient and Workplace Nanoparticle Exposure Assessment—Spherical Particles. Atmos. Environ., 77:385–393.
- Chen, S. C., Wang, J., Fissan, H., and Pui, Y. H. D. (2013b). Exposure Assessment of Nanosized Engineered Agglomerates and Aggregates Using Nuclepore Filter. J. Nanopart. Res., 15:1955–1969.
- Eggersdorfer, M. L., Kadau, D., Herrmann, H. J., and Pratsinis, S. E. (2012). Aggregate Morphology Evolution by Sintering: Number and Diameter of Primary Particles. J. Aerosol Sci., 46:7–19.
- Kelly, W. P., and McMurry, P. H. (1992). Measurement of Particle Density by Inertial Classification of Differential Mobility Analyzer-Generated Monodisperse. Aerosol Sci. Technol., 17:199–212.
- Kim, S. C., Wang, J., Emery, M., Shin, W. G., Mulholland, G., and Pui, D. Y. H. (2009a). Structural Property Effect of Nanoparticle Agglomerates on Particle Penetration through Fibrous Filter. Aerosol Sci. Technol., 43:344–355.
- Kim, S. C., Wang, J., Shin, W. G., Scheckman, J. H., and Pui, D. Y. H. (2009b). Structural Properties and Filter Loading Characteristics of Soot Agglomerates. Aerosol Sci. Technol., 43:1033–1041.
- Kladopoulou, E. A., Yang, S. L., Johnson, J. H., Parker, G. G., and Konstandopoulos, A. G. (2003). A Study Describing the Performance of Diesel Particulate Filters during Loading and Regeneration: A Lumped Parameter Model for Control Applications. SAE Transactions., 112:647–668.
- Lange, R., Fissan, H., and Schmidt-Ottt, A. (2000). A New Method for the Determination of the Interception Equivalent Diameter. J. Aerosol Sci., 31:221–231.
- Li, M., Mulholland, G. W., and Zachariah, M. R. (2012). The Effect of Orientation on the Mobility and Dynamic Shape Factor of Charged Axially Symmetric Particles in an Electric Field. Aerosol Sci. Technol., 46:1035–1044.
- Li, M., You, R., Mulholland, G. W., and Zachariah, M. R. (2013). Evaluating the Mobility of Nanorods in Electric Fields. Aerosol Sci. Technol., 47:1101–1107.
- Li, M., You, R., Mulholland, G. W., and Zachariah, M. R. (2014). Development of a Pulsed-Field Differential Mobility Analyzer: A Method for Measuring Shape Parameters for Nonspherical Particles. Aerosol Sci. Technol., 48:22–30.
- Manton, M. J. (1978). The Impaction of Aerosols on a Nuclepore Filter. Atmo. Environ., 12:1669–1675.
- Manton, M. J. (1979). Brownian Diffusion of Aerosols to the Face of a Nuclepore Filter. Atmo. Environ., 13:525–531.
- Mathur, A., and Chavan, S. (2008). Exhaust Filtration: Fibre Based Solutions in Diesel Exhaust Filtration. Filtr. Separat., 45:32–35.
- NIOSH. (2009). Approaches to Safe Nanotechnology: Managing the Health and Safety Concerns with Engineered Nanomaterials (DHHS (NIOSH) Publication No. 2009-125). U.S. Department of Health and Human Services, Centers for Disease Control, National Institute for Occupational Safety and Health, Cincinnati, OH.
- NIOSH. (2013). NIOSH Current Intelligence Bulletin 65: Occupational Exposure to Carbon Nanotubes and Nanofibers (DHHS (NIOSH) Publication No. 2013-145). U.S. Department of Health and Human Services, Centers for Disease Control, National Institute for Occupational Safety and Health, Cincinnati, OH.
- Park, K., Kittelson, D. B., and McMurry, P. H. (2004). Structural Properties of Diesel Exhaust Particle Measured by Transmission Electron Microscopy (TEM): Relationships to Particle Mass and Mobility. Aerosol Sci. Technol., 38:881–889.
- Poland, C. A., Duffin, R., Kinloch, I., Maynard, A., Wallace, W. A. H., Seaton, A., Stone, V., Brown, S., Macnee, W., and Donaldson, K. (2008). Carbon Nanotubes Introduced into the Abdominal Cavity of Mice Show Asbestos-Like Pathogenicity in a Pilot Study. Nat. Nanotechnol., 3:423–428.
- Pui, D. Y. H., Chen, S. C., and Zuo, Z. (2014). PM2.5 in China: Measurements, Sources, Visibility and Health Effects, and Mitigation. Particuology, 13:1–26.
- Scheckman, J. H., McMurry, P. H., and Pratsinis, S. E. (2009). Rapid Characterization of Agglomerate Aerosol by In Situ Mass-Mobility Measurements. Langmuir, 25:8248–8254.
- Shin, W. G., Wang, J., Mertler, M., Sachweh, B., Fissan, H., and Pui, D. Y. H. (2009). Structural Properties of Silver Nanoparticle Agglomerates Based on Transmission Electron Microscopy: Relationship to Particle Mobility Analysis. J. Nanopart. Res., 11:163–173.
- Shvedova, A. A., Kisin, E., Murray, A. R., Johnson, V. J., Gorelik, O., Arepalli, S., Hubbs, A. F., Mercer, R. R., Keohavong, P., Sussman, N., Jin, J., Stone, S., Chen, B., Deye, G., Maynard, A., Castranova, V., Baron, P. A., and Kagan, V. (2008). Inhalation Versus Aspiration of Single Walled Carbon Nanotubes in C57BL/6 Mice: Inflammation, Fibrosis, Oxidative Stress and Mutagenesis. Am. J. Physiol, Lung Cell Mol. Physiol., 295:L552–565.
- Sorensen, C. M. (2011). The Mobility of Fractal Aggregates: A Review. Aerosol Sci. Technol., 45:765–779.
- Spurny, K. R., Lodge, J. P., Frank, E. R., and Sheesley, D. C. (1969). Aerosol Filtration by Means of Nuclepore Filters: Structural and Filtration Properties. Environ. Sci. Technol., 3:453–464.
- Wang, J., Kim, S. C., and Pui, D. Y. H. (2011). Carbon Nanotube Penetration through a Screen Filter: Numerical Modeling and Comparison with Experiments. Aerosol Sci. Technol., 45:443–452.