
Abstract
The hygroscopic tandem differential mobility analyzer (HTDMA) has been frequently used to measure the hygroscopic properties of atmospheric aerosols at a fixed high relative humidity (RH) of about 90%. To evaluate if such measurements could be used to determine the hygroscopicity of aerosols at lower RH, simultaneous hygroscopic growth factor (GF) and size-resolved composition measurements were made with an HTDMA and a high-resolution aerosol mass spectrometer (HR-AMS), respectively, at a coastal site in Hong Kong from January to June and in August 2012. A total of 58 cycles of dehydration (decreasing RH) and hydration (increasing RH) of 100 nm and 200 nm particles with organic-to-inorganic mass ratio ranging from 0.19 to 1.97 were measured at RH = 10–93%. The Kappa (κ) equation developed by Petters and Kreidenweis in the year 2007 was used to determine (i) κ at individual RHs (κRH) and (ii) best-fit κ covering the range of RHs measured (κf) for the more-hygroscopic (MH) mode, which describes more than 80% of the particles in each cycle, during dehydration. Overall, κ at 90% RH or above (κ>90) fell between 0.18 and 0.48, and was within 15% of κf in 83% of the datasets. Regression analysis between κ>90 or κf and AMS mass fractions showed that κ was positively correlated with sulfate but negatively correlated with organic and nitrate. In most cases, κRH increased as RH decreased and the average increase in κ was 45% from 90% RH to 40% RH, but these differences yielded insignificant changes in the GF-RH curves. The Zdanovskii-Stokes-Robinson (ZSR) estimated κ were mostly within 20% of κ>90 and κf. GF predictions using the empirical correlation of κ with AMS mass fractions or the ZSR estimated κ were within 10% of additional measurements and hence κ>90 is useful for predicting GF at lower RHs.
Copyright 2015 American Association for Aerosol Research
1. INTRODUCTION
Aerosol optical properties and the tendency of aerosols to act as cloud condensation nuclei are the key parameters for determining the radiative forcing by aerosols (Forster et al. Citation2007 and references therein). They are strongly associated with aerosol hygroscopicity (Brechtel and Kreidenweis Citation2000a,Citationb; Jacobson Citation2001; Penner et al. Citation2001; Kreidenweis et al. Citation2005), and affect regional visibility and human health. Upon hygroscopic growth, grown aerosol particles are more efficient at light absorption and scattering with their increased cross-sectional area (Malm et al. Citation2003). Aerosol effects on human health also depend on the aerosol size. The size of aerosols governs their residence time and hence where they are deposited in the respiratory tract (Kreyling et al. Citation2006).
Many previous laboratory studies have shown that multi-component particles can exhibit partial deliquescence and efflorescence through water uptake and evaporation processes (Martin Citation2000; Ling and Chan Citation2008; Yeung and Chan Citation2010). Some particles of complex internal mixtures can undergo continuous water uptake without hysteresis (Martin Citation2000; Marcolli et al. Citation2004; Marcolli and Krieger Citation2006; Moore and Raymond Citation2008). Extensive laboratory studies have demonstrated the complexity of the hysteresis behaviors. Ammonium sulfate, a dominant and highly hygroscopic inorganic species in fine mode aerosols, exhibits deliquescence at 80% RH at 25°C. However, the addition of ammonium nitrate reduces the growth factor (GF; Chan et al. Citation1992) while a reduction in the degree of neutralization increases it but lowers the deliquescence relative humidity (DRH; Kim et al. Citation1994). The addition of organic components would alter the hygroscopic behavior of the inorganic aerosols, especially the DRH and the efflorescence RH (Choi and Chan Citation2002; Hämeri et al. Citation2002; Meyer et al. Citation2009; Li et al. Citation2014), and mixed organics have been found to be non-deliquescent (Marcolli et al. Citation2004; Marcolli and Krieger Citation2006).
In the atmosphere, particles may exist as either supersaturated droplets or solids under low RH conditions (Santarpia et al. Citation2004; Gasparini et al. Citation2006; Taylor et al. Citation2011). Knowledge of hysteresis and the phase transition of ambient aerosols are critical to a proper description of the aerosol water content so as to assess their impacts on both the global climate and local visibility. Furthermore, size-resolved hygroscopicity data can be used to develop and validate aerosol models on various spatial scales with changing humidity conditions (Swietlicki et al. Citation2008). Unfortunately, most of the previous field studies were conducted under a fixed RH condition. There is a lack of complete growth/evaporation measurements to fully characterize the hysteresis behavior of ambient aerosols (Santarpia et al. Citation2005). A description of GF in an RH cycle with chemical parameters would also help improve the accuracy of model predictions. However, GF-RH curves and aerosol composition have not been simultaneously measured to date.
Hygroscopic tandem differential mobility analyzer (HTDMA) measurements have been reported by many researchers (McMurry et al. Citation1996; Chan and Chan Citation2005 and references therein; Eichler et al. Citation2008; Swietlicki et al. Citation2008 and references therein; Massling et al. Citation2009; Kammermann et al. Citation2010; Kim et al. Citation2011; Liu et al. Citation2011; Stock et al. Citation2011; Tan et al. Citation2013; Ye et al. Citation2013). Earlier closure analyses relied on filter-based compositional measurements and hence were time integrated. They failed to take full advantage of the HTDMA data with higher time resolution. With the advances in instrumentation, real-time chemical composition data of inorganic ions and total organics have become readily available (Drewnick et al. Citation2005; Canagaratna et al. Citation2007). Closure analyses based on both real-time HTDMA and aerosol compositional data are valuable and can be used to evaluate suitable models for GF predictions. However, most HTDMA measurements were made at a fixed RH of typically 85% or 90%, limiting the range of RHs at which models can be tested.
Hong Kong is situated in the southeast of the Pearl River Delta (PRD), one of China's major manufacturing centers and one of the world's most densely urbanized areas with a population of more than 50 million. Influenced by the monsoons in East Asia, a clean maritime airstream from the southwest monsoon originating from the South China Sea makes its way to Hong Kong during summertime. In addition, air quality in Hong Kong can also be affected by the polluted continental and coastal inflows, which tend to increase pollutant concentrations. The rapid urbanization and industrial development in the PRD has led to aggravating air pollution problems throughout the region (Fang et al. Citation2009). In Hong Kong, the number of low-visibility (<8 km) days in a year has been going up since the 1980s and has seen a dramatic rise since the early 2000s. Particulate matter has long been recognized as a major culprit behind the poor air quality in the city (Chan and Yao Citation2008).
Simultaneous high-resolution time-of-flight aerosol mass spectrometer (HR-ToF-AMS) and HTDMA measurements at 90% RH were made in May, September, and November 2011 at the HKUST Air Quality Research Supersite in Hong Kong (Yeung et al. Citation2014). Closure analyses of the size-resolved AMS composition data and the hygroscopic growth of ambient aerosols with an HTDMA were conducted. Overall, the measured GF was within ±10% of the predicted value based on AMS aerosol composition, reflecting good agreement. The closure study confirms the usefulness of aerosol composition for predicting GF at 90% RH in real-time measurements.
Real-time chemical information of aerosols will likely become more abundant as aerosol mass spectrometry grows in popularity. However, direct hygroscopic measurements may still be less readily available. Approaches that allow predictions of the GF-RH relationship using real-time chemical composition measurements should therefore be developed. One of the goals of this research is to develop empirical equations based on AMS compositions for estimating GFs at varying RH. We present new GF measurements with the HTDMA at RHs between 10% and 93% in both dehydration and hydration routes taken from January to June and in August 2012 at the HKUST Supersite. Simultaneous HR-ToF-AMS measurements were made for parameterizing the GF-RH dependence of the dehydration route with the hygroscopicity parameter Kappa (κ; Petters and Kreidenweis Citation2007). We also evaluate the performance of κ obtained by the empirical Zdanovskii-Stokes-Robinson (ZSR) equation in predicting GF-RH dependence based on inorganic and organic fractions obtained from AMS. To the best of our knowledge, this is the first time simultaneous RH-dependent GF and HR-AMS measurements are made.
Since most ambient HTDMA measurements are commonly made at a fixed high RH, such as 90%, we examine whether the κ obtained at a high RH can adequately describe the GF as a function of RH, especially at lower RH values. We first compared the κ evaluated at 90–93% RH (κ>90) and the κ evaluated at different RH values (κRH) as well as the best-fit κ obtained for each GF-RH curve (κf). We further developed regression equations relating the aerosol AMS fractional compositions to κ>90 or κf. GF predictions based on these regression and ZSR equations are shown to produce comparable GF-RH dependence to other experimental datasets at this site not used for the regression.
2. EXPERIMENTAL
The sampling site is the HKUST Air Quality Research Supersite, located on the shorefront of the HKUST campus in the Hong Kong suburban area. Sitting on the windward side of Hong Kong, it is a suitable location to study the background air quality and the transportation of pollutants into Hong Kong. There is no major emission source near the site and the traffic volume is low on campus. The effects of meteorology, local emissions, and long-range transport on the aerosol abundance and composition of NR-PM1 (non-refractory components in particulate matter less than 1 micron) at this site have been presented elsewhere (Lee et al. Citation2013b; Li et al. Citation2013; Li et al. Citation2015). The average percentage contributions of sulfate (organic) to NR-PM1 in May, September, November 2011, and February 2012 are 51.8 (27.6)%, 55.8 (26.3)%, 44.7 (37.4)%, and 40.1 (33.3)%, respectively, whereas the corresponding contributions of low-volatility oxygenated organic aerosols (semi-volatile oxygenated organic aerosols) to the total organics are 40.9 (38.9)%, 29.1 (52.7)%, 45.5 (40.8)%, and 54.8 (26.0)% (Li et al. Citation2015). The high sulfate and OOA contributions reflect the fact that this receptor site is affected mainly by regional pollution within the PRD and super-regional pollution from long-range transport outside the PRD area (Wu et al. Citation2013).
In this study, we focus on the correlation between new HTDMA and AMS compositional data acquired from January to June and in August 2012. Aerosol hygroscopicity in terms of the GF diameter ratio as a function of RH was measured using a Brechtel Manufacturing Inc. (BMI) HTDMA system (Model 3002). Detailed characterization with respect to DMA sizing, RH control, and GF measurements of the BMI instrument is available from Lopez-Yglesias et al. (Citation2014). Since no major differences in GF at 90% RH for particles larger than 75 nm were found in a previous study (Yeung et al. Citation2014), and the concentrations of smaller particles were usually relatively low at our site so that accurate real-time chemical composition measurements cannot be obtained, GFs of dry particles of 100 nm and 200 nm in diameter were measured in this study. The mass concentrations of NR-PM1 and components were measured with an Aerodyne HR-ToF-AMS. Detailed descriptions of HR-ToF-AMS operation and data treatment are available elsewhere (DeCarlo et al. Citation2006; Lee et al. Citation2013a,Citationb; Li et al. Citation2013). Correlations between the size-resolved pToF data of the HR-ToF-AMS measurements and the HTDMA growth data were established. Since the HR-ToF-AMS measurements used the vacuum aerodynamic diameter while the HTDMA measured the mobility diameter, conversion between the two diameter types was achieved by assuming that the aerosol samples were perfect spheres and the particle density was 1500 kg m−3 (DeCarlo et al. Citation2004; Gysel et al. Citation2007). The size-resolved mass concentrations were obtained by performing integration over the vacuum aerodynamic diameter ranges of 136–186 nm and 253–345 nm, with the geometric mean diameters of these ranges corresponding to the mobility diameters of 100 nm and 200 nm, respectively (Yeung et al. Citation2014).
Simultaneous GF-RH measurements at RHs up to 93% and AMS measurements were made for 58 cycles of dehydration and hydration from January to June 2012. Each cycle took about 3 h to measure, with each GF measurement at an RH taking 10 min. In the following analysis, we use the dehydration data for curve fitting and develop empirical equations to estimate the GF data.
The data indicating large fluctuation of aerosol compositions and low mass loading (<0.5 μg m−3) were excluded from this analysis. The fractional compositions were reasonably stable over the course of measurement of each cycle. The mean relative standard deviations of fractions of sulfate and organics are 22.1% and 18.5%, respectively. We did not include chloride in the analysis because its concentrations were usually less than 1%. It should be noted that HR-ToF-AMS cannot detect refractory components. However, the PM2.5 filter samples have revealed that elemental carbon (EC) and sea salt are usually low (less than 5%) at this particular site (Huang et al. Citation2014). Therefore EC is not expected to play major roles in this study.
3. RESULTS AND DISCUSSION
3.1. Parameterization of GF
Bi-modal GF distributions with a dominant more-hygroscopic (MH) mode and a small fraction (number fraction <0.2) of the non-hygroscopic (NH) or less-hygroscopic (LH) mode were typically observed throughout the study. Since the NH and LH modes are small and are usually attributed to EC, which cannot be measured by the HR-ToF-AMS, we only focus on the data from the MH mode. We first parameterize the measured GF of the dehydration route using the K-equation (Petters and Kreidenweis Citation2007):[1] where σs/a is the surface tension of the solution/air interface, Mw is the molecular weight of water, R is the universal gas constant, T is the absolute temperature, ρw is water density, D0 is the particle diameter, and σs/a and T are assumed to be 0.072 Jm−2 and 298.15 K, respectively.
Rearranging EquationEquation (1)[1] allows us to obtain K based on the measured GF at each RH between 10% and 93%:
[2]
There are no noticeable differences in the GF between the 100 nm and 200 nm dry particles and hence they are grouped together in our analysis.
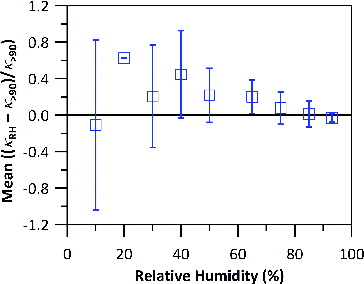
shows the value of (κRH – κ>90)/κ>90, averaged over all 58 cycles, as a function of RH. κ at 40% RH can be 45% larger than κ>90. Furthermore, the ratio fluctuates wildly at low RHs because κ is more sensitive to GF. For instance, a 2% difference in GF can result in more than 50% difference in κ at 10% RH but less than 20% difference at 60% RH or above. Hence, κ>90 may not be representative of κ at lower RHs. However, the differences in κ at different values of RH may not necessarily lead to significant changes in the GF-RH relationship. To confirm this, we further evaluate the GF predictions based on the parameterization of κ>90 with AMS chemical composition.
FIG. 1. Average of ((κRH – κ>90)/κ>90) against RH for the 58 cycles of GF-RH measurements. Note that there is only one data point at 20% RH, hence no standard deviation is available.
In addition to calculating κ at each RH, a best-fit κ (κf) can also be obtained for the dehydration route after converting RH into water activity (aw):[3]
The best-fit κ and κ>90 are within 10% of each other in 41 out of 58 cycles. They differ by less than 20% in the rest of the data.
At 90% RH or above, κ>90 fell between 0.18 and 0.48. Based on the values of κ>90 and the observation of hysteresis or not, we further grouped the data into four categories, namely 1a: less hygroscopic (κ>90 < 0.28) without hysteresis (n = 7, average κ>90 = 0.21 ± 0.02); 1b: less hygroscopic (κ>90 < 0.28) with hysteresis (n = 13, κ>90 = 0.24 ± 0.03); 2: moderately hygroscopic (0.28 < κ>90 < 0.36) with hysteresis (n = 20, κ>90 = 0.32 ± 0.03); and 3: more hygroscopic (0.36 < κ>90 < 0.50) with hysteresis (n = 18; κ>90 = 0.41 ± 0.03). summarizes the dehydration and hydration measurements in these four categories. Except the seven samples of the less hygroscopic aerosols, most samples exhibited hysteresis with deliquescence between 60% and 80% RH. The dehydration and hydration data above 80% RH are consistent, which serve as an indication of their deliquescence at around 80% RH—the DRH value of ammonium sulfate. Upon dehydration, GF decreased as RH decreased and efflorescence was not apparent for most cases even when RH dropped to about 30%. Efflorescence at lower RHs was only observed in 17 cycles out of a total of 58. Note that the lines in the figure only connect the average GFs at specific RHs to show the overall behavior of the GF and are not curve fittings.
FIG. 2. GF as a function of RH for (a) Group 1a: less hygroscopic without hysteresis, (b) Group 1b: less hygroscopic with hysteresis, (c) Group 2: moderately hygroscopic with hysteresis, and (d) Group 3: more hygroscopic with hysteresis of ambient aerosols. Both dehydration (circle [blue] and solid line) and hydration (diamond [red] and dashed line) routes are shown. The lines connect the average GF at each RH.
![FIG. 2. GF as a function of RH for (a) Group 1a: less hygroscopic without hysteresis, (b) Group 1b: less hygroscopic with hysteresis, (c) Group 2: moderately hygroscopic with hysteresis, and (d) Group 3: more hygroscopic with hysteresis of ambient aerosols. Both dehydration (circle [blue] and solid line) and hydration (diamond [red] and dashed line) routes are shown. The lines connect the average GF at each RH.](/cms/asset/8e126721-43a3-4fa1-bc8d-5635cbb8d64c/uast_a_1058482_f0002_oc.jpg)
summarizes κ>90 and the mass fractional composition of HR-ToF-AMS data for organics, sulfate, nitrate, and ammonium. In general, sulfate and organics dominate the mass compositions, with a combined contribution of close to 80% of NR-PM1, consistent with previous measurements by Li et al. (Citation2015). κ is positively correlated with the sulfate fraction, f(SO4), but negatively correlated with the organics and nitrate fractions (f(Org) and f(NO3), respectively). Although f(Org) affects the trends of κ, the inorganics dominate GF. For example, the ZSR mixing rule is often used to represent the GF of mixed aerosols (Zdanovskii Citation1948; Stokes and Robinson Citation1966; Gysel et al. Citation2007; Yeung et al. Citation2014):[4]
TABLE 1 Summary of κ>90, mass, mass fractions of organics, sulfate, nitrate, ammonium, and mole ratio of (NH4-NO3)/SO4
The above equation can be simplified to the following if we categorize the aerosol components into inorganics and organics alone:[5]
The GF of the mixed particles is dominated by GFinorg, which is much larger than GForg. This is especially true in our case where f(Org) is typically less than 50%. In fact, Yeung et al. (Citation2014) conducted a closure analysis of the GF at 90% RH based on the May, September, and November 2011 data at the HKUST supersite and found that approximations for GForg using the fraction of m/z 44 in organic mass spectra (Duplissy et al. Citation2011), the oxygen-to-carbon atomic ratio (Massoli et al. Citation2010), and the organic factors with different oxidation levels resolved by positive matrix factorization (PMF) from HR-ToF-AMS measurements did not yield better closure results than using a constant value of GForg (1.18). This is likely because of the overall dominance of sulfate in the GF of the MH mode.
Ammonium is associated with sulfate and nitrate. The molar ratio (NH4-NO3)/SO4 indicates the extent of neutralization, which affects the deliquescence properties of sulfate aerosols. As shown in , the average ratios of cases with hysteresis (1b, 2, and 3) are close to 2 but that of LH aerosols without hysteresis (1a) is 1.73. Acidic sulfate and slightly higher nitrate and lower sulfate contents may have made the aerosols non-deliquescent. The average mass concentrations of the species are also available in .
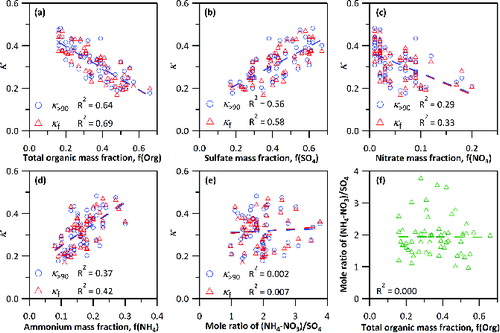
shows the correlation analysis of κf and κ>90 and the fractional mass percentages of the different components. The R2 for κf and κ>90 agree with each other to within 15% for f(Org), f(SO4), and f(NO3). The mean R2 of correlations of κf and κ>90 with f(Org), f(SO4), f(NH4), and f(NO3) are 0.67, 0.57, 0.40, and 0.31, respectively. These correlations reflect the dominance of sulfate and organics, and, to a lesser extent, ammonium and non-deliquescent ammonium nitrate, in the hygroscopic properties of the aerosols. Correlation analysis of the molar ratio (NH4-NO3)/SO4 with κ and organics fractions were also conducted, yet poor correlations were found (e and f). The R2 are close to zero for both cases, reflecting that the extent of neutralization is not associated with hygroscopicity and organics of aerosols in the dehydration route.
FIG. 3. Correlation plots between κ>90 or κf and mass fractions of (a) total organic, (b) sulfate, (c) nitrate, (d) ammonium, and (e) mole ratio of ammonium nitrate to sulfate. Correlation plot between (f) mole ratio of ammonium nitrate to sulfate and total organic mass fraction is also obtained. Dashed lines in each plot are the linear fittings between the two parameters, with an R2 at the bottom left corner.
3.2. Regression Analysis of κ using AMS Mass Fractions
We have further established the following empirical equations to represent κf and κ>90 based on the fractional compositions for predicting the GF-RH curves. In the following discussions, κ′ denotes the Kappa calculated from mass fractions of organic, sulfate, and ammonium.
Model I: Linear regression with f(Org):[6a]
[6b]
Model II: Multiple linear regression with f(Org) and f(SO4):[7a]
[7b]
Model III: Multiple linear regression with f(Org), f(SO4), and f(NH4):[8a]
[8b]
Model I includes only f(Org) and does not differentiate among the different inorganic components. Model II includes f(Org) and f(SO4). It does not yield a larger R2 because sulfate is highly correlated to ammonium and these two species dominate the inorganic mass fractions. Model III includes ammonium to reflect the role of the extent of neutralization of sulfate in hygroscopic properties. All three models show very comparable results with Model III showing a slightly better R2. plots κ′ using Model III against κf or κ>90. In both cases, κ′ obtained from the three models are within 7%. Values of κ′f and κ′>90 are within 5%, with κ′f being more evenly distributed around the 1 to 1 line. Altogether, 76–83% of κ′ agree with κ to within 20%.
FIG. 4. Closure analysis between κ′ calculated from regression Model III and (a) κ>90 (triangle [green]) or (b) κf (circle [red]). Closure analysis between κ′ calculated using ZSR mixing rule (square [purple]) and κ>90 is also plotted in (a).
![FIG. 4. Closure analysis between κ′ calculated from regression Model III and (a) κ>90 (triangle [green]) or (b) κf (circle [red]). Closure analysis between κ′ calculated using ZSR mixing rule (square [purple]) and κ>90 is also plotted in (a).](/cms/asset/0c52f6cc-0df7-4e1b-b999-6ba1996e8e6c/uast_a_1058482_f0004_oc.jpg)
It should be noted that some datasets cannot be fitted well with EquationEquation (3)[3] (). For these cases, even agreements between κf or κ>90 and the corresponding κ′ do not produce GF-RH trends that are consistent with the measurement. Better description of organic components with different organic factors might improve the agreement. However, typical PMF analysis of bulk AMS data can yield different organic factors but size-resolved PMF analysis is not common yet. Furthermore, the GF-RH dependence is less sensitive to κ at higher values of κ (see discussions later and Figure S1 in the online supplemental information [SI]). Hence, the effect of the difference between κ and κ′ becomes smaller for MH aerosols.
FIG. 5. Example of datasets of which the fitted (dashed line) and predicted GF curves obtained by κ′>90 (square [blue] and dashed line) or κ′ZSR (circle [green] and solid line) agree yet deviate from the measured GF-RH trend (circle [red]).
![FIG. 5. Example of datasets of which the fitted (dashed line) and predicted GF curves obtained by κ′>90 (square [blue] and dashed line) or κ′ZSR (circle [green] and solid line) agree yet deviate from the measured GF-RH trend (circle [red]).](/cms/asset/e819cb5f-c732-4e07-a486-409fa9d6f5d6/uast_a_1058482_f0005_oc.jpg)
3.3. Estimation of κ by ZSR Mixing Rule
We also estimated κ by the ZSR mixing rule (EquationEquation (9)[9] ) (Petters and Kreidenweis Citation2007). The volume fractions are calculated from the AMS mass using densities of 1300 kg m−3 for organics and 1750 kg m−3 for inorganics (Cross et al. Citation2007; King et al. Citation2007; Meng et al. Citation2014). κ for organics and inorganics are assumed to be 0.078 and 0.53, respectively. These values correspond to GForg and GFinorg of about 1.18 and 1.75, respectively (Topping et al. Citation2005; Gysel et al. Citation2007).
[9] where κorg and κinorg are the organic and inorganic volume fractions.
a plots κ′ZSR against κ>90 for the 58 datasets. Values of κ′ZSR and κ>90 are within 20% in 71% of the datasets. In , we compared the GF-RH dependence estimated by κ′ZSR and the actual measurements for cases that κ′ZSR and κ>90 differ by more than 20%. Despite such differences, κ′ZSR gives GF predictions in good agreement with the measurements except for a dataset measured on 31 January. Overall, GF at 30, 60, and 90% are within 5%, 5%, and 10% of these 17 datasets, respectively.
FIG. 6. Measured GF (circle [red]) and predicted GF calculated using κ′ZSR (circle [green] and solid line) of 17 cycles of which κ′ZSR and κ>90 differ by over 20%.
![FIG. 6. Measured GF (circle [red]) and predicted GF calculated using κ′ZSR (circle [green] and solid line) of 17 cycles of which κ′ZSR and κ>90 differ by over 20%.](/cms/asset/b08245b0-6aba-4644-83e4-ea5dd8cfe325/uast_a_1058482_f0006_oc.jpg)
3.4. Performance of the Regression Models and ZSR Method
a compares the predictions based on Model III and the ZSR model and seven dehydration measurements in January–June 2012 at RH below 90%. A stable RH above 90% was not achieved during these measurements and thus these data were not included in the 58 cycles for the regression analysis of κ (i.e., ). compares the calculated results with data measured in August 2012. Table S1 in the online SI shows the details of these additional measurements used for evaluating the regression analysis of κ.
FIG. 7. Performance test of κ′ on (a) seven sets of GF measurements made in January and February 2012, which were not parameterized, and (b) six sets made in August 2012. Predicted GF curves calculated by κ′>90 (square [blue] and dashed line) obtained from Model III or κ′ZSR (circle [green] and solid line) is compared with actual measurements made by the HTDMA (circle [red]).
![FIG. 7. Performance test of κ′ on (a) seven sets of GF measurements made in January and February 2012, which were not parameterized, and (b) six sets made in August 2012. Predicted GF curves calculated by κ′>90 (square [blue] and dashed line) obtained from Model III or κ′ZSR (circle [green] and solid line) is compared with actual measurements made by the HTDMA (circle [red]).](/cms/asset/8ace365c-3fe8-4c92-9904-77d9a9342968/uast_a_1058482_f0007_oc.jpg)
Predictions of Models I and II are very similar to those of Model III and hence they are not shown here. Moreover, since κ′f and κ′>90 are within 5%, only GF predictions by κ′>90 and κ′ZSR will be shown. In a, except datasets on 31 January and 6 February, all datasets exhibit continuous uptake without hysteresis. In most cases, predictions agree well with the experimental measurements. Since no GF measurements were made at 90% or above RH in these datasets, κ at the highest RH in the dataset was compared with κ′>90 or κ′ZSR. Although the difference between κ and κ′ ranges from 3% to 31%, the predicted GFs fall within 10% of measured GFs. The difference between predicted and measured GFs is larger when κ or κ′ is smaller than 0.2. Datasets gathered on 31 January and 23 August (both a and b) show under-prediction of the GF by κ′>90 and they have f(Org) = 0.62, 0.69, and 0.64, respectively. These fractions are significantly larger than the average for the 58 datasets (0.36 ± 0.13) for the regression analysis and hence the regression equation may not fit these extrapolated cases well. The corresponding values of κ′ of these three datasets are smaller than 0.2. Since GF-RH dependence is also more sensitive to κ at smaller κ (Figure S1), an overall larger under-prediction of GF than other datasets is resulted. The dataset gathered on 9 August has a low f(Org) and there is no obvious reason for the under-prediction by both κ′>90 and κ′ZSR. We have also examined these datasets in conjunction with those original datasets that show deviations between predictions and measurements (i.e., cases similar to ) in terms of their f43/f44/f57 fractions, and the (NH4-NO3)/SO4 ratios. These parameters cannot satisfactorily explain disagreement between the measured and predicted GF-RH data in these cases. It should be noted that although κ′ZSR seems to give good GF prediction for a wider range of organic concentrations than κ′>90, it is also sensitive to the uncertainties in the density and κ values assumed for individual components.
An important question in estimating the hygroscopic properties of ambient aerosols is whether the dehydration data or the hydration data should be used. In principle, without direct measurements, air mass history including RH and compositional changes is needed. Hong Kong can be affected by marine/oceanic, coastal, and continental air masses (Li et al. Citation2015). Because of the subtropical climate, the RH in the city rarely drops below 50% (http://www.weather.gov.hk/cis/normal/1981_2010/normals_e.htm). Figure S2 in the online SI shows a plot of monthly average RH in Hong Kong over the period of 1981–2010 obtained from the Hong Kong Observatory. The lowest monthly average RHs at 2 AM and 2 PM were 74% and 61% in December, respectively. The likelihood of a dry air mass with an RH below 30% reaching Hong Kong is small, even if it is a continental air mass from southern China. On the other hand, the air mass is likely to have experienced deliquescence through cloud processing or at night during their transport to Hong Kong. Hence, the particles are less likely to be in the dry state under the ambient conditions in Hong Kong. On the basis of the GF-RH measurements made, the dehydration data are believed to be more representative of the GF of aerosols in Hong Kong at a given RH than the hydration data.
4. IMPLICATIONS
In this study, using simultaneous HTDMA at varying RH and AMS measurements, the performance of various estimations and regression results of κ to predict RH-dependent GF is made. Although κ may be 45% larger at 90% or above RH than at 40% RH, it can be used for predicting GF of ambient aerosols. The regression results of κ as well as estimates using the ZSR equation based on AMS compositional measurements yielded good predictions of the GF at RHs between 10% and 93% at this site. Although κ′ZSR may work for a wider range of aerosol compositions than κ′>90, assumptions of densities and κinorg and κorg are needed a priori.
This study was limited by a rather small sample of GF-RH and AMS measurements. Nevertheless, the ranges of AMS composition and GF obtained were comparable to those in a much larger dataset that we obtained at the same site. For example, in our earlier AMS study in May, September, November 2011, and February 2012 (Yeung et al. Citation2014), organics and sulfate fractions ranged from about 26% to 38% and 40% to 56%, respectively. These ranges are comparable to those in . Furthermore, the GF at about 90% RH in this work ranged from 1.32 to 1.91, comparable to our GF measurements of 1.35 to 1.75 at a fixed 90% RH in May, September, and Nov 2011. Hence, despite the limited measurement period, the current study spanned a representative range of RHs, GFs, and aerosol compositions found at this site.
The results presented in this article are based on the data obtained at the HKUST supersite, which is dominant by sulfate and is mostly affected by regional pollution. They may be useful to serve as a first estimate of the water uptake of the regional particulate matter in nearby areas in the PRD or areas affected by mainly secondary particulate matter. Since the composition and hygroscopicity of organics may vary, more GF-RH and compositional measurements at different locations and seasons are needed to refine the parameterization. The results of this work, when used in conjunction with simple mixing rules to include contributions of elemental carbon and other species not considered here, can be used for estimating the GF of more complex mixed particles.
UAST_1058482_Supplemental_File.zip
Download Zip (361.1 KB)Funding
This work was funded by the Research Grants Council (General Research Fund 600413) and the Environment and Conservation Fund (ECWW09EG04) of Hong Kong.
REFERENCES
- Brechtel, F. J., and Kreidenweis, S. M. (2000a). Predicting Particle Critical Supersaturation from Hygroscopic Growth Measurements in the Humidified TDMA. Part II: Laboratory and Ambient Studies. J. Atmos. Sci., 57:1872–1887.
- Brechtel, F. J., and Kreidenweis, S. M. (2000b). Predicting Particle Critical Supersaturation from Hygroscopic Growth Measurements in the Humidified TDMA. part I: Theory and Sensitivity Studies. J. Atmos. Sci., 57:1854–1871.
- Canagaratna, M. R., Jayne, J. T., Jimenez, J. L., Allan, J. D., Alfarra, M. R., Zhang, Q., Onasch, T. B., Drewnick, F., Coe, H., Middlebrook, A., Delia, A., Williams, L. R., Trimborn, A. M., Northway, M. J., DeCarlo, P. F., Kolb, C. E., Davidovits, P., and Worsnop, D. R. (2007). Chemical and Microphysical Characterization of Ambient Aerosols with the Aerodyne Aerosol Mass Spectrometer. Mass Spectrom. Rev., 26:185–222.
- Chan, C. K., Flagan, R. C., and Seinfeld, J. H. (1992). Water Activities of NH4NO3/(NH4)2SO4 Solutions. Atmos. Environ. A-Gen. Topics, 26:1661–1673.
- Chan, C. K., and Yao, X. (2008). Air Pollution in Mega Cities in China. Atmos. Environ., 42:1–42.
- Chan, M. N., and Chan, C. K. (2005). Mass Transfer Effects in Hygroscopic Measurements of Aerosol Particles. Atmos. Chem. Phys., 5:2703–2712.
- Choi, M. Y., and Chan, C. K. (2002). The Effects of Organic Species on the Hygroscopic Behaviors of Inorganic Aerosols. Environ. Sci. Technol., 36:2422–2428.
- Cross, E. S., Slowik, J. G., Davidovits, P., Allan, J. D., Worsnop, D. R., Jayne, J. T., Lewis, D. K., Canagaratna, M., and Onasch, T. B. (2007). Laboratory and Ambient Particle Density Determinations Using Light Scattering in Conjunction with Aerosol Mass Spectrometry. Aerosol Sci. Technol., 41:343–359.
- DeCarlo, P. F., Kimmel, J. R., Trimborn, A., Northway, M. J., Jayne, J. T., Aiken, A. C., Gonin, M., Fuhrer, K., Horvath, T., Docherty, K. S., Worsnop, D. R., and Jimenez, J. L. (2006). Field-Deployable, High-Resolution, Time-of-Flight Aerosol Mass Spectrometer. Anal. Chem., 78:8281–8289.
- DeCarlo, P. F., Slowik, J. G., Worsnop, D. R., Davidovits, P., and Jimenez, J. L. (2004). Particle Morphology and Density Characterization by Combined Mobility and Aerodynamic Diameter Measurements. Part 1: Theory. Aerosol Sci. Technol., 38:1185–1205.
- Drewnick, F., Hings, S. S., DeCarlo, P., Jayne, J. T., Gonin, M., Fuhrer, K., Weimer, S., Jimenez, J. L., Demerjian, K. L., Borrmann, S., and Worsnop, D. R. (2005). A New Time-of-Flight Aerosol Mass Spectrometer (TOF-AMS) – Instrument Description and First Field Deployment. Aerosol Sci. Technol., 39:637–658.
- Duplissy, J., DeCarlo, P. F., Dommen, J., Alfarra, M. R., Metzger, A., Barmpadimos, I., Prevot, A. S. H., Weingartner, E., Tritscher, T., Gysel, M., Aiken, A. C., Jimenez, J. L., Canagaratna, M. R., Worsnop, D. R., Collins, D. R., Tomlinson, J., and Baltensperger, U. (2011). Relating Hygroscopicity and Composition of Organic Aerosol Particulate Matter. Atmos. Chem. Phys., 11:1155–1165.
- Eichler, H., Cheng, Y. F., Birmili, W., Nowak, A., Wiedensohler, A., Bruggemann, E., Gnauk, T., Herrmann, H., Althausen, D., Ansmann, A., Engelmann, R., Tesche, M., Wendisch, M., Zhang, Y. H., Hu, M., Liu, S., and Zeng, L. M. (2008). Hygroscopic Properties and Extinction of Aerosol Particles at Ambient Relative Humidity in South-Eastern China. Atmos. Environ., 42:6321–6334.
- Fang, M., Chan, C. K., and Yao, X. H. (2009). Managing Air Quality in a Rapidly Developing Nation: China. Atmos. Environ., 43:79–86.
- Forster, P., Ramaswamy, V., Solomon, S., Qin, D., Manning, M., Marquis, M., Averyt, K., Tignor, M. M. B., Miller, H. L., and Chen, Z. L. (2007). Changes in Atmospheric Constituents and in Radiative Forcing. Cambridge University Press, New York.
- Gasparini, R., Collins, D. R., Andrews, E., Sheridan, P. J., Ogren, J. A., and Hudson, J. G. (2006). Coupling Aerosol Size Distributions and Size-resolved Hygroscopicity to Predict Humidity-dependent Optical Properties and Cloud Condensation Nuclei Spectra. J. Geophys. Res.-Atmos., 111:16.
- Gysel, M., Crosier, J., Topping, D. O., Whitehead, J. D., Bower, K. N., Cubison, M. J., Williams, P. I., Flynn, M. J., McFiggans, G. B., and Coe, H. (2007). Closure Study between Chemical Composition and Hygroscopic Growth of Aerosol Particles during TORCH2. Atmos. Chem. Phys., 7:6131–6144.
- Hämeri, K., Charlson, R., and Hansson, H.-C. (2002). Hygroscopic Properties of Mixed Ammonium Sulfate and Carboxylic Acids Particles. AIChE J., 48:1309–1316.
- Huang, X. H. H., Bian, Q. J., Ng, W. M., Louie, P. K. K., and Yu, J. Z. (2014). Characterization of PM2.5 Major Components and Source Investigation in Suburban Hong Kong: A One Year Monitoring Study. Aerosol Air Qual. Res., 14:237–250.
- Jacobson, M. Z. (2001). Global Direct Radiative Forcing Due to Multicomponent Anthropogenic and Natural Aerosols. J. Geophys. Res.-Atmos., 106:1551–1568.
- Kammermann, L., Gysel, M., Weingartner, E., and Baltensperger, U. (2010). 13-month Climatology of the Aerosol Hygroscopicity at the free tropospheric site Jungfraujoch (3580 m a.s.l.). Atmos. Chem. Phys., 10:10717–10732.
- Kim, J. H., Yum, S. S., Shim, S., Yoon, S. C., Hudson, J. G., Park, J., and Lee, S. J. (2011). On Aerosol Hygroscopicity, Cloud Condensation Nuclei (CCN) Spectra and Critical Supersaturation Measured at Two Remote Islands of Korea between 2006 and 2009. Atmos. Chem. Phys., 11:12627–12645.
- Kim, Y. P., Pun, B. K. L., Chan, C. K., Flagan, R. C., and Seinfeld, J. H. (1994). Determination of Water Activity in Ammonium-Sulfate and Sulfuric-Acid Mixtures Using Levitated Single Particles. Aerosol Sci. Technol., 20:275–284.
- King, S. M., Rosenoern, T., Shilling, J. E., Chen, Q., and Martin, S. T. (2007). Cloud Condensation Nucleus Activity of Secondary Organic Aerosol Particles Mixed With Sulfate. Geophys. Res. Lett. 34: L24806.
- Kreidenweis, S. M., Koehler, K., DeMott, P. J., Prenni, A. J., Carrico, C., and Ervens, B. (2005). Water Activity and Activation Diameters from Hygroscopicity Data – Part I: Theory and Application to Inorganic Salts. Atmos. Chem. Phys., 5:1357–1370.
- Kreyling, W. G., Semmler-Behnke, M., and Moller, W. (2006). Health Implications of Nanoparticles. J. Nanopart. Res., 8:543–562.
- Lee, B. P., Li, Y. J., Flagan, R. C., Lo, C., and Chan, C. K. (2013a). Sizing Characterization of the Fast-Mobility Particle Sizer (FMPS) against SMPS and HR-ToF-AMS. Aerosol Sci. Technol., 47:1030–1037.
- Lee, B. P., Li, Y. J., Yu, J. Z., Louie, P. K. K., and Chan, C. K. (2013b). Physical and Chemical Characterization of Ambient Aerosol by HR-ToF-AMS at a Suburban Site in Hong Kong during Springtime 2011. J. Geophys. Res.-Atmos., 118:8625–8639.
- Li, Y. J., Huang, D. D., Cheung, H. Y., Lee, A. K. Y., and Chan, C. K. (2014). Aqueous-Phase Photochemical Oxidation and Direct Photolysis of Vanillin – A Model Compound of Methoxy Phenols from Biomass Burning. Atmos. Chem. Phys., 14:2871–2885.
- Li, Y. J., Lee, B. P., Su, L., Fung, J. C. H., and Chan, C. K. (2015). Seasonal Characteristics of Fine Particulate Matter (PM) Based on High-Resolution Time-of-Flight Aerosol Mass Spectrometric (HR-ToF-AMS) Measurements at the HKUST Supersite in Hong Kong. Atmos. Chem. Phys., 15:37–53.
- Li, Y. J., Lee, B. Y. L., Yu, J. Z., Ng, N. L., and Chan, C. K. (2013). Evaluating the Degree of Oxygenation of Organic Aerosol during Foggy and Hazy Days in Hong Kong Using High-Resolution Time-of-Flight Aerosol Mass Spectrometry (HR-ToF-AMS). Atmos. Chem. Phys., 13:8739–8753.
- Ling, T. Y., and Chan, C. K. (2008). Partial Crystallization and Deliquescence of Particles Containing Ammonium Sulfate and Dicarboxylic Acids. J. Geophys. Res.-Atmos., 113:15.
- Liu, P. F., Zhao, C. S., Gobel, T., Hallbauer, E., Nowak, A., Ran, L., Xu, W. Y., Deng, Z. Z., Ma, N., Mildenberger, K., Henning, S., Stratmann, F., and Wiedensohler, A. (2011). Hygroscopic Properties of Aerosol Particles at High Relative Humidity and Their Diurnal Variations in the North China Plain. Atmos. Chem. Phys., 11:3479–3494.
- Lopez-Yglesias, X. F., Yeung, M. C., Dey, S. E., Brechtel, F. J., and Chan, C. K. (2014). Performance Evaluation of the Brechtel Mfg. Humidified Tandem Differential Mobility Analyzer (BMI HTDMA) for Studying Hygroscopic Properties of Aerosol Particles. Aerosol Sci. Technol., 48:969–980.
- Malm, W. C., Day, D. E., Kreidenweis, S. M., Collett, J. L., and Lee, T. (2003). Humidity-Dependent Optical Properties of Fine Particles during the Big Bend Regional Aerosol and Visibility Observational Study. J. Geophys. Res.-Atmos., 108:16.
- Marcolli, C., and Krieger, U. K. (2006). Phase Changes during Hygroscopic Cycles of Mixed Organic/Inorganic Model Systems of Tropospheric Aerosols. J. Phys. Chem. A, 110:1881–1893.
- Marcolli, C., Luo, B. P., and Peter, T. (2004). Mixing of the Organic Aerosol Fractions: Liquids as the Thermodynamically Stable Phases. J. Phys. Chem. A, 108:2216–2224.
- Martin, S. T. (2000). Phase Transitions of Aqueous Atmospheric Particles. Chem. Rev., 100:3403–3453.
- Massling, A., Stock, M., Wehner, B., Wu, Z. J., Hu, M., Bruggemann, E., Gnauk, T., Herrmann, H., and Wiedensohler, A. (2009). Size Segregated Water Uptake of the Urban Submicrometer Aerosol in Beijing. Atmos. Environ., 43:1578–1589.
- Massoli, P., Lambe, A. T., Ahern, A. T., Williams, L. R., Ehn, M., Mikkila, J., Canagaratna, M. R., Brune, W. H., Onasch, T. B., Jayne, J. T., Petaja, T., Kulmala, M., Laaksonen, A., Kolb, C. E., Davidovits, P., and Worsnop, D. R. (2010). Relationship between Aerosol Oxidation Level and Hygroscopic Properties of Laboratory Generated Secondary Organic Aerosol (SOA) Particles. Geophys. Res. Lett. 37:5.
- McMurry, P. H., Litchy, M., Huang, P.-F., Cai, X., Turpin, B. J., Dick, W. D., and Hanson, A. (1996). Elemental Composition and Morphology of Individual Particles Separated by Size and Hygroscopicity with the TDMA. Atmos. Environ., 30:101–108.
- Meng, J. W., Yeung, M. C., Li, Y. J., Lee, B. Y. L., and Chan, C. K. (2014). Size-Resolved Cloud Condensation Nuclei (CCN) Activity and Closure Analysis at the HKUST Supersite in Hong Kong. Atmos. Chem. Phys., 14:10267–10282.
- Meyer, N. K., Duplissy, J., Gysel, M., Metzger, A., Dommen, J., Weingartner, E., Alfarra, M. R., Prevot, A. S. H., Fletcher, C., Good, N., McFiggans, G., Jonsson, Å. M., Hallquist, M., Baltensperger, U., and Ristovski, Z. D. (2009). Analysis of the Hygroscopic and Volatile Properties of Ammonium Sulphate Seeded and Unseeded SOA Particles. Atmos. Chem. Phys., 9:721–732.
- Moore, R. H., and Raymond, T. M. (2008). HTDMA Analysis of Multicomponent Dicarboxylic Acid Aerosols with Comparison to UNIFAC and ZSR. J. Geophys. Res.-Atmos., 113:15.
- Penner, J. E., Andreae, M., Annegarn, H., Barrie, L., Feichter, J., Hegg, D., Jayaraman, A., Leaitch, R., Murphy, D., Nganga, J., and Pitari, G. (2001). Aerosols, their Direct and Indirect Effects, in Climate Change 2001: The Scientific Basis. Contribution of Working Group I to the Third Assessment Report of the Intergovernmental Panel on Climate Change, J. T. Houghton, Y. Ding, D. J. Griggs, M. Noguer, P. J. van der Linden, X. Dai, K. Maskell, and C. A. Johnson, eds., Cambridge University Press, Cambridge/New York, pp. 289–348.
- Petters, M. D., and Kreidenweis, S. M. (2007). A Single Parameter Representation of Hygroscopic Growth and Cloud Condensation Nucleus Activity. Atmos. Chem. Phys., 7:1961–1971.
- Santarpia, J. L., Gasparini, R., Li, R. J., Collins, D. R. (2005). Diurnal Variations in the Hygroscopic Growth Cycles of Ambient Aerosol Populations. J. Geophys. Res.-Atmos., 110:12.
- Santarpia, J. L., Li, R. J., and Collins, D. R. (2004). Direct Measurement of the Hydration State of Ambient Aerosol Populations. J. Geophys. Res.-Atmos., 109:16.
- Stock, M., Cheng, Y. F., Birmili, W., Massling, A., Wehner, B., Muller, T., Leinert, S., Kalivitis, N., Mihalopoulos, N., Wiedensohler, A. (2011). Hygroscopic Properties of Atmospheric Aerosol Particles Over the Eastern Mediterranean: Implications for Regional Direct Radiative Forcing under Clean and Polluted Conditions. Atmos. Chem. Phys., 11:4251–4271.
- Stokes, R. H., and Robinson, R. A. (1966). Interactions in Aqueous Nonelectrolyte Solutions. I. Solute-Solvent Equilibria. J. Phys. Chem., 70:2126–2131.
- Swietlicki, E., Hansson, H. C., Hameri, K., Svenningsson, B., Massling, A., McFiggans, G., McMurry, P. H., Petaja, T., Tunved, P., Gysel, M., Topping, D., Weingartner, E., Baltensperger, U., Rissler, J., Wiedensohler, A., and Kulmala, M. (2008). Hygroscopic Properties of Submicrometer Atmospheric Aerosol Particles Measured with H-TDMA Instruments in Various Environments – A Review. Tellus Ser. B-Chem. Phys. Meteorol. 60:432–469.
- Tan, H. B., Yin, Y., Gu, X. S., Li, F., Chan, P. W., Xu, H. B., Deng, X. J., Wan, Q. L. (2013). An Observational Study of the Hygroscopic Properties of Aerosols Over the Pearl River Delta Region. Atmos. Environ., 77:817–826.
- Taylor, N. F., Collins, D. R., Spencer, C. W., Lowenthal, D. H., Zielinska, B., Samburova, V., and Kumar, N. (2011). Measurement of Ambient Aerosol Hydration State at Great Smoky Mountains National Park in the Southeastern United States. Atmos. Chem. Phys., 11:12085–12107.
- Topping, D. O., McFiggans, G. B., and Coe, H. (2005). A Curved Multi-Component Aerosol Hygroscopicity Model Framework: Part 1 – Inorganic Compounds. Atmos. Chem. Phys., 5:1205–1222.
- Wu, D. W., Fung, J. C. H., Yao, T., and Lau, A. K. H. (2013). A Study of Control Policy in the Pearl River Delta Region by Using the Particulate Matter Source Apportionment Method. Atmos. Environ., 76:147–161.
- Ye, X. N., Tang, C., Yin, Z., Chen, J. M., Ma, Z., Kong, L. D., Yang, X., Gao, W., and Geng, F. H. (2013). Hygroscopic Growth of Urban Aerosol Particles during the 2009 Mirage-Shanghai Campaign. Atmos. Environ., 64:263–269.
- Yeung, M. C., and Chan, C. K. (2010). Water Content and Phase Transitions in Particles of Inorganic and Organic Species and Their Mixtures Using Micro-Raman Spectroscopy. Aerosol Sci. Technol., 44:269–280.
- Yeung, M. C., Lee, B. P., Li, Y. J., and Chan, C. K. (2014). Simultaneous HTDMA and HR-ToF-AMS Measurements at the HKUST Supersite in Hong Kong in 2011. J. Geophys. Res.: Atmos., 119:2013JD021146.
- Zdanovskii, A. (1948). New Methods for Calculating Solubilities of Electrolytes in Multicomponent Systems. Zhur. Fiz. Khim., 22:1475–1485.