
Abstract
A method of the continual generation of lead or lead oxide nanoparticles for potential subsequent inhalation experiments with laboratory animals was investigated. We examined the thermal decomposition and oxidation of lead bis(2,2,6,6-tetramethyl-3,5-heptanedionate) in an externally heated tube reactor as well as the evaporation and condensation of metallic lead. The particle production dependence on experimental conditions was investigated using a scanning mobility particle sizer (SMPS), and the particle characteristics were studied using transmission electron microscopy (TEM), high-resolution TEM (HRTEM), scanning electron microscopy (SEM), energy dispersive spectroscopy (EDS), atomic absorption spectroscopy (AAS), elemental and organic carbon analysis (EC/OC), X-ray photoelectron spectrometry (XPS), and X-ray diffraction (XRD) methods. The evaporation/condensation was evaluated as being the most suitable for inhalation experiments due to its simplicity, high production rate, and the well-defined composition of the nanoparticles.
Copyright 2015 American Association for Aerosol Research
1. INTRODUCTION
Nanoparticles (NPs) in the environment may have a significant effect on living beings. When inhaled, these particles enter the respiratory system and may cause adverse health effects. However, real data on the effect of NPs’ inhalation except for silica, titania, carbon, and silver are still rather rare, (Večeřa et al. Citation2011). Recently, an inhalation chamber for research of the translocation of NPs in the organs of laboratory animals was constructed at the Institute of Analytical Chemistry of the CAS, v.v.i. (Večeřa et al. Citation2011), and a preliminary study of the allocation of MnOx nanoparticles in the organs of laboratory animals in the inhalation chamber was presented by Večeřa et al. (Citation2012). For these experiments, a continual generation of nanoparticles for a duration of days or even weeks and in sufficiently high number concentration with an appropriate particle size distribution and well-defined composition is necessary. NPs of lead and lead oxide are interesting materials for the above-mentioned inhalation experiments because these materials are frequently emitted in the environment by technological processes, such as those used in sintering plants (Oravisjärvi et al. Citation2003), lead smelters (Sobanska et al. Citation1999), and electric steel plants (Sammut et al. Citation2010).
Because NPs of lead and lead oxide are attractive materials for potential applications in superconductors, photonic crystals, and as anodes in lithium-ion batteries, various methods for their synthesis have been presented in the literature. Lead NPs were synthesized using a surfactant-assisted solution dispersion method by Zhao et al. (Citation2004) and a rapid injection of aqueous solution of lead acetate into an aqueous solution of sodium borohydride (Lee et al. Citation2009). The synthesis of lead oxide particles using a sonochemical method was presented by Karami et al. (Citation2008), and a wet-chemistry method was also used by Aladar et al. (Citation2012) and Pan et al. (Citation2009). Micron-sized hexagonal and flower-like nanostructures of lead oxide PbO2 were synthesized by anodic oxidation of lead (Singh and Shrivastava Citation2011). In the gas phase, lead oxide PbO nanostructured materials were prepared by spraying of aqueous solutions of Pb(NO3)2 (Konstantinov et al. Citation2006) or (CH3COO)2Pb (Martos et al. Citation2001). However, neither wet-chemistry method nor the liquid flame spray method is applicable for long-lasting inhalation experiments.
In the gas phase, thin films of lead titanate (PbTiO3, Hendricks et al. Citation1994) or lead zirconate titanate (Pb(ZrTi)O3, Chen et al. Citation1999; Jones et al. Citation1999) or thin films of (PbLa)TiO3 (Shin et al. Citation1998) were deposited by metal organic chemical vapor deposition (MOCVD) using lead bis(2,2,6,6-tetramethyl-3,5-heptanedionate) (PbTHD2) as a precursor for lead oxide formation. Because some other lead precursors reported in the literature, such as tetraethyllead, Pb(C2H5)4, (Okada et al. Citation1989) or triethyllead tert-butoxide, Pb(C2H5)3(OtC4H9) (Dormans et al. Citation1993), are not commercially available, we decided to test the suitability of the PbTHD2 precursor for the long-lasting generation of nanoparticles of Pb or PbOx by thermal decomposition and/or oxidation in a hot wall reactor (MOCVD method). The method of generation of NPs from β-diketonate compounds is not novel. It was already used for generation of, e.g., Cu/Cu2O/CuO NPs using copper(II) acetylacetonate (Nasibulin et al. Citation2005). As an alternative route, the generation of the lead NPs from metallic Pb by evaporation/condensation (E/C) method can be taken into account. This method, also called physical vapor deposition (PVD) method, is well known for the generation of NPs of noble metals as silver (Scheibel and Porstendörfer Citation1983; Jung et al. Citation2006), gold (Magnusson et al. Citation1999), palladium (Peineke et al. Citation2006), and some other materials, e.g., NaCl (Scheibel and Porstendörfer Citation1983). However, generation of lead NPs by this method, as far as we know, was not yet reported. Even though the melting point of lead is quite low (327°C), the evaporation temperature necessary for NPs’ production by this method exceeds 800°C. The question arises concerning the thermal stability of lead in a nitrogen atmosphere at these temperatures that is essential for long-term exposure experiments. It should be verified experimentally and therefore the generation of the lead NPs by E/C method was also tested.
2. EXPERIMENTAL
2.1. Methods
Three methods of NPs’ generation were tested:
thermal decomposition of PbTHD2 in an inert atmosphere (pyrolysis),
thermal decomposition of PbTHD2 in oxidizing atmosphere of 5–12 vol. % O2 (oxidation), and
evaporation/condensation (E/C) of metallic Pb in an inert atmosphere.
The scheme of the inlet section arrangements of these methods is shown in .
FIG. 1. Scheme of arrangements of the reactor inlet section.
PbTHD2 from Strem Chemicals, Inc. (product No. 82-2100, CAS No. 21319-43-7; Strem Chemicals, Inc., Kehl, Germany) is a white powder at normal temperature with a melting point of 126–128°C and is reported to be a desirable metalorganic lead source offering volatility and the ability to produce contamination-free films (Hendricks et al. Citation1994). Nevertheless, Strem Chemicals materials safety data sheet reports it as harmful by inhalation or if swallowed, so careful handling is necessary. Thermogravimetric analysis revealed that evaporation of the sample is complete at 300°C with almost negligible non-volatile residuum (Chen et al. Citation1999). The vapor pressure of the solid PbTHD2 (PPbTHD2) was calculated based on the experimental data of Krisyuk et al. (Citation1998) using the equation[1] which is valid in the range from 100 to 128°C, i.e., for the precursor in the solid state. The vapor pressure of metallic Pb (PPb) was calculated from the data of Frurip and Bauer (Citation1977) using the equation
[2]
The dependence of the particle production on the reactor temperature (TR), precursor vapor pressure (PPbTHD2 or PPb), reactor flow rate (QR), and oxygen concentration (cO) was investigated.
2.2. Apparatus
The experiments were performed using the apparatus shown in . Particles were synthesized in an externally heated tube flow reactor with an i.d. of 25 mm and a 1-m-long heated zone. The total length of the work tube was 1.5 m. The input section of the work tube was used as an externally heated saturator (sublimator), and the back part flowed directly into diluter. In the E/C arrangement, the saturator was empty, and the boat with lead wire was inserted directly into the heated zone of the work tube at approximately 2/3 of axial coordinate. The purification unit, used for removal of impurities from the carrier gas, consisted of a deoxidizing column and two drying columns. The deoxidizing column (1) was filled with 5 × 5 mm pellets of Cu catalyst R3-11 (BASF). The first drying column (2) was filled with the molecular sieve Dusimo S5 Å, and the second drying column (2) was filled with magnesium perchlorate 99% (Fluka 63102). Deoxygenated (1), dry (2), and particle free nitrogen (F) was saturated by the precursor vapor in the saturator (S) and fed axially into the reactor, where it was diluted either by a stream of pure nitrogen (pyrolysis, E/C), or by a mixture of nitrogen and air (oxidation) and fed into the reactor through a central nozzle. The mixture of gas and particles leaving the reactor was cooled in a diluter (D) by mixing it with an additional stream of nitrogen. Typically, the flow rate of diluting nitrogen was twice as high as QR. The flow rates of the individual gas streams were controlled using electronic mass flow meters (Aalborg GFCS), and the temperatures of the saturator and the reactor were controlled using electronic controllers (RLC T48 and Technologic THP 94).
FIG. 2. Scheme of the apparatus: (1) deoxygenator, (2) dryer, (CV) control valve, (D) diluter, (F) filter, (M) electronic mass flow meter, (N) aerosol neutralizer Am241, (P) pressure reducing valve, (S) saturator, (SF) sampling filter, and (VP) vacuum pump.
2.3. Data Acquisition
The particle production was monitored using a scanning mobility particle sizer (SMPS, TSI model 3936L75), consisting of DMA model 3081 (long DMA) and CPC model 3775, and the samples for particle characterization were deposited onto TEM grids using a nanometer aerosol sampler (NAS, TSI model 3089) and on PTFE, Zefluor, quartz, and Sterlitech Ag filters. The particle characteristics were studied using transmission/scanning electron microscopy (TEM, JEOL 2000FX/SEM, TESCAN INDUSEM, samples on TEM grids or Ag filters), high-resolution TEM (HRTEM, JEOL 3010, TEM grids), energy dispersive spectroscopy (EDS, Bruker Quantax, TEM grids or Ag filters), atomic absorption spectroscopy (AAS, Avanta Sigma, PTFE filters), elemental and organic carbon analysis (EC/OC, Model 4, Sunset Laboratory, quartz filters), X-ray diffraction (XRD, Philips X’Pert diffractometer PW3020, Ag filters), and X-ray photoelectron spectrometry (XPS, ADES-400, VG Scientific, Ag or Zefluor filters).
3. RESULTS AND DISCUSSION
3.1. Particle Production
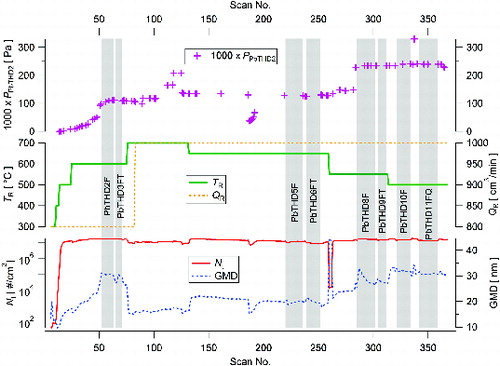
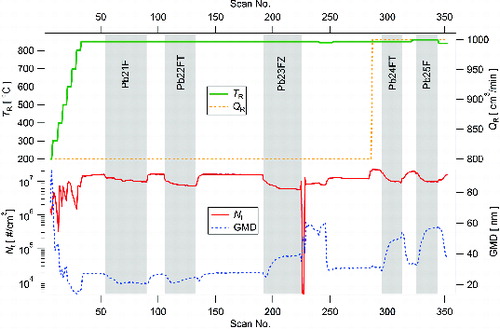
Four experiments with a total duration of 113 h were completed for the generation of NPs by the thermal decomposition of PbTHD2. An example of the time dependence of particle production in the form of the total number concentration (Nt) and geometric mean diameter (GMD) at various experimental conditions is shown in . In this figure, the data are plotted as they were collected by SMPS, including start-up period, technological events (replacement of pressure nitrogen gas cylinder – scans 186 and following), and switching the sampling on the air from the laboratory (scans 260–262). Values of PPbTHD2 in the reactor were calculated from EquationEquation (1)[1] on the basis of TS multiplied by the dilution ratio QS/QR at the inlet section of the reactor. Because the temperature sensor in the saturator (TS) had rather slow time response, the generation of NPs seems to be ahead of the time dependence of PPbTHD2 during start-up period. The generation of particles by the thermal decomposition of PbTHD2 is stable at TR from 500 to 600°C; see . Above 600°C, the NPs’ concentration decreases most likely due to deposition on the reactor wall. The NPs’ production generally increases with the precursor concentration (PPbTHD2), i.e., with increasing saturator flow rate (QS) and/or saturator temperature (TS). Particle size distributions of scans 130, 218, 274, and 300 are plotted in Figure S1 in the online supplemental information (SI).
FIG. 3. Time dependence of number concentration (Nt) and geometric mean diameter (GMD) of NPs generated by pyrolysis of PbTHD2 at given experimental conditions: 1 scan = 5 min, vertical gray bars highlight sampling periods, F denotes Ag filter, FT denotes PTFE filter, and FQ denotes quartz filter.
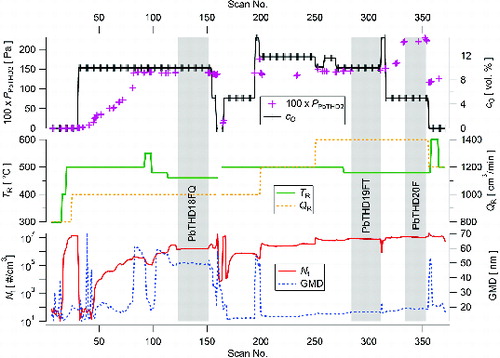
In an oxidizing atmosphere, we performed one experiment with a length of 31 h and the particle production is shown in . In start-up period, NPs’ production seems to be ahead of increasing PPbTHD2 due to the slow response of the temperature sensor in the saturator TS (similarly as in ). At the beginning, carrier gas in the reactor consisted of pure nitrogen so that NPs were produced by pyrolysis and Nt increased quite rapidly above 1 107 #/cm3. After introducing air into the reaction mixture at scan 30, Nt suddenly dropped in several orders of magnitude. Gradual increase of precursor concentration PPbTHD2(TS, QS) has led to the achievement of Nt > 1
106 #/cm3. An increase of TR resulted in significant decrease of both Nt and GMD (scans 93–98). Replacement of nitrogen gas cylinder was performed at scans 161–164, during which the heating of furnaces was switched off and SMPS sampled an air from the laboratory. After restoring steady-state conditions and NPs’ production, gradual increase of QR from 1000 to 1400 cm3/min and PPbTHD2 from 1.36 to 2.22 Pa resulted in an increase of Nt from 1.6
105 to 1.1
107 #/cm3. Particle size distributions of scans 190, 230, 268, and 354 are plotted in Figure S2 (see the SI). At the end of the experiment, cO was again set to zero, so that NPs were produced by pyrolysis. During the experiment and the whole set of experimental conditions tested, the maximum number concentration of generated particles hardly exceeded the level of 1
107 #/cm3; see . Moreover, quite small changes in experimental conditions sometimes caused the overturning of monomodal size distribution of generated NPs with GMD < 20 nm to bimodal with GMD > 50 nm and conversely. A further increase of the number concentration of NPs can apparently be achieved by further increasing QR and/or by increasing the saturator temperature above the melting point of PbTHD2. To achieve this increase, a different design of the saturator is necessary.
FIG. 4. Time dependence of Nt and GMD of NPs generated by oxidation of PbTHD2 at given experimental conditions: 1 scan = 5 min, vertical gray bars highlight sampling periods, F denotes Ag filter, FT denotes PTFE filter, and FQ denotes quartz filter.
NPs’ production using the evaporation/condensation method was also investigated during one measurement cycle of approximately 30 h. The particle production runs stably and with a sufficiently high number concentration greater than 1.5 107 #/cm3 in most of the investigated experimental conditions (range of TR from 830 to 860°C, QR from 800 to 1000 cm3/min), as observed in . Replacement of nitrogen gas cylinder was carried out at scan 226, during which air from laboratory was sampled by SMPS. When restarting the flow rates, the dilution ratio in the diluter was set (by mistake) 1:1. This resulted in lower Nt and higher GMD during series of scans 227–246. The NPs’ production can be controlled (to some extent) with QR and with the temperature of precursor evaporation (TR). Some variation of Nt and GMD (typically in the opposite direction) was caused by sampling on filters; however, after the sampling period, the NPs’ production returned to the level before sampling; see . Particle size distributions of scans 190, 293, and 323 are shown in Figure S3 (see the SI).
FIG. 5. Time dependence of Nt and GMD of NPs generated by E/C of metallic Pb at given TR and QR: 1 scan = 5 min, vertical gray bars highlight sampling periods, F denotes Ag filter, FT denotes PTFE filter, and FZ denotes Zefluor filter.
It should be noted that data collected by SMPS (Nt, GMD) involves not only the process of particle formation in the reactor (work tube) but also processes of particle losses due to thermophoresis, diffusiophoresis, and agglomeration in the outer part of the work tube, diluter, and tubing between the diluter and SMPS inlet.
3.2. Particle Characteristics
3.2.1. Morphology
The morphology of the NPs was investigated by TEM and SEM. The particles prepared by pyrolysis of PbTHD2 were typically spherical and usually agglomerated into clusters. The primary particle size of the NPs synthesized at TR = 500°C was between 5 and 10 nm; see . At TR = 650°C, the NPs were larger and more polydisperse, with primary particle sizes varying between 6 and 17 nm, as observed in . More details of morphology can be seen in Figures S4 and S5 (see the SI). From the TEM images in and , it is apparent that the size of the primary particles is much smaller than the GMD detected by SMPS, see , which indicates that particles are already agglomerated into clusters at the SMPS inlet. The NPs prepared by the oxidation of PbTHD2 and by E/C of Pb have similar morphologies, as observed in the SEM images in and (beware of different magnifications). The particles are agglomerated into clusters and chains, and the main difference is the much higher amount of deposit for the E/C method due to the much higher particle production. More detailed information about morphology of NPs prepared by E/C can be seen in Figure S6 (see the SI).
FIG. 6. TEM image and EDS spectrum of the sample of NPs synthesized by pyrolysis of PbTHD2 at TR = 500°C, QR = 1100 cm3/min, and PPbTHD2 = 0.21 Pa.
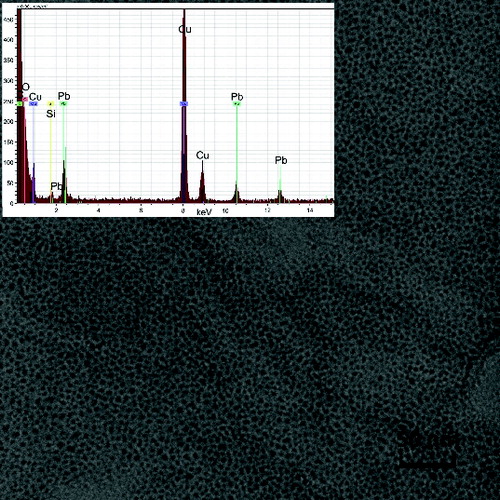
FIG. 7. TEM image and EDS spectrum of the sample of NPs synthesized by pyrolysis of PbTHD2 at TR = 650°C, QR = 1000 cm3/min, and PPbTHD2 = 0.13 Pa.
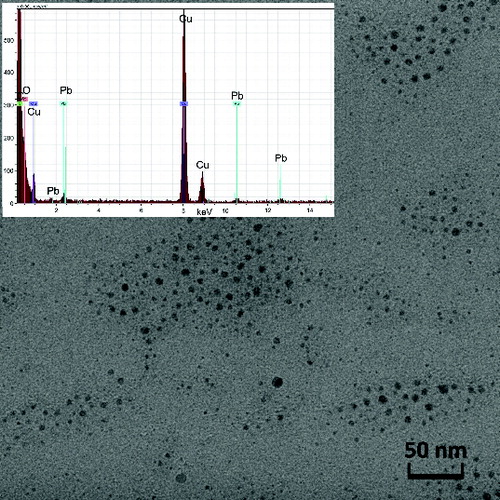
FIG. 8. SEM image and EDS spectrum of the sample of NPs synthesized by oxidation of PbTHD2 at TR = 480°C, QR = 1400 cm3/min, PPbTHD2 = 2.20 Pa, and cO = 5 vol. %.
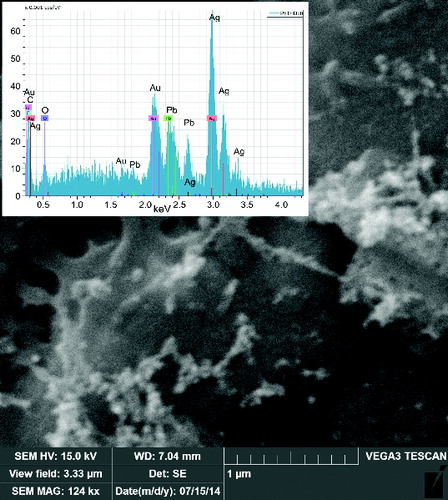
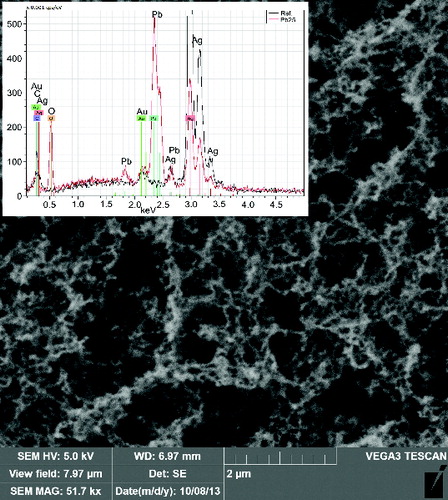
FIG. 9. SEM image and EDS spectrum of the sample of NPs synthesized by E/C of metallic Pb at TR = 860°C and QR = 1000 cm3/min.
3.2.2. Composition
The composition of the NPs’ samples was determined using EDS and AAS as well as XPS and XRD methods. EDS analysis connected to TEM confirmed the presence of lead and oxygen in the samples, see and , while the detected carbon can originate from both the TEM grids and the samples. The copper detected is from the grids, and the Si originates from the EDS detector. Similarly, EDS attached to SEM confirmed the presence of lead, oxygen, and some amount of carbon, see and ; the other elements, such as silver and gold, are from Sterlitech Ag filters and sputtering the samples prior to analysis, respectively.
The overall content of lead in the samples was estimated by AAS analysis. The results are presented in . In the samples prepared by pyrolysis, the content of lead varies between 45.7 and 60.6 weight %. Although the samples were prepared under various experimental conditions (TR between 500 and 600°C, PPbTHD2 between 0.11 and 0.24 Pa), the dispersion of the data may also be caused by the small weight of samples PbTHD3FT and PbTHD9FT; therefore, we consider the lead content in the samples PbTHD10FT and PbTHD13FT of 53.6 and 51.5 weight % to be the most reliable. Even though the impact of AAS analyses is limited due to small number of samples, relatively low lead content in the samples prepared by pyrolysis shows on incomplete decomposition of precursor by this method. The lead content in sample PbTHD19FT prepared by the oxidation of PbTHD2 was 83.6%; the lead contents in the samples prepared by E/C of Pb were 79.4 (Pb22FT) and 79.7 (Pb24FT). Because we expect the formation of pure lead NPs by E/C of lead, the lead content detected in the samples prepared by E/C indicates that the composition of NPs changed in the period between synthesis and analysis and some other elements have to be present in (the surface layer of) NPs.
TABLE 1 Experimental conditions of sample preparation and results of AAS analyses
NPs and/or thin films prepared from metal organic precursors are frequently contaminated by carbon. Therefore, we analyzed the carbon content in the samples by EC/OC method, and a EUSAAR2 temperature protocol (Cavalli et al. Citation2010) was used for the analyses. The problem of this method is that the samples must be deposited on quartz filters (carbon free), which are very brittle and difficult to weigh, especially after sampling, because some amount of the filter mass, more or less negligible, remains in the filter holder, and therefore, the weight of the sample is more or less underestimated. Nevertheless, EC/OC analysis showed that the content of EC was negligible in all the samples. The amount of OC was approximately 22 weight % in the samples prepared by pyrolysis and 3% in those prepared by oxidation. These values were corrected by the OC concentrations on the blank filter. Because we did not expect the formation of either EC or OC by the E/C of metallic Pb, EC/OC analyses of the samples prepared by E/C were not performed.
XPS analysis of the surface layer of the NPs revealed that lead in the samples synthesized by all three investigated methods is present in Pb-O bonds, which indicates that the surface layer of the NPs is oxidized by oxygen from the atmosphere.
3.2.3. Crystallinity
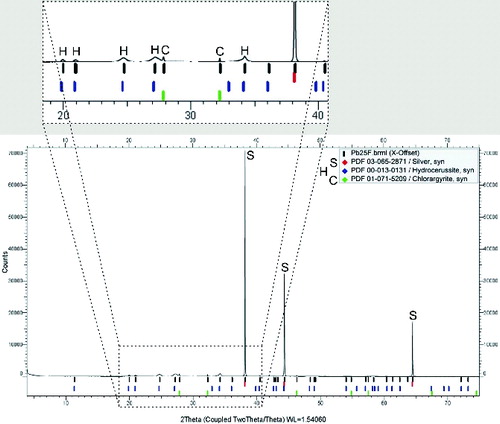
The crystalline structure of the samples of synthesized NPs was studied by XRD. All the examined samples of NPs prepared by pyrolysis and oxidation of PbTHD2 were observed to be XRD amorphous due to the small primary particle size and/or insufficient amount of mass in the samples, from 50 to 250 μg. However, HRTEM analysis of the samples prepared by pyrolysis showed that NPs are not completely amorphous. Selected area electron diffraction (SAED) pattern of NPs prepared at TR = 500°C consists of weak diffusion rings, which can be most likely fitted with diffraction of monoclinic Pb2O3; see Figure S4 (see the SI). SAED pattern of NPs prepared at TR = 650°C consists of even weaker diffusion rings, see Figure S5a (see the SI), therefore its identification is hardly possible. Analysis of interplanar spacings of single crystallite showed presence of cubic lead; see Figure S5b (see the SI). The XRD analysis of the sample Pb25F prepared by the E/C of metallic Pb resulted in a rhombohedral diffraction pattern of hydrocerussite (Pb3(CO3)2(OH)2; PDF 0131); see . XRD analysis was performed with a time-lag of approximately three weeks after sample preparation, and the diffraction pattern indicates that lead NPs are not long-term stable in the atmosphere and react with oxygen, CO2, and water. In direct toxicity studies mean residence time of inhaled air in cages is approximately 15 min, so we can expect much less impact of the atmosphere on the composition of lead NPs, but it is difficult to quantify it precisely. The results of XRD analysis were confirmed and somewhat extended by SAED; see Figure S6 (see the SI).
FIG. 10. XRD pattern of the sample Pb25F synthesized by E/C of metallic Pb at TR = 860°C and QR = 1000 cm3/min.
4. CONCLUSIONS
From the three tested methods of NPs’ generation, the evaporation/condensation of metallic Pb appears to be the most suitable for long-lasting inhalation experiments. The method of particle preparation is very simple: the mechanism of NPs’ formation is unambiguous and NPs can be easily produced with a sufficiently high number concentration and well-defined composition for a long period. Nevertheless, the composition of NPs can change, at least on the surface layer, during the time-lag between their formation and inhalation.
The thermal decomposition of PbTHD2 can produce a sufficiently high concentration of NPs; however, there is some uncertainty about their composition. The average content of lead in the samples was approximately 53 weight %, and the content of OC in the NPs was 22%. Because no EC was present in the NPs (this follows from the EC/OC analysis), the condensation of some non-volatile products of PbTHD2 decomposition on the NPs is expected; Smith et al. (Citation1976).
The oxidation of PbTHD2 produces carbon-free NPs; however, their number concentration is somewhat low for the application of this method in inhalation experiments.
SUPPLEMENTAL MATERIAL
Supplemental data for this article can be accessed on the publisher's website
AST_Moravec_SuplementalInfo.zip
Download Zip (1.6 MB)ACKNOWLEDGMENTS
TEM/EDS analyses were performed by Doc. Bohumil Smola, Faculty of Mathematics and Physics, Charles University; the HRTEM analyses by Jaroslav Kupčík, Institute of Inorganic Chemistry CAS, v.v.i.; the XPS analyses were performed by Dr. Josef Zemek, Institute of Physics CAS, v.v.i.; the AAS analyses were performed by Ludmila Soukupová, Institute of Chemical Process Fundamentals CAS, v.v.i.; and the XRD analyses were performed by Dr. Roman Skála, Geological Institute CAS, v.v.i.
Funding
This work was supported by the Czech Science Foundation under grant No. P503/11/2315.
REFERENCES
- Aladar, M., Theivasanthi, T., and Kubera Raja, A. (2012). Chemical Synthesis of Nano-Sized Particles of Lead Oxide and Their Characterization Studies. J. Appl. Sci., 12:398–401.
- Cavalli, F., Viana, M., Yttri, K. E., Genberg, J., and Putaud, J.-P. (2010). Toward a Standardized Thermal-Optical Protocol for Measuring Atmospheric Organic and Elemental Carbon: The EUSAAR Protocol. Atmos. Meas. Tech., 3:79–89.
- Chen, I.-S., Roeder, J. F., Glassman, T. E., and Baum, T. H. (1999). Liquid Delivery MOCVD of Niobium-Doped Pb(ZrTi)O3 Using a Novel Niobium Precursor. Chem. Mater., 11:209–212.
- Dormans, G. J. M., de Keiser, M., van Veldhoven, P. J., Frigo, D. M., Holewijn, J. E., van Mier, G. P. M., and Smit, C. J. (1993). Triethyllead tert-butoxide, a New Precursor for Organometallic Chemical Vapor Deposition of Lead Zirconate Titanate Thin Films. Chem. Mater., 5:448–451.
- Frurip, D. J., and Bauer, S. H. (1977). Homogeneous Nucleation in Metal Vapors. 3. Temperature Dependence of the Critical Supersaturation Ratio for Iron, Lead and Bismuth. J. Phys. Chem., 81:1001–1006.
- Hendricks, W. C., Desu, S. B., and Peng, C. H. (1994). Metalorganic Chemical Vapor Deposition of Lead Titanate. Chem. Mater., 6:1955–1960.
- Jones, A. C., Leedham, T. J., Writh, P. J., Williams, D. J., Crosbie, M. J., Davies, H. O., Fleeting, K. A., and O'Brien, P. (1999). Metalorganic Chemical Vapour Deposition (MOCVD) of Zirconia and Lead Zirconate Titanate Using a Novel Zirconium Precursor. J. Eur. Ceram. Soc., 19:1431–1434.
- Jung, J. H., Oh, H. C., Noh, H. S., Ji, J. H., and Kim, S. S. (2006). Metal Nanoparticle Generation Using a Small Ceramic Heater with a Local Heating Area. J. Aerosol. Sci., 37:1662–1670.
- Karami, H., Karimi, M. A., Haghdar, S., Sadeghi, A., Mir-Ghasemi, R., and Mahdi-Khami, S. (2008). Synthesis of Lead Oxide Nanoparticles by Sonochemical Method and Its Application as Cathode and Anode of Lead-Acid Batteries. Mater. Chem. Phys., 108:337–344.
- Konstantinov, K., Ng, S. H., Wang, J. Z., Wang, G. X., Wexler, D., and Liu, H. K. (2006). Nanostructured PbO Materials Obtained in Situ by Spray Solution Technique for Li-Ion Batteries. J. Power Sources, 159:241–244.
- Krisyuk, V. V., Turgambaeva, A. E., and Igumenov, I. K. (1998). Volatile Lead β-Diketonates as CVD Precursors. Chem. Vapor Dep., 4:43–46.
- Lee, G., Choi, S.-I., Lee, Y. H., and Park, J. T. (2009). One-Pot Syntheses of Metallic Nanoparticles of Tin and Lead. Bull. Korean Chem. Soc., 30:1135–1138.
- Magnusson, M. H., Deppert, K., Malm, J.-O., Bovin, J.-O., and Samuelson, L. (1999). Gold Nanoparticles: Production, Reshaping, and Thermal Charging. J. Nanoparticle Res., 1:243–251.
- Martos, M., Morales, J., Sánchez, L., Ayouchi, R., Leinen, D., Martin, F., and Ramos Barrado, R. J. (2001). Electrochemical Properties of Lead Oxide Films Obtained by Spray Pyrolysis as Negative Electrodes for Lithium Secondary Batteries. Electrochim. Acta, 46:2939–2948.
- Nasibulin, A. G., Shurygina, L. I., and Kaupinen, E. I. (2005). Synthesis of Nanoparticles Using Vapor-Phase Decomposition of Copper(II) Acetylacetonate. Colloid J., 67:5–25.
- Okada, M., Takai, S., Amemiya, M., and Tominaga, K. (1989). Preparation of c-Axis-Oriented PbTiO3 Thin Films by MOCVD under Reduced Pressure. Jpn. J. Appl. Phys., 28:1030–1034.
- Oravisjärvi, K., Timonen, K. L., Wiikinkoski, T., Ruuskanen, A. R., Heinänen, K., and Ruuskanen, J. (2003). Source Contributions to PM2.5 Particles in the Urban Air of a Town Situated Close to a Steel Works. Atmos. Environ., 37:1013–1022.
- Pan, Q., Wang, Z., Liu, J., Yin, G., and Gu, M. (2009). PbO@C Core Shell Nanocomposites as an Anode Material of Lithium-Ion Batteries. Electrochem. Commun., 11:917–920.
- Peineke, C., Attoui, M. B., and Schmidt-Ott, A. (2006). Using a Glowing Wire Generator for Production of Charged, Uniformly Sized Nanoparticles at High Concentrations. J. Aerosol Sci., 37:1651–1661.
- Sammut, M. L., Noack, Y., Rose, J., Hazemann, J. L., Proux, O., Depoux, M., Ziebel, A., and Fiani, E. (2010). Speciation of Cd and Pb in Dust Emitted from Sinter Plant. Chemosphere, 78:445–450.
- Scheibel, H. G., and Porstendörfer, J. (1983). Generation of Monodisperse Ag- and NaCl-Aerosols with Particle Diameters between 2 and 300 nm. J. Aerosol Sci., 14:113–126.
- Shin, J. C., Hong, S.-K., Lee, J. M., Cho, H. J., Kim, K. S., Hwang, C. S., and Kim, H. J. (1998). Preparation and Characterization of (Pb, La)TiO3 Thin Films by Solid Source Mixture Metal Organic Chemical Vapor Deposition. J. Korean Phys. Soc., 32: S1529–S1531.
- Singh, D. P., and Shrivastava, O. N. (2011). Synthesis of Micron-Sized Hexagonal and Flower-Like Nanostructures of Lead Oxide (PbO2) by Anodic Oxidation of Lead. Nano-Micro Lett., 3:223–227.
- Smith, J. D. B., Phillips, D. C., and Kaczmarek, T. D. (1976). The Microdetection of Particulates from Organometallic Compounds. Microchem. J., 21:424–437.
- Sobanska, S., Ricq, N., Laboudigue, A., Guillermo, R., Brémard, C., Laureyns, J., Merlin, J. C., and Wignacourt, J. P. (1999). Microchemical Investigations of Dust Emitted by a Lead Smelter. Environ. Sci. Technol., 33:1334–1339.
- Večeřa, Z., Mikuška, P., Moravec, P., and Smolík, J. (2011). Unique Exposure System for the Whole Body Inhalation Experiments with Small Animals. Paper Presented at the 3rd Nanocon International Conference, September 21–23, Brno, Czech Republic.
- Večeřa, Z., Mikuška, P., Moravec, P., and Smolík, J. (2012). The First Experience with New Exposure System for the Whole Body Inhalation Experiments with Small Animals. Paper Presented at the 4th Nanocon International Conference, October 23–25, Brno, Czech Republic.
- Zhao, Y., Zhang, Z., and Dang, H. (2004). Fabrication and Tribological Properties of Pb Nanoparticles. J. Nanoparticle Res., 6:47–51.