
Abstract
Filter media exhibit strong particle-size dependent capture characteristics that have a complicated dependence to filter properties and operating conditions. As simulation-based determination of the filtration characteristics of real media is very challenging, accurate experimental approaches are critically necessary. Conventionally, filter penetration measurements were made using test particles extracted from a differential mobility analyzer (DMA) and measuring the ratio of particle counts downstream of the filter to that upstream. Size-dependent filter penetration can be directly determined from these measurements if the DMA was operated at high resolution and the contribution of multiply charged particles was negligible. The accuracy of this well-established approach has, however, never been fully assessed. In this study, the influence of multiply charged particles to the filter efficiency measurements is determined using a system-modeling approach. The model results suggest that the contribution of multiply charged particles could significantly influence penetration results when the mode size of the test particles entering the DMA or the most penetrating particle size (MPPS) of the test filter are larger than ∼100 nm. Under such conditions, even if multiply charged particles constitute a small fraction of the test aerosol, they can significantly skew filter penetration results. For accurate calculation of filter penetration, two approaches are proposed: an improved filter test protocol and a new multiple-charge correction approach for calculation of size-dependent filter penetration from mobility-based measurements. The validity of the proposed approaches is established with experimental data.
Copyright 2015 American Association for Aerosol Research
1. INTRODUCTION
Filters are widely used for gas purification in a variety of fields, including electronics, automobile, industrial, etc. The appropriate selection of a filter media for use in a particular application requires consideration of its pressure drop and particle penetration characteristics. The pressure drop across a filter is a measure of the ease/difficulty of flow passage across it, while the filter penetration characteristics determine its ability to trap particles of different sizes. While accurate pressure drop measurements are relatively easy to make, filter penetration measurements are complicated by the strong particle-size dependence for most filter media.
Filter penetration measurements were initially made using near monodisperse particles that were generated using a combination of vaporization/condensation of particles obtained from an aerosol generator (Lee and Liu Citation1982). In these measurements, the solution concentrations were adjusted to vary the test aerosol population characteristics, particularly the mean size of the test particles. The simplicity of this setup has made it popular for filter penetration measurements, particularly in industry. With this approach, however, the test particle size distribution is not very narrow, e.g., the 200 nm particles generated with this approach have a geometric standard deviation ∼1.39. The ratio of the measured concentrations of these particles downstream and upstream of the filter will not directly provide accurate particle-size dependent filter penetration values.
Size-dependent penetration measurements are often made with test particles of a narrow range of mobilities generated using a differential mobility analyzer (DMA; Knutson and Whitby Citation1975). DMA-classified particles have been used for penetration measurements of a range of filter media (VanOsdell et al. Citation1990; Zhang and Liu Citation1992; Dhaniyala and Liu 1999) and for studying fundamental filter properties such as inhomogeneity (Dhaniyala and Liu Citation1999; Podgorski et al. Citation2011). Filter penetration measurements made using DMA-generated particles are accurate if the fraction of multiply charged particles in the mono-mobility particle population is negligible. To generate near monodisperse particles from the DMA, the particles entering the DMA should be mostly singly charged. This is possible if the test particles entering the DMA have a mode size smaller than ∼50 nm (He and Dhaniyala Citation2013). If the particles have a larger mode size, then the contribution of multiply charged particles in the DMA-classified population could be significant (He and Dhaniyala Citation2013). The influence of multiply charged particles to the filter penetration measurement has been completely ignored and there is no current knowledge of the penetration errors that result from this scenario.
This study is focused on understanding the extent of the problem associated with the presence of multiply charged problems on the measured filter penetrations. The penetration errors associated with multiply charged particles are established as a function of filter media and test particle characteristics. A multiple-charge correction for penetration calculation is introduced and a more practical approach for accurate penetration calculation is established.
2. FILTER PENETRATION CALCULATED WITH MOBILITY-CLASSIFIED PARTICLES
2.1. Filter Penetration Calculation
Size-dependent filter penetration measurements are often made using “monodisperse” particles obtained using a DMA. A typical filter test setup consists of a particle generator (e.g., atomizer, spark-generator, electrospray, etc.), charge conditioner, a particle mobility classifier (e.g., DMA), a filter holder where the test media is placed, and condensation particle counters (CPCs) upstream and downstream of the filter holder. The DMA classifies particles based on electrical-mobility, and when only singly charged particles are present then the particles from the DMA are monodisperse in size. The ratio of particle counts downstream of the test filter to that upstream will then represent filter penetration at a selected size. Tests with particles of different sizes extracted from the DMA will result in size-dependent penetration measurements of the test filter. Particles exiting the DMA are monodisperse in electrical mobility, but have a distribution of sizes due to multiple charging, which must be considered in the penetration calculation. Here, the relation between particle penetration and DMA operation is explicitly established and the role of particle charge characteristics and DMA operation is determined.
Consider particles with a size distribution, , passing through a charger where they acquire n charges with a size-dependent efficiency,
. As the particles pass through the DMA operated with a voltage V, they are classified based on the instrument transfer function
. The classified particles exiting the DMA are then counted by a CPC. The total particle concentration measured by the CPC (representing the total particle concentration upstream of the filter,
) in channel i corresponding to the voltage
can then be determined as (He and Dhaniyala Citation2013)
[1] where
and
are DMA aerosol and sample flowrates, respectively, and
and
are the size-dependent DMA penetration and CPC counting efficiency, respectively. When the DMA is operated at high resolution, only particles of a narrow mobility range are sampled out. Over this narrow mobility range, all terms within the integral can be assumed to be invariant except the transfer function. This reduces EquationEquation (1)
[1] to
[2] where
is the diameter of a particle with
charges and with an electrical mobility that corresponds to the mean classified mobility of particles in channel i,
is the mobility-diameter coefficient based on the particle diameter
, calculated as (He and Dhaniyala Citation2013)
[3] where
,
, and
are the coefficients of slip correction factors, which for air are 1.142, 0.558, and 0.999, respectively (Allen and Raabe Citation1985). The particle Knudsen number,
, is
[4] where
is the gas mean free path. The DMA flow parameters
and
are
[5]
[6] where
and
are the sheath and excess flowrates of the DMA, respectively. For simplicity, EquationEquation (2)
[2] can be re-written as
[7] where
, and
is a factor that determines the fraction of charged particles detected by the CPC downstream of the DMA considering the properties of the charger, DMA, and the CPC, i.e.,
[8]
Considering the presence of singly and multiply charged particles, the total concentration (EquationEquation (7)[7] ) can be written as
[9]
The number concentration of particles in channel i downstream of a filter can be determined considering the filter penetration characteristics. For a DMA operated at a high resolution, over the range of the non-zero transfer function, the filter penetration, , can be assumed to be independent of particle size. Then the total concentration downstream of the test filter can be expressed as
[10] where
is the penetration associated with the singly charged particles of diameter
, and
is the penetration associated with the multiply charged particles of diameters
. Then the filter penetration at a size
corresponding to the DMA voltage
can be calculated from Equations (9) and Equation(10)
[10] as
[11] where
is the ratio of total particle concentration downstream of the filter to that upstream,
[12] and
is the single-charge fraction factor representing the ratio of singly charged fraction downstream of the filter to that upstream,
[13]
Often, the particles are all assumed to be singly charged (i.e., F = 1) and the penetration at a selected size (P) is simply calculated as the ratio of the total particle concentrations downstream and upstream of the filter (i.e., P = P0). The validity of this assumption must be tested for typical test particle and filter properties.
2.2. Description of Particle Size Distribution and Filter Penetration
To determine the accuracy of the penetration calculated using the above equations, a generic description of filter penetration characteristics and test aerosol properties is required. In this study, the generated test aerosol will be assumed to be represented by a log-normal size distribution, , given as
[14] where
is total particle number concentration, and
and
are the geometric mean and standard deviation of the particle size distribution, respectively.
A generic description of the size-dependent filter penetration does not exist. To determine a distribution function that best represents typical filter media penetration curves, we obtained published filter penetration data for several different media (Vanosdell et al. Citation1990; Zhang and Liu Citation1992; CitationHe et al. in prep.). From analysis of the measured filter penetration curves of a selected few datasets (Figure S1 in the online supplemental information [SI]), it is determined that the size-dependent filter penetration (P) characteristics for these media could be represented by a modified log-normal function[15] where
is the most penetrating particle size (MPPS) of the filter or the mode size of the penetration curve,
is the geometric standard deviation of the size-dependent penetration, and
is a factor related to the filter penetration at MPPS and the width of penetration distribution and defined as
[16] where
is the filter penetration at MPPS. The validity of the fitting function was then tested with the rest of the datasets. A comparison of the fit-based penetration and the experimental data is shown as relative error in Table S1. Also included in Table S1 are the data sources, details about the filters, and the operating conditions. The fitting function in EquationEquation (15)
[15] is seen to be reasonably representative of the performance of almost all the media studied and is used in the current analysis.
2.3. Penetration Ignoring Multiply Charged Particles
To determine the accuracy of the filter penetration calculated neglecting the presence of multiply charged particles (i.e., EquationEquation (12)[12] ), a system-modeling approach is followed. In this modeling, the test particle size distributions, DMA operating conditions, particle charging properties, and filter penetration characteristics are chosen as desired and then using Equations (1)–Equation(10)
[10] the number concentrations of singly and multiply charged particles upstream and downstream of the filter are predicted. Then using EquationEquation (12)
[12] , size-dependent filter penetrations ignoring multiply charged particles can be calculated and compared against the initially assumed filter penetration distribution.
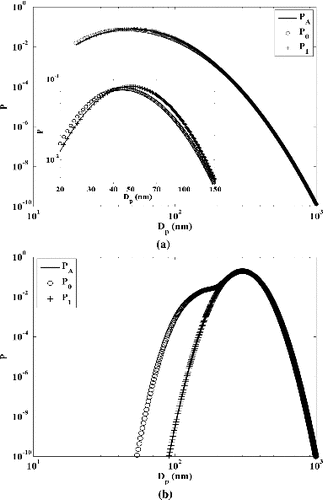
In initial calculations, two filter media types are considered—one with a penetration curve that has a small MPPS and broad distribution (labeled FP1 in ) and another with a larger MPPS and a narrow distribution (labeled FP2 in ). For these filter media types, the penetration calculated using EquationEquation (12)[12] is compared against their actual penetration (FP1 or FP2). For these tests, a particle size distribution with a mode size of 150 nm and a geometrical standard deviation of 1.6 (labeled SD1 in ), consistent with typical Ammonium Sulfate particles generated from an atomizer, is considered. The particles are assumed to pass through a DMA operated with balanced sheath and excess flowrates. The DMA sheath and aerosol flowrates are assumed as 3 and 0.3 l min−1, respectively, and the DMA and CPC efficiencies are considered to be 1 for all sizes. The charging efficiencies of particles with upto two charges are calculated based on the empirical expression of Wiedensohler (Citation1988), while the Boltzmann distribution is used for calculating the fractions of particles with higher charge numbers.
TABLE 1 Test particle and filter characteristics used in the modeling study
For the above simulation conditions, a comparison of the filter penetration () calculated using EquationEquation (12)
[12] against the actual penetration,
, is shown in . For the first filter case (FP1), the calculated filter penetrations (
) are seen to largely match the actual filter penetration distribution (
), shown in . For the second test case (FP2), the penetrations calculated based on EquationEquation (12)
[12] are seen to be significantly different from the initially assumed penetration distribution for particles smaller than ∼200 nm ().
FIG. 1. Filter penetrations calculated using Equation (12) compared against actual penetration distributions. The filter penetration characteristics for the two test cases shown are (a) FP1 and (b) FP2 as described in . For both cases, the test particles have a size distribution SD1 and the DMA is operated with sheath and aerosol flowrates of 3.0 and 0.3 l min−1, respectively. In the legend, PA is the actual filter penetration and P0 is filter penetration calculated based on Equation (12).
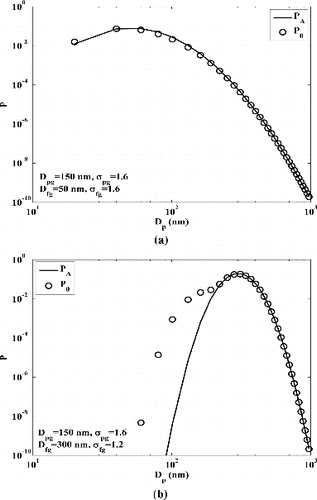
The discrepancy is because the contribution of multiply charged particles is ignored in the penetration calculation. While the DMA outputs particles over a narrow mobility range, these particles could constitute several distinct size ranges, depending on the distribution of charges on the particles. The fraction of singly and multiply charged particles extracted out from the DMA depends on the characteristics of the incoming particle size distribution, while the filter penetration characteristics will determine the relative concentrations of these fractions downstream of the filter. For a filter with a large MPPS and a broad penetration distribution (labeled FP3 in ) and test particles with a size distribution SD1, the fractions of singly charged particles upstream () and downstream of test filter (
) are shown in a. For these particle characteristics, the minimum fraction of the singly charged particles is ∼60% at a singly charged mobility-equivalent size of 60 nm (i.e.,
= 60 nm). That is, ∼40% are larger multiply charged particles with the same mobility as 60 nm. At larger sizes, the fraction of singly charged particles increases because the diameters of particles that contribute to the multiply charged fraction are larger than the mode size of particle size distribution (150 nm). At singly charged DMA-classified sizes smaller than 60 nm, the singly charged fractions increase because the particles that can constitute the multiply charged fraction are not highly charged in a bipolar diffusion charger (Wiedensohler Citation1988).
FIG. 2. (a) The fraction of singly charged particles upstream and downstream of the test filter. The test particle size distribution is SD1 and the filter penetration distribution is FP3. (b) The multiple-charge penetration factor F for a filter with penetration distribution of FP3 and test particles with size distribution of SD1, SD2, and SD3. (c) The multiple-charge penetration factor F for particles with size distribution SD1 and filters with penetration distributions of FP1, FP2, FP3, and FP4.
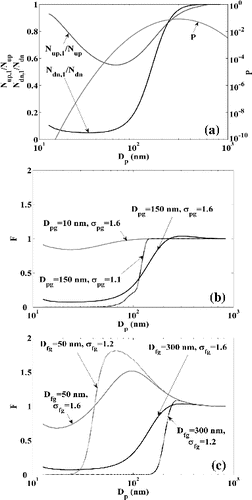
The concentrations of the DMA-classified particles downstream of the filter will depend on the size-dependent filter penetration (P) characteristics (a). As the multiply charged particles are of larger diameter than the singly charged particles, these particles are transmitted through the filter at different efficiencies. For example, when singly charged 60 nm particles are extracted from the DMA, the doubly and triply charged particles with the same mobility are 88.3 nm and 111.7 nm. These multiply charged larger particles pass through the filter with higher efficiency than the 60 nm particles. Thus, downstream of the filter, among the particles with the mobility of singly charged 60 nm particles, the fraction of multiply charged particles will be higher than that upstream of the filter. A simple ratio of the downstream to upstream concentrations will, therefore, result in erroneous penetration values.
For particles smaller than the MPPS (300 nm), the contribution of multiply charged particles to the penetration calculation can be very important. For particles with sizes larger than the MPPS, almost all particles upstream of the filter are singly charged, because the number concentration of larger particles that have the same mobility is low. For these sizes, the fraction of multiply charged particles decreases downstream of the filter, as the penetration of these large particles decreases significantly with increasing particle size.
The single-charge fraction factor, (EquationEquation (13)
[13] ), for filter FP3 tested with three different size distributions (SD1, SD2, and SD3) of particles upstream of the DMA, are shown in b. For the case shown in a (FP3, SD1), when particle sizes are larger than the MPPS, the factor F is ∼1, while for smaller particles F values are significantly less than 1. Thus, EquationEquation (12)
[12] can only reasonably be used for penetration calculation of larger particles for this case. For the narrow size distribution with a mode size of 150 nm (SD2), the F values for sizes smaller than ∼60 nm are almost zero, i.e., most particles present in this size are multiply charged. Thus, for these sizes filter penetration calculation based on EquationEquation (12)
[12] will result in completely different values comparing with the actual ones. For a broad size distribution of particles with a small mode size (SD3), the DMA-classified particles of almost all sizes downstream of the filter are singly charged. Thus, tests with such a size distribution should provide accurate penetration calculation using EquationEquation (12)
[12] .
For test particles with a size distribution SD1, the size-dependent values of factor F calculated for filters with different penetration characteristics (FP1-4) are shown in c. For a test filter with a small MPPS (FP1), the minima in the factor is ∼0.7 at ∼20 nm, which means that filter penetration calculated using EquationEquation (12)
[12] would not result in significant errors. While the maxima of the factor F can be ∼1.5 at ∼100 nm, i.e., at these sizes larger fraction of particles are from multiple charging at upstream rather than downstream the filter. Thus the calculated penetration based on EquationEquation (12)
[12] will be smaller than the actual value when a filter with small MPPS is tested by particles with large mode size. This scenario is magnified when the penetration distribution is narrower (FP4). For filters with large MPPS and narrow (FP2) or broad (FP3) penetration distributions, the downstream particles with mobility sizes less than ∼150 nm are almost entirely multiply charged. For these particles (diameter <150 nm), accurate penetration calculation requires the consideration of the factor
.
These results in , thus, suggest that the characteristics of the test particle size distribution and the filter penetration distribution critically determine the fraction of multiply charged particles upstream and downstream of the filter. For accurate penetration measurements, the test particles must have mode sizes that are significantly smaller than the filter MPPS. Or alternatively, the contribution of multiply charged particles must be accurately accounted for.
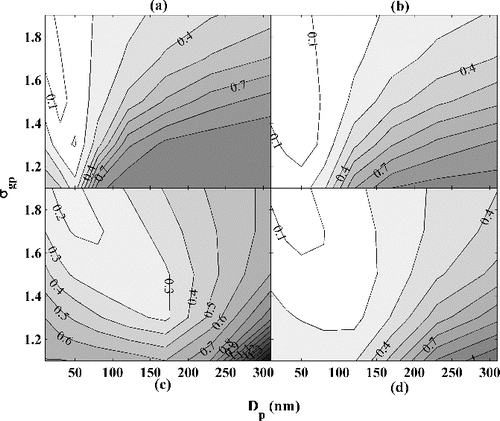
2.4. Errors
The errors in the penetration calculation resulting from ignoring the contribution of multiply charged particles (EquationEquation (12)[12] ) can be quantified by the two-norm error over all the DMA channels (
), calculated as
[17]
The contour plots of the calculated penetration errors are shown in . The penetration errors are quantified as a function of geometric mean size () of the test particle size distribution and its geometric standard deviation (
) for the four different filter types listed in . For all four cases, it is observed that the errors reduce with decreasing
and increasing
of the particles. In a and b, for filters with small MPPS (50 nm), it is seen that the calculated penetration errors can be significant when the particle
is large (>200 nm). For filters with large MPPS (300 nm) and small
, the errors are significant when the incoming particles also have a small geometric standard deviation (
<1.5; c). Overall, it can be concluded that for a selected particle size distribution, the relative error increases with increasing filter MPPS and for a selected filter, the relative error is larger and more sensitive to the particle size distribution when the
is small.
FIG. 3. Relative error under different upstream particle size distributions with the assumption of singly charged particles and filter penetration characteristics of (a) FP4, (b) FP1, (c) FP2, and (d) FP3.
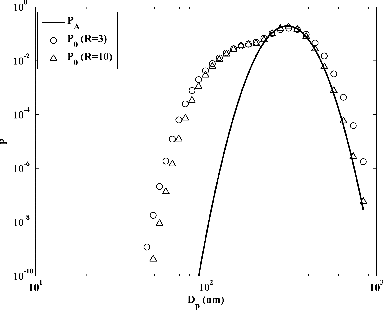
In addition to the incoming particle size distribution and filter penetration distribution, the DMA resolution (R = Qsh/Qa) also affects penetration measurements. The singly charged penetrations calculated for DMA resolutions of 3 and 10 are shown in . The errors introduced in the penetration calculation by ignoring the presence of the multiply charged particles are higher at a lower DMA resolution. Thus, for accuracy of penetration measurements, a higher DMA resolution is desired.
FIG. 4. Filter penetrations calculated using Equation (12) with different DMA resolutions. Here the results obtained from DMA resolution (Qsh/Qa) of 3 and 10 are labeled as R = 3 and R = 10, respectively. The test particle and filter characteristics are SD1 and FP2.
The combination of careful experimentation and accounting of the presence of the multiply charged particles while calculating penetration can eliminate the errors shown in , and these approaches are described below.
3. MULTIPLE-CHARGE CORRECTION
One possible approach to minimize the error resulting from the presence of the multiply charged particles is to ensure that the test particles generated upstream of the DMA are largely composed of only singly charged particles. A practical realization of such test conditions is possible using an electrospray particle generator. Using a commercial electrospray (TSI 3480), a sufficiently narrow size distribution of particles (<1.1) can be generated, with the particle mode size tuned by adjusting the volumetric concentration of the solution (Model 3480; TSI Inc., Shoreview, MN, USA). The contribution of multiply charged particles to the test particle size distribution can be further minimized by passing these particles through a DMA. By selecting particles from the tail of the particle size distribution, the concentration of multiply charged particles in the classified particle population can be significantly lower than that of the singly charged particles. There are two limitations to this experimental approach: particles larger than ∼100 nm are difficult to generate with a commercial electrospray and the particle number concentrations in the tail of the distributions can be low, limiting our ability to use this technique for testing high-efficiency filters.
In addition to improved testing methodologies, a new multiple-charge correction algorithm for accurate calculation of filter efficiencies from penetration measurement is introduced.
3.1. The Multiple-Charge Correction Approach
The approach to correct for the contribution of the multiply charged particles to the penetration measurements is summarized below:
Determine the particle size distribution upstream of the DMA,
, using a scanning electrical mobility spectrometer (SEMS) and an appropriate data inversion algorithm (He and Dhaniyala Citation2013).
Calculate the concentration of singly charged particles upstream of the filter in channel i,
From the measured particle concentrations upstream and downstream of the test filter, the initial penetration distribution,
Assuming that the largest particles classified from the DMA are singly charged (larger multiply charged particles are either impacted out or considered to be present in very low concentrations), the multiply charged contribution of these particles to the lower channels can be determined. At the largest size channel (M), the updated penetration (
Here, interpolation may be required to obtain the penetration
Recursively step back over all the size channels and calculate
The multiple-charge corrected penetration corresponding to the size channel i can be calculated using EquationEquation (19)
The accuracy of the multiple-charge correction algorithm for filter penetration calculation is tested for different filter characteristics. Considering particles of the size distribution SD1, and filter characteristics FP1, the penetration values calculated with and without the multiple-charge correction algorithm (i.e., and
, respectively) are shown in comparison to the actual penetration (
) in a. For a filter penetration curve with a small MPPS and test particles with a large mode size, the penetrations calculated with and without the multiple-charge correction algorithm are seen to largely match. For the filter FP2, which has a large MPPS, the penetration calculated using the proposed correction (
) is seen to largely match the expected values, without the errors seen in
calculation. The results shown in provide initial validation of the applicability of the multiple-charge correction approach to accurately calculate size-dependent filter penetration values.
FIG. 5. The penetrations calculated with multiple-charge correction algorithm compared against the actual penetration and the penetration obtained with singly charged particle assumption. The particles have distribution of SD1 and the filter penetration characteristics are described by (a) FP1, and (b) FP2. Here P1 is the corrected filter penetration, obtained from Equation (19), considering the multiple-charge contribution.
3.2. Limit of Proposed Multiple-Charge Corrected Penetration Calculation Approach
The application of the proposed multiple-charge correction method is critically dependent on satisfying the requirement that the contribution of the multiply charged particles to the last size channel be minimal. This requires that the last channel (∼1 μm) correspond to the tail of the generated size distribution. Such an operation of the DMA is not always feasible and even when possible the resulting concentration of the particles upstream of the test filter will be too low. Thus, measurement of particle penetration characteristics of high-efficiency filters will not be practical under such operation. Also, the effective use of the multiple-charging correction approach requires a very fine DMA classification interval. For example, for the case shown in b, a size interval of ∼1 nm was chosen, which cannot be achieved experimentally.
For a size interval of ∼20 nm, the penetration calculated (P1-coarse) for a filter FP1 and size distribution SD1 is compared against the penetrations obtained without the multiple-charge correction () and the actual value (
) in a. Also shown in this figure are the penetration values (P1-limit) calculated assuming that the DMA has a limited classification range, with a maximum classification size of 400 nm. As the penetration calculation error associated with multiply charged particles is minimal for filter FP1, accurate penetrations can be retrieved under conditions of both coarse size-interval particles (P1-coarse) and limited classification range (P1-limit).
FIG. 6. Filter penetrations calculated for the cases of coarse DMA channels and for the case of limited DMA classification range (maximum classification size of 400 nm singly charged equivalent diameter). The test particles characteristics are assumed to be SD1 and the filter penetrations (a) FP1, and (b) FP2.
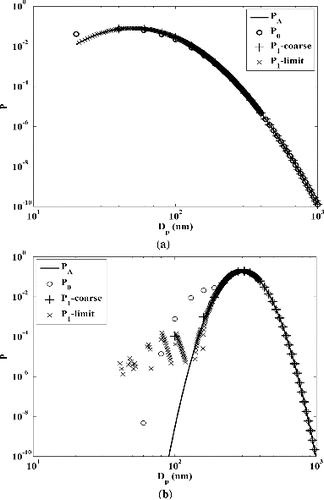
For the filter FP2, the corrected penetrations calculated under both the scenarios of coarse size-intervals (P1-coarse) and the limited classification range (P1-limit) result in large errors (b) for some sizes. The errors in the multiple-charge corrected penetration curve arise because we have limited information on the size distribution of large particles (> 1 μm) and hence cannot predict their multiple-charge contribution to smaller sizes. The penetration calculated with a coarse channel resolution has errors because the calculation of the contribution of large multiply charged particles to the number concentration signal (EquationEquation (20)
[20] ) requires interpolation of the penetration curve (
). As penetration has a strong non-linear dependence on particle size, accurate interpolation is not always possible, resulting in errors in the calculated penetration values. Note that using an impactor upstream of the DMA will help alleviate the problems associated with the limited classification range but not the problems associated with limited DMA channel resolution.
The results in also suggest that filter penetration tests with particles from just one selected size distribution is almost impossible, especially when the test filter penetration distribution is narrow. An alternative solution is to make penetration measurements using at least two different size distributions of particles: a large mode size distribution with high concentration for measurement of penetrations in large sizes, and small mode size distribution for penetration measurements in small sizes with limited multiple-charging effect on the test results. The above multiple-charging correction method can then be applied to the test results from the two size distributions towards a complete and accurate filter penetration retrieval.
4. EXPERIMENT VERIFICATION
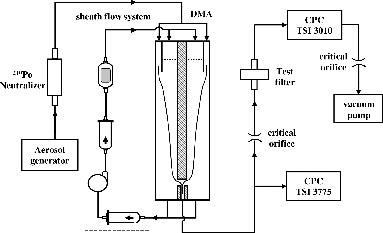
To demonstrate the errors in penetration measurements associated with the multiple charging effect, a low pressure filter penetration measurement experiment was conducted using the experimental setup shown in . The low pressure tests allow for measurements to be made by a filter with a narrow penetration curve (small ) and large MPPS (CitationHe et al. in prep.). Test particles were generated using an electrospray (TSI 3480). Ammonia-acetate-based sucrose and polystyrene latex (PSL, Thermo) solutions were used for generating two different types of test particle size with narrow distribution—a small and a large mode size distribution, respectively. The particles were charged by passing them through a 210Po neutralizer and then classified by a DMA operated with a sheath flowrate of 4.0 l min−1 and aerosol flowrate of 0.375 l min−1. The concentration of the DMA-classified particles was measured by a CPC (TSI 3775) operated at atmospheric pressure and a sample flowrate of 0.3 l min−1. For the low pressure (7.6 kPa) tests, the test filter (Pall Corp., 4HD4886) was placed downstream of a critical orifice (O’Keefe Controls Co.). Particle concentrations downstream of the test filter were measured with a CPC (TSI 3010) modified to operate at low pressure (7.6 kPa; CitationHe et al. in prep.) and a flow rate of 1.0 l min−1. The transport/detection efficiency of the combination of the critical orifice and the low-pressure CPC (TSI 3010) relative to the CPC operated at atmospheric pressure (TSI 3775) was measured by replacing the test filter with a short length of tubing. Filter penetrations were then calculated considering these efficiencies and the relative concentrations of the upstream and downstream CPCs.
FIG. 7. Schematic diagram of the experimental setup for filter penetration measurements.
Filter penetration was measured for a range of particle sizes (channels) by varying the DMA operating voltage. At each DMA voltage, three repeated measurements were made, with a sample time that resulted in at least 300 particles in the downstream CPC for each measurement. The measurement of at least 300 count particles ensured that the error introduced by Poisson noise on the calculated penetration is small. More details about the description of the filter experimental setup are available in CitationHe et al. (in prep.). The size distribution of the particles generated from the electrospray was determined using a wide-range particle spectrometer (WPS 1000XP, MSP). The particles from the sucrose solution have a log-normal distribution with a mode size of ∼31 nm and geometric standard deviation of 1.31. The 200 nm PSL particles were electrosprayed to generate larger particles with a narrow size distribution. The two particles represent two extreme cases: sucrose particles have a “distribution with small mode size,” similar to SD3, while the PSL particles represent a “narrow distribution with large mode size,” similar to SD2.
The measured penetrations of the test filter at 7.6 kPa are shown in . The small mode size of the sucrose particles (∼31 nm) ensures that the particles classified by the DMA are largely singly charged (as shown for particles of SD3 in b). Therefore, the penetrations calculated based on singly charged assumption (P0-Sucrose) from EquationEquation (12)[12] are similar to those obtained with the multiple-charge correction applied (P1-Sucrose), shown in . The tests with the narrowly distributed (ND) PSL particles (mean size 200 nm, geometric standard deviation of 1.06) represent a case where a significant fraction of the sub-200 nm are multiply charged (as shown for particles of SD2 in b). With a bipolar diffusion charger, a significant fraction of the 200 nm PSL charged particles will have two (38.5%) and three (11.1%) charges. Passing these particles through a DMA operated to output particles corresponding to a mobility of singly charged particles of diameter 101 nm and 130 nm will primarily output triply and doubly charged 200 nm particles, respectively. The penetration measurements with these particles (P0-ND) through EquationEquation (12)
[12] show similar values for the three sizes (101, 130, and 200 nm; ), demonstrating the skewing of the penetration curve by the multiply charged particles.
FIG. 8. Filter penetration measurements made at a pressure of 7.6 kPa and a flowrate of 1.0 l min−1 with sucrose and polystyrene latex (PSL) particles generated using an electrospray. The penetrations calculated using Equation (12) with Sucrose and 200 nm PSL particles are labeled P0-Sucrose and P0-ND, while the multiple-charge corrected penetrations for the sucrose particles is labeled as P1-Sucrose. Using the P1-Sucrose penetration curve, the penetration for PSL particles (P1-ND-predict) is predicted using Equations (9), (10), and (12). The error bars represent the standard deviation of three repeated measurements.
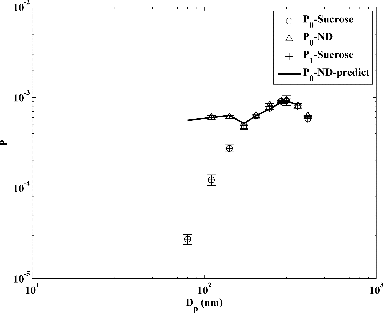
Considering the large mode of the test particles (200 nm) and limited information about P0-ND (i.e., no penetration information at large particles), b suggests that the proposed multiple-charging correction approach cannot be applied to determine P1-ND. Instead, using the filter penetration curve obtained from the sucrose tests (P1-Sucrose) along with the knowledge of the PSL size distribution and charging efficiencies, the size-dependent penetration of the generated PSL particles without multiple charging correction is predicted using Equations (9), (10), and (12). The predicted penetration curve is shown as P0-ND-predict in . The predicted filter penetrations are seen to closely match the experimental obtained values, providing preliminary validation to the theoretical penetration calculation approach of Section 2.1.
In summary, accurate filter penetration measurements require experiments with two different particle size distributions: large mode particles to generate a sufficient number of large test particles and small mode particles to minimize the multiple-charging effect on small sizes. Penetration data at large sizes can be obtained using the large mode particles, while the penetration measurements at small sizes must be determined using the small mode particles. Combining data from such experiments with the multiple-charge correction approach proposed in this study will result in accurate penetration measurements of most filter types.
5. CONCLUSIONS
Size-dependent penetration is a critical property of filter media and this can often only be established experimentally. We evaluate the current filter penetration measurement approach and demonstrate the possible errors resulting from the existing test methods. For size-classified penetration measurements, a DMA is used upstream of the filter. A fraction of particles classified from the DMA will be multiply charged and, thus, larger in size than the primary singly charged particles generated for filter tests. The presence of these multiply charged particles critically affects filter penetration measurements. The fraction of multiply charged particles upstream and downstream of the filter depends on the aerosol size distribution entering the DMA and the filter penetration characteristics. A multiple-charge correction algorithm for penetration calculation is proposed. The correction approach is seen to result in accurate penetration calculation if the DMA resolution is high and the generated test particles are largely within the DMA classification range. Note that the filter penetration approach presented here assumes that the penetration measurements made with charged particles will be the same as that calculated with neutral particles and this assumption may not always hold, e.g., when electret-filters are used. Experiments conducted with different test aerosol size distributions demonstrated the importance of the multiple-charge effect on skewing penetrations. Analysis of the experimental data provided initial validation for the proposed penetration calculation approach.
NOMENCLATURE
| = | conversion parameter between mobility and particle diameter | |
| = | filter MPPS, see Equation (15) | |
| = | geometric mean size of the particle size distribution, see Equation (14) | |
| = | diameter of particles with n charges corresponding to the mean mobility and extracted from the DMA ith size channel, see Equation (2) | |
| = | particle charging fraction, see Equation (1) | |
| = | multiple-charge filter penetration factor, see Equation (13) | |
| = | particle Knudsen number, see Equation (4) | |
| = | DMA total size channels | |
| = | particle charge number | |
| = | particle number concentration downstream of the test filter in size channel i, see Equation (10) | |
| = | singly charged particle number concentration downstream of the test filter in size channel i | |
| = | multiply charged particle number concentration downstream of the test filter in size channel i | |
| = | particle number concentration upstream of the test filter in size channel i, see Equation (9) | |
| = | singly charged particle number concentration upstream of the test filter in size channel i | |
| = | multiply charged particle number concentration upstream of the test filter in size channel i, see Equation (20) | |
| = | total particle number concentration | |
| = | particle size distribution value in the ith channel for particles with n charges and centroid mobility corresponding to a DMA voltage | |
| = | actual filter penetration | |
| = | filter penetration calculated from the ratio of total particle concentration downstream the filter to that upstream, see Equation (12) | |
| = | multiple-charge corrected filter penetration, see Equation (19) | |
| = | a factor related with the filter penetration at MPPS and the width of penetration, see Equation (16) | |
| = | DMA aerosol flow rate | |
| = | DMA excess flow rate | |
| = | DMA sample flow rate | |
| = | DMA sheath flow rate | |
| = | DMA voltage | |
| = | coefficients of particle slip correction factor | |
| = | DMA flowrate parameter | |
| = | geometric standard deviation of filter penetration distribution | |
| = | geometric standard deviation of particle size distribution | |
| = | CPC counting efficiency | |
| = | DMA penetration efficiency | |
| = | gas mean free path | |
| = | factor that determines the fraction of charged particles detected by the CPC downstream of the DMA considering the properties of the charger, DMA, and the CPC, see Equation (8) | |
| = | DMA transfer function |
SUPPLEMENTAL MATERIAL
Supplemental data for this article are available on the publisher's website.
UAST_1062467_Supplemental_File.zip
Download Zip (112.1 KB)Funding
This work was supported with funding from Pall Corp. and Center for Advanced Materials Processing (CAMP) at Clarkson University.
REFERENCES
- Allen, M. D., and Raabe, O. G. (1985). Slip Correction Measurements of Spherical Solid Aerosol Particles in an Improved Millikan Apparatus. Aerosol Sci. Technol., 4:269–286.
- Dhaniyala, S., and Liu, B. Y. H. (1999). Investigations of Particle Penetration in Fibrous Filters: Part I. Experimental. J. IEST, 42:32–40.
- He, M., and Dhaniyala, S. (2013). A Multiple Charging Correction Algorithm for Scanning Electrical Mobility Spectrometer Data. J. Aerosol Sci., 61:13–26.
- He, M., Dhaniyala, S., and Wagner, M., (in prep.). Characterization of Filter Performance Under Low-Pressure Operation. Aerosol Sci. Technol.
- Knutson, E. O., and Whitby, K. T. (1975). Aerosol Classification by Electric Mobility: Apparatus, Theory, and Applications. J. Aerosol Sci., 6:443–451.
- Lee, K. W., and Liu, B. Y. H. (1982). Experimental Study of Aerosol Filtration by Fibrous Filters. Aerosol Sci. Technol., 1:35–46.
- Podgorski, A., Maisser, A., Szymanski, W. W., Jackiewicz, A., and Gradon, L. (2011). Penetration of Monodisperse, Singly Charged Nanoparticles Through Polydisperse Fibrous Filters. Aerosol Sci. Technol., 45:215–233.
- VanOsdell, D. W., Liu, B. Y. H., Rubow, K. L., and Pui, D. Y. H. (1990). Experimental Study of Submicrometer and Ultrafine Particle Penetration and Pressure Drop for High Efficiency Filters. Aerosol Sci. Technol., 12:911–925.
- Wiedensohler, A. (1988). An Approximation of the Bipolar Charge Distribution for Particles in the Submicron Size Range. J. Aerosol Sci., 19:387–389.
- Zhang, Z., and Liu, B. Y. H. (1992). Experimental Study of Aerosol Filtration in the Transition Flow Regime. Aerosol Sci. Technol., 16:227–235.