Abstract
Silica and titania aerosol nanoparticles are coated with silver through a physical coating process. The silver is evaporated in a tubular furnace flow system and condensed on the ceramic carrier particles with diameters of approximately 100 nm. The temperature gradient in the furnace system is optimized in order to avoid homogeneous nucleation of the silver. The generated ceramic–silver composite nanoparticles are characterized with aerosol measurements and analytical transmission electron microscopy. Two completely different particle morphologies are clearly observed, silver-decoration and composite doublet, with amorphous silica and crystalline rutile titania as the carrier particles, respectively. The former morphology consists of multiple silver nanodots with diameters of 1–10 nm, while in the latter morphology the silver had formed a larger structure with a size comparable to that of the carrier particle. Different shapes are observed in these larger silver structures, such as triangular, rodlike, and hexagonal. Differences in the silver particle migration on the surface of the silica and titania particles is proposed to be the key factor resulting into the two distinct particle morphologies.
Copyright 2015 American Association for Aerosol Research
1. INTRODUCTION
Ceramic nanoparticles (e.g., SiO2, TiO2, and Al2O3) coated via aerosol methods with noble metals (Pd, Ag, Pt, and Au) have been utilized as gas sensors (Mädler et al. Citation2006), catalysts (Height et al. Citation2006; Keskinen et al. Citation2007; Faust et al. Citation2013), antibacterials (Sotiriou et al. Citation2011), as well as in optical applications, such as plasmonics (Boies et al. Citation2011; Zdanowicz et al. Citation2013) and nonlinear optics (Zdanowicz et al. Citation2013, Citation2014). Both chemical and physical routes to the coating of nanoparticles in the aerosol phase have been demonstrated. Chemical coating routes, such as flame synthesis methods (Keskinen et al. Citation2007; Teoh et al. Citation2010) and chemical vapor deposition (Binder et al. Citation2007), are known for the high production rate and the precise control of the coating parameters, respectively. However, finding the suitable precursors for the desired chemical processes can be challenging. Physical coating routes usually rely on the coagulation of smaller metal particles or clusters and larger carrier particles (Boies et al. Citation2011; Pfeiffer et al. Citation2015). Even though the particle coagulation can be enhanced with the electrical attraction between oppositely charged metal and carrier particles (Sigmund et al. Citation2014), the amount of the metal coating on an individual carrier particle has been usually low.
Condensation of vaporized material onto a seed particle is a physical coating route exploited extensively, for example, in aerosol measurement instruments and reference aerosol generation (Yli-Ojanperä et al. Citation2010). In these applications, it is more practical to use liquid as a “coating” material. Due to the low vapor pressures of noble metals, high temperatures are required for their substantial vaporization. Sparks are an efficient method to vaporize metals for nanoparticle production (Pfeiffer et al. Citation2014). However, the huge temperature drop after the spark leads quickly to particle formation through homogeneous nucleation. More controlled temperature gradients can be achieved in systems where the complete gas flow is heated within a tubular reactor. Backman et al. Citation(2004) used such a reactor in their evaporation/condensation system for coating titania agglomerates with silver, resulting in nanometer-sized silver particles on the surface of the carrier particles. Much higher amounts of condensated material was achieved by Zihlmann et al. Citation(2014), who grew gold seed particles with silver. In their experiments, the produced particles were spherical, although not core–shell, as the two materials were evenly distributed in the particles, forming a metal alloy.
Here, we study the coating process of two ceramic materials, amorphous silica and crystalline rutile titania, via silver vapor condensation. The size of the coated particles is around 100 nm. The produced composite particles are characterized using aerosol instruments and analytical transmission electron microscope. In the case of the silica carrier particles, we find that the silver forms separate nanodots (a.k.a. decoration). This is probably the most common morphology obtained in the different coating processes for aerosol nanoparticles (Backman et al. Citation2004; Binder et al. Citation2007; Boies et al. Citation2011; Zdanowicz et al. Citation2013; Sigmund et al. Citation2014; Pfeiffer et al. Citation2015). However, the silver behaves quite differently on the crystalline titania, forming larger particles and resulting into a morphology that could be described as a composite doublet.
2. EXPERIMENTAL METHODS
In this study, two separate aerosol synthesis processes were combined in order to produce ceramic–silver composite nanoparticles. In the first process, ceramic aerosol nanoparticles were produced with a flame method and collected into a nanopowder. The second process involved the spraying of the previously produced nanopowder into a closed gas flow, followed by the sintering of the sprayed ceramic nanoparticles, and finally the coating of these particles with silver. It should be noted that as both of the used synthesis processes take place in the aerosol phase, it might be possible to combine them into one continuous aerosol process. However, as the current research concentrates on studying the coating process of the ceramic nanoparticles, it was more convenient to utilize two separate aerosol synthesis processes.
2.1. Generation of the Silica and Titania Carrier Particles
The silica and titania carrier particles were generated from nanopowders of the said materials. The nanopowders were produced with a flame synthesis method called the Liquid Flame Spray (LFS) (Tikkanen et al. Citation1997). In the LFS, a precursor dissolved in a liquid solution is atomized into a turbulent H2/O2 flame. Due to the high temperature, the precursor evaporates and undergoes chemical reactions that lead to a particle nucleation. The formed particles grow through condensation from the vapor phase and coagulation with other particles, usually leading to a highly agglomerated end product (Eggersdorfer and Pratsinis Citation2014). A more detailed description of the LFS can be found from the previous studies (Aromaa et al. Citation2007; Haapanen et al. Citation2015). In this study, tetraethyl orthosilicate (TEOS, Alfa Aesar 98%) and titanium isopropoxide (TTIP, Alfa Aesar 97%) dissolved in isopropyl alcohol (50 mg(Si)/mL and 50 mg(Ti)/mL) were used as precursors for silica and titania, respectively. Furthermore, the precursor feed rates were 4.2 and 6.0 mL/min and the H2/O2 flow rates in the burner were 30/30 and 40/20 L/min for the generation of the silica and titania nanoparticles, respectively. The LFS-generated particles were collected into a nanopowder with an electrostatic precipitator (Harra et al. Citation2013).
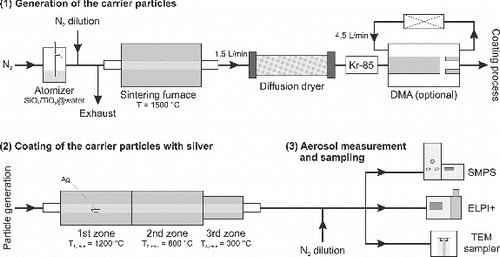
A schematic illustration of the experimental setup used for the continuous production of the ceramic–silver composite particles is shown in Figure . The setup can be divided into three sections: (1) generation of the carrier particles, (2) coating of the carrier particles with silver, and (3) aerosol measurement and sampling. In Section 1, aqueous dispersion of LFS-generated silica (3 mg/mL) and titania (6 mg/mL) nanopowders were aerosolized with an atomizer aerosol generator (Topas ATM 220) using nitrogen as a carrier gas. The sprayed aerosol was diluted with nitrogen in order to avoid water condensation on the tube walls, resulting into a relative humidity of approximately 90% at the room temperature. In order to study the coating process, the agglomerated particles were sintered in a tube furnace (Carbolite TZF 15/50/610, alumina tube, inner diameter 25 mm) at a temperature of , while the flow rate was 1.5 L/min. The water was removed from the gas phase with a diffusion drier only after the furnace, as the water vapor is known to enhance the sintering process (Goertz et al. Citation2011). A differential mobility analyzer (DMA, Vienna-type) was used as an option to select certain particle sizes and also to reduce the particle number concentration. The DMA was preceded by a radioactive neutralizer (Krypton-85), and the aerosol/sheath flow rate in the DMA was 1.5/4.5 L/min.
The particle number size distributions were measured with a scanning mobility particle sizer (SMPS) depicted in Section 3 (Figure ). The SMPS composed of a radioactive neutralizer (Krypton-85), a DMA (TSI 3081), and a condensation particle counter (CPC, TSI 3025). The total condensation sink (CS) of the carrier particles was estimated relatively using an electrical low pressure impactor (ELPI+) (Keskinen et al. Citation1992; Järvinen et al. Citation2014), as the total current measured by the ELPI is directly proportional to the total CS (Kuuluvainen et al. Citation2010; Järvinen et al. Citation2015). lists the parameters of the carrier particles used in this study. Examples of the particle number size distributions are shown in Figure . The distributions before the DMA were broad with geometric standard deviations near 1.6. Due to this, the doubly charged particles form a large fraction of the size distributions after the DMA. We take advantage of this, and analyze both particle sizes in the bimodal distribution by fitting log-normal distributions to the measurements.
FIG. 2. Examples of the number size distributions of the carrier particles before and after the DMA.
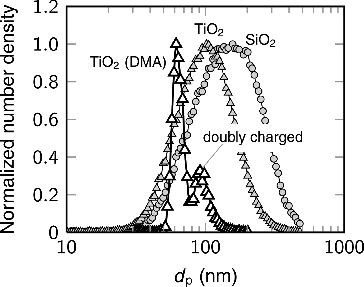
Table 1 The parameters of the generated carrier particles
2.2. Coating of the Carrier Particles with Silver
The coating section of the experimental setup (Section 2 in Figure ) consisted of an alumina tube (inner diameter 25 mm) heated inside two consecutive tube furnaces (Carbolite MTF 12/38/400), both with a heated length of 400 mm. A heater band with a length of approximately 300 mm was added as a third heating zone. Three pieces of bulk silver with diameters of approximately 5 mm were placed in a crucible in the middle of the first heating zone (temperature T1). The nitrogen flow rate through the coating section was 1.5 L/min, and the maximum silver evaporation temperature was .
The amount of the evaporated silver in different temperatures was estimated by measuring the total mass of the silver particles formed through homogeneous nucleation with the SMPS directly after the first furnace. This gives the lower limit to the actual evaporated mass. The upper limit is obtained by assuming that the gas is saturated with silver. Furthermore, values calculated from the evaporation rates of silver in a gas flow (Lu and Zhu Citation2007) provide intermediate estimations. The functional form of the vapor pressure of silver (Alcock et al. Citation1984) was fitted to the measured and calculated values. The estimations of the total mass concentration of silver as a function of the evaporation temperature are presented in Figure a.
FIG. 3. (a) The total mass concentration of silver as a function of the evaporation temperature (T1) measured with the SMPS directly after the first heating zone. The calculated values are derived from the evaporation rates determined by Lu and Zhu Citation(2007). (b) The total mass concentration of silver as a function of the temperature of the second heating zone (T2) measured with the SMPS. The evaporation temperature was . At intermediate temperatures (500–
), no particles were detected with the CPC. In both figures, the solid line corresponds to a full saturation concentration at the evaporation temperature, and the dashed gray lines represent fits of the functional form of the silver vapor pressure to the measured and calculated values.
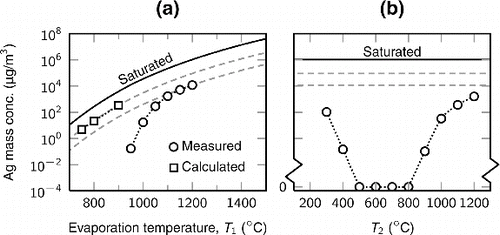
In order to avoid homogeneous nucleation of silver, the temperature gradient inside the heating zones was optimized. To find the correct temperature gradient, we measured the total mass of the generated silver particles with the SMPS as a function of the temperature of the second heating zone (T2), while the evaporation temperature in the first heating zone was set to . The results are shown in Figure b. With lower temperatures, the temperature gradient is steep enough for the particle nucleation to occur. On the other hand, higher temperatures shift the location of the particle nucleation after the second heating zone. At intermediate temperatures of approximately 500–
, no particles were detected, even with the CPC alone (cut point 3 nm). Thus, the homogeneous nucleation is minimized and the silver vapor condenses on the tube walls. The temperature of the second and third (T3) heating zones were chosen to be 600 and
, respectively, for further experiments.
In the presence of the carrier particles, some of the evaporated silver forms coating on the carrier particles through heterogeneous nucleation and vapor condensation. The effect of the coating to the mobility size of the particles was measured with the SMPS. In order to analyze the particles with an analytical transmission electron microscope (TEM, Jeol JEM-2010), they were charged with a corona charger (Arffman et al. Citation2014) and deposited on carbon coated copper grids using an electrostatic precipitator (Krinke et al. Citation2002; Harra et al. Citation2012). Morphology and crystal structure studies of the particles were done by TEM imaging and selected area electron diffraction (SAED), respectively. In addition, elemental analysis of the particles was performed with an energy-dispersive X-ray spectrometer (EDS, Thermo Scientific Noran Vantage, Si(Li) detector). The weight percents of different elements were determined by the conventional qualitative and quantitative EDS analysis procedures using Noran Vantage Spectral Display software. The reference library used in the crystal structure analyses was the database (PDF+ 2014) from International Centre for Diffraction Data (ICDD).
3. RESULTS AND DISCUSSION
3.1. Particle Sizes Measured in the Aerosol
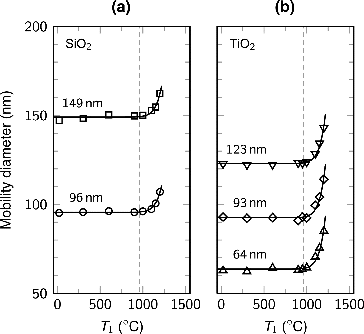
The mobility size of the particles selected with the DMA was measured with the SMPS at different evaporation temperatures. The temperatures of the second and the third heating zones were the same as the evaporation temperature until at 600 and , respectively, after which only the evaporation temperature was increased. The particle sizes were determined from the measurements using bimodal log-normal fits. In the case of the largest titania particles, only the first mode was properly resolved. shows the mobility diameter of the size-selected silica and titania particles as a function of the silver evaporation temperature. With both particle materials, the mobility diameter stays constant, until, after the melting point of bulk silver, the particle diameter begins to rapidly increase. With all of the studied particle sizes, at the maximum evaporation temperature of
, the diameter of the silica and titania particles had increased approximately 10 and 20 nm, respectively.
FIG. 4. The mobility diameter of the size-selected (a) silica and (b) titania particles as a function of the silver evaporation temperature (T1). The temperatures of the second and third heating zones were the same as the evaporation temperature until T2 = 600 and , after which only the evaporation temperature was increased. The dashed lines correspond to the melting point of bulk silver (
).
The ELPI+ was also used to measure the particle number size distributions. However, even though greased impaction substrates were used, particle bounce and subsequent charge transfer interfered with the measurements (Kuuluvainen et al. Citation2013; Arffman et al. Citation2015). Interestingly, at least the charge transfer ended when the particle size began to increase, presumably, due to the formation of the conductive metal on top of the dielectric particle material. Although, the size distributions measured with the ELPI+ were unreliable, the total measured current could be used as an estimation of the total CS of the aerosol particles.
3.2. Particle Morphologies Observed with Electron Microscopy
The TEM micrographs shown in Figure a reveal that the silica particles were quite compact but not fully sintered to spheres after the sintering step. Obviously, the residence time in the furnace (approximately 2 s) was insufficient for complete sintering. Similar observations on the sintering behavior of pure silica have been reported in the literature (Binder et al. Citation2010; Goertz et al. Citation2011). The titania particles in Figure b, on the other hand, were sintered to a faceted form, as expected (Ahonen et al. Citation2001; Binder et al. Citation2010). Based on the previous studies, the LFS-generated titania nanopowder is mostly crystalline anatase (Aromaa et al. Citation2007, Citation2012). However, after the sintering step at , we expect that the phase of the titania changes to rutile (Ahonen et al. Citation2001). In order to confirm the phase of the titania carrier particles, the corresponding electron diffraction (ED) patterns were analyzed (Figure ) and the distance between the adjacent lattice fringes from the TEM micrographs was measured. The ED patterns indicated the crystal structure of rutile with main crystal orientations [001] and [111]. In addition, a lattice spacing of 0.324 nm was obtained, which can be assigned to the interplanar distance of rutile phase [110] plane.
FIG. 5. TEM micrographs of (a) silica and (b) titania particles before and after the coating with silver at evaporation temperatures (T1) of 1100 and . Silver-decoration and composite doublets were formed with silica and titania carrier particles, respectively.
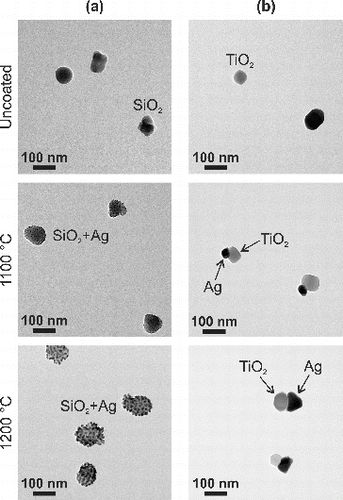
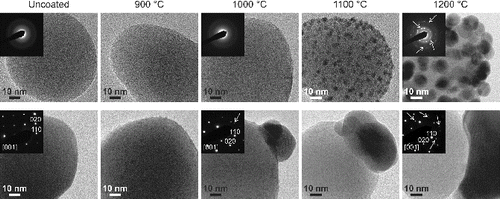
FIG. 6. TEM micrographs of approximately 90 nm silica (top row) and titania (bottom row) particles coated with silver at different evaporation temperatures (T1). The insets show typical electron diffraction (ED) patterns from the particles at the corresponding temperatures. The ED patterns indicate amorphous silica and crystalline titania particles. At , reflections (marked with arrows) from nanocrystalline silver on silica, and starting at
, reflections from crystalline silver structures on titania particles can be observed.
At silver evaporation temperatures of 1100 and (Figure ), we see two totally different particle morphologies. In the case of the silica, the silver forms nanodots, referred here as decoration, that cover the silica particles uniformly. The size of the dots increases with the evaporation temperature. However, with titania, the silver forms a single larger particle whose size increases with the evaporation temperature, leading to a composite doublet morphology. No individual silver particles were detected with the TEM.
The different particle morphologies for silica and titania are consistent with the SMPS mobility size measurements. For silica at , the evenly distributed silver particles have a diameter of approximately 10 nm, and thus the mobility size increases less than 20 nm. For doublets of spheres, the mobility size is about 1.3 times the size of the individual spheres (Kasper Citation1983). In the case of the 60 nm titania particles, the silver particles have about the same size, and thus the mobility diameter increases approximately 20 nm.
TEM micrographs at a higher magnification from approximately 90 nm silica and titania particles coated at different silver evaporation temperatures are shown in Figure . Before coating, the particle surfaces are clean, but already at we observe extremely small (<1 nm) silver nanodots on top of both carrier particle materials. With silica, as the size of the spherical decorations increases with the temperature, their number density on the particle decreases. On the titania particles at
, larger silver structures have been formed. As the evaporation temperature increases, the size of these structures increases as well. However, we still see some smaller silver dots on the titania particles.
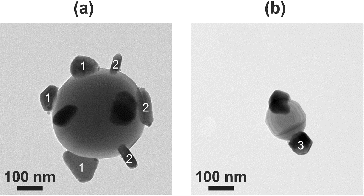
Titania particles smaller than 120 nm contained only one larger silver particle. However, multiple silver structures were found in larger carrier particles. a shows a nearly 400 nm titania particle containing several silver structures, whereas an approximately 160 nm titania particle with a grain boundary in the middle contains two silver particles on each side as seen in Figure b. The silver structures observed on the titania particles had a variety of different shapes, including triangular, rodlike, and hexagonal.
FIG. 7. A TEM micrograph of (a) a large titania particle containing several silver structures and (b) a titania particle with a grain boundary containing two silver structures. Different shaped silver structures were observed, including (1) triangular, (2) rodlike, and (3) hexagonal. The evaporation temperature was .
The ED pattern in Figure for an uncoated silica particle shows diffuse rings, characteristic to an amorphous material. At the evaporation temperature of , the ED pattern of the silica particle decorated with approximately 10 nm silver particles shows crystalline rings, marked with arrows, characteristic to nanocrystalline material. As the size of the silver decorations decrease with lower evaporation temperatures, the rings can be expected to become more diffuse. Furthermore, as these rings are similar to the ones caused by the amorphous silica, we were unable to detect the effect of the silver decorations on the ED patterns at the lower evaporation temperatures. For uncoated titania particles, we observed reflections caused by the crystalline rutile structure with main crystal orientations [001] and [111] at every evaporation temperature. Thus, no additional crystal phase shift occurs with titania in the coating section. At the evaporation temperature of
, extra reflections caused by the silver were detected. The number of these reflections increased with the evaporation temperature, as the size of the silver structure increased.
3.3. Characterization of the Silver Coating Using Elemental Analysis
An EDS analysis was performed on several individual particles in order to determine the weight percents of the different elements in the particles. Only elemental silver (Ag) and silicon/titanium (Si/Ti) were included in the analysis. From the obtained weight percents, we could calculate the mass of silver on an individual carrier particle by assuming that each Si/Ti atom is bonded to two oxygen atoms, i.e., we have pure silica/titania (SiO2/TiO2). Also, bulk densities for the substances, 2.2, 4.23, and 10.49 g/cm3 for silica, titania, and silver, respectively, were assumed. For each obtained value, approximately five measurements from different individual particles were averaged.
a shows the number density of the decorative silver dots on the silica particles as a function of the diameter of the silver decorations. The average dot size was determined from the TEM micrographs and the number density was calculated using the mass of silver obtained from the EDS analysis and the dot sizes. Interestingly, all the calculated values from the silica particles with different sizes, as well as with completely different total CSs (gray markers), are on the same line, with the number density approximately inversely proportional to the dot size. The size of the silver dots varies between approximately 1 and 10 nm. If we extrapolate the line to larger dot sizes, eventually maximum packing density is reached, that is, all the silver spheres are in contact with their neighboring particles. Based on this study, we can only speculate whether a silver shell structure would be formed on the silica cores. In order to reach the maximum packing density, higher evaporation temperatures are required. Based on the available data, we estimate that this critical temperature for the size-selected silica particles is approximately , resulting into a silver shell with a thickness of approximately 12 nm.
FIG. 8. (a) The number density of the decorative silver dots on a silica particle as a function of the diameter of the silver dots. (b) The diameter of the silver particle on a titania particle as a function of the evaporation temperature. In both figures, the open and gray markers represent results calculated from particles with and without the DMA selection, respectively.
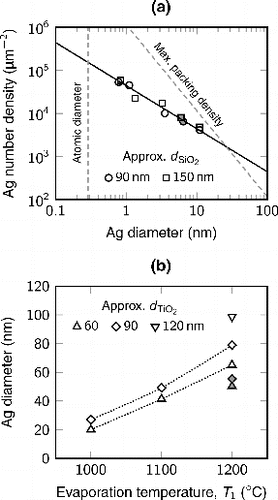
For the titania particles, we calculated the mass equivalent size of the formed silver particles from the EDS measurements. The calculated size of the silver particles was consistent with the TEM micrographs. b shows this diameter as a function of the evaporation temperature for titania carrier particles with different diameters and total CSs. Besides the evaporation temperature, the size of the silver particles increases with larger titania particles and lower total CS. This shows that the particle sizes of both materials, titania and silver, can be independently tuned in the composite doublet particles. Here, the size of the silver particles on the titania particles varied from approximately 20 to 100 nm.
The amount of the silver coating on an individual carrier particle depends on the amount of silver vapor, the size of the carrier particle, and the total CS of the carrier aerosol particles. In Figure a, the mass of silver in an individual approximately 90 nm silica and titania particle is presented as a function of the vapor pressure of silver, i.e., the amount of the evaporated silver controlled with the evaporation temperature. The two different carrier particle materials are comparable, as the size of the carrier particles and the total CSs are similar. We can see that for titania, the mass is directly proportional to the silver vapor pressure. For silica, this is not the case. At the lowest evaporation temperature (), the mass of silver on the different materials is quite similar, as seen also from the TEM micrographs (Figure ). With higher temperatures, there is approximately an order of magnitude difference in the silver mass, until at the highest evaporation temperature, the relative difference decreases again. The observed results could be explained with the formation of the different sized silver structures on the silica and titania particles. That is, the condensation rate of silver on the silica carrier particles containing small silver nanodots is limited by the higher effective vapor pressure of silver. As larger silver structures are quickly formed on the titania particles, already at the evaporation temperature of
(Figure ), the condensation rate is no longer limited by this Kelvin effect.
FIG. 9. (a) The mass of silver in a carrier particle as a function of the silver vapor pressure. The particle diameters (approximately 90 nm) and total CSs for both particle materials are similar. The error bars represent the standard deviation of several measurements. (b) The result of a minimization to find out the dependency between the silver mass and the diameter of the titania particle and the total CS. The open and gray markers represent results calculated from particles with and without the DMA selection, respectively.
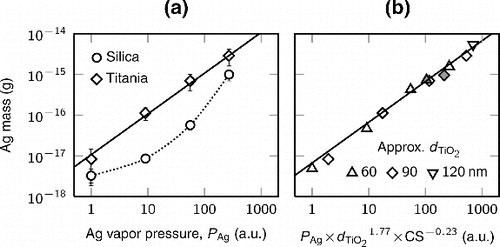
The effect of the size of the carrier particles and the total CS for the mass of the silver coating on the titania particles was estimated using a least squares minimization. The minimized expression was[1] where a, b, and c are the output parameters obtained from the minimization. The result derived from the minimization is shown in Figure b. We found that the mass is proportional to the diameter of the carrier particles with a power of 1.77 and to the total CS with a power of −0.23. The former exponent is close to the particle size dependency of the CS near 100 nm (Kuuluvainen et al. Citation2010). Furthermore, the total CS affects the mass in two ways. With higher total CS, the same amount of silver distributes to a larger particle population. However, a larger particle population also reduces the wall losses of the silver vapor. These two effects partially cancel each other, and therefore the dependency is rather small.
3.4. Formation of the Different Particle Morphologies
A schematic illustration showing the proposed routes for the formation of the different particle morphologies is presented in Figure . The TEM micrographs at the lowest evaporation temperature (Figure , ) suggest that the initial particle formation by heterogeneous nucleation and vapor condensation on the silica and titania particles are quite similar. With higher evaporation temperatures, vapor saturation, and thus the beginning of the condensation, is reached earlier. From Figure a, we can estimate that at the evaporation temperature of
, the vapor begins to condensate at a temperature of approximately
. Already at a temperature of
, over 99% of the available vapor has condensed. This temperature is reached between the first and the second heating zone; thus the second zone with the temperature of
acts as a sintering step (residence time approximately 3 s), where the formed silver particles can migrate on top of the carrier particles.
FIG. 10. A schematic illustration of the formation of the ceramic–silver composite particles with different morphologies. (a) The initial steps are similar for both silica and titania carrier particles. Due to the differences in the Ag particle migration on (b) silica and (c) titania, decoration and composite doublets, respectively, are formed.
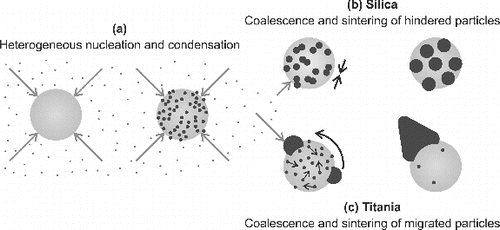
The two different particle morphologies suggest that the silver migration on the silica particles is rather slow compared to that of the titania particles, on which nearly all silver has been collected into a single large particle. Binder et al. Citation(2010) conducted similar sintering experiments for palladium-decorated silica and titania particles, and found that the palladium particles grew faster on titania. They speculated that the rougher surface of the amorphous silica compared to that of the titania could hinder the palladium particle migration or even trap the particles. Especially, pores with sizes equivalent to the diameter of the decorative dots can increase their stability during the sintering (Bartholomew Citation2001). From Figure , we saw that the silver particle number density on silica decreased with the size of the Ag particles. Therefore, some particle migration, even though hindered, could be expected to have occurred in our system. In the case of palladium on silica, an increase in the particle size of approximately 50% was observed at (Binder et al. Citation2010). Gold particles, on the other hand, remained stable on silica at temperatures under
(Boies et al. Citation2011). As it is challenging to estimate the sizes of the possible pores on the silica particles, thorough comparison with other studies might be difficult.
In the case of titania carrier particles, Binder et al. Citation(2010) found that the size of the palladium dots had approximately doubled at a sintering temperature of , nevertheless, maintaining their original decorated morphology. As palladium has considerably higher melting point than silver, we could expect that palladium particles are more stable on a support than silver (Bartholomew Citation2001). Also, as an indirect evidence of the particle migration, the TEM micrographs (Figure , T1 = 1000–
) clearly show approximately 10 nm silver particles merging into larger silver structures. In order to estimate whether the particle migration of such large particles is indeed relevant in our system, we can calculate the diffusion coefficient for a spherical 10 nm particle using the derivation presented for example by Harris Citation(1995). With the literature values collected by Gontier-Moya et al. Citation(2004), the diffusion coefficient of a 10 nm silver and palladium particle at
receives values of 2 × 10⁻⁹ and 7 × 10⁻¹⁵ cm2s−1, respectively. As a consequence, the migration distance in a time period of 3 s for silver and palladium particles could be estimated to be approximately 1.5 μm and 3 nm, respectively. Thus, in the light of these values, it is likely that the migration of the silver particles is the key factor controlling the particle morphology. Furthermore, the migration of silver particles is considerably faster than that of palladium particles, and therefore with silver on titania, the decorated morphology is not maintained. Instead, the silver forms larger structures through particle collisions and subsequent coalescence.
The silver particles observed on titania have a variety of different shapes, such as triangular, rodlike, and hexagonal (Figure ). Similarly shaped metal particles on ceramic supports have been reported in earlier studies as a consequence of sintering (Wynblatt Citation1976; Kim and Ihm Citation1985; Harris Citation1986). Harris Citation(1995) suggested that such shapes are formed by the abnormal growth of twinned structures, resulting from the coalescence of single crystals. Thus, the presence of these structures also implies that particle migration is really the key factor for the different particle morphologies. All in all, our coating process includes simultaneous condensation of new material on the carrier particles and on existing silver structures. The condensation rate is most likely affected by the size of the different silver structures, as speculated with Figure . In addition, metal–substrate related interactions between the formed silver particles and the ceramic carrier particle affect the particle migration and sintering. With the current coating setup, the complete distinction between all these different processes might be challenging.
4. CONCLUSIONS
Ceramic–silver composite nanoparticles were synthesized with a physical coating process. Silver was evaporated and condensated on silica and titania carrier particles in a tubular furnace flow system. The homogeneous nucleation of the evaporated silver vapor was avoided by optimizing the temperature gradient in the furnace system. The effect of the carrier particle material, particle size, total CS, and evaporation temperature on the formed silver coating was investigated.
We found that the different ceramic carrier particle materials, amorphous silica and crystalline titania, resulted in completely different coating morphologies. Typical silver-decoration was formed on the silica particles. Interestingly, the number density of the decorative silver dots on the silica was inversely proportional to the diameter of the dots. The dot size increased with the evaporation temperature from less than 1 to over 10 nm. Furthermore, the results suggest that a core–shell structure could form on the silica when using higher evaporation temperatures than in this study ().
On the titania carrier particles, the silver coating formed substantially larger nanostructures, with sizes ranging from approximately 20 to 100 nm, thus forming titania–silver composite doublets. Furthermore, it was possible to independently tailor the particle sizes of the two materials. The size of the silver particles increased with the evaporation temperature and carrier particle size, and decreased with the total CS of the carrier particles. The large silver structures consisting of different shapes, including triangular, rodlike, and hexagonal, suggest that the silver particles on the crystalline titania have grown due to the particle migration and coalescence. In the case of the amorphous silica, the rougher surface structure hindered the particle migration.
The coating process of ceramic carrier particles with silver used in this study is purely physical, and thus no chemical precursors are required. Furthermore, the amount of the coating material achieved is substantially larger than with the physical coating processes that rely on the coagulation of smaller metal particles and larger carrier particles. In addition, here the homogeneous nucleation of the coating material was avoided. We expect that the synthesized silica/titania–silver composite particles are relevant in different nanotechnology applications, such as optical, catalytic, and antibacterial.
FUNDING
Juha Harra acknowledges the TUT’s graduate school for financial support.
REFERENCES
- Ahonen, P. P., Joutsensaari, J., Richard, O., Tapper, U., Brown, D. P., Jokiniemi, J. K., and Kauppinen, E. I. (2001). Mobility Size Development and the Crystallization Path during Aerosol Decomposition Synthesis of TiO2 Particles. J. Aerosol Sci., 32(5): 615–630.
- Alcock, C. B., Itkin, V. P., and Horrigan, M. K. (1984). Vapour Pressure Equations for the Metallic Elements: 298–2500K. Can. Metall. Quart., 23(3): 309–313.
- Arffman, A., Kuuluvainen, H., Harra, J., Vuorinen, O., Juuti, P., Yli-Ojanperä, J., Mäkelä, J. M., and Keskinen, J. (2015). The Critical Velocity of Rebound Determined for Sub-micron Silver Particles with a Variable Nozzle Area Impactor. J. Aerosol Sci., 86: 32–43.
- Arffman, A., Yli-Ojanperä, J., Kalliokoski, J., Harra, J., Pirjola, L., Karjalainen, P., Rönkkö, T., and Keskinen, J. (2014). High-resolution Low-Pressure Cascade Impactor. J. Aerosol Sci., 78: 97–109.
- Aromaa, M., Arffman, A., Suhonen, H., Haapanen, J., Keskinen, J., Honkanen, M., Nikkanen, J.-P., Levänen, E., Messing, M. E., Deppert, K., Teisala, H., Tuominen, M., Kuusipalo, J., Stepien, M., Saarinen, J. J., Toivakka, M., and Mäkelä, J. M. (2012). Atmospheric Synthesis of Superhydrophobic TiO2 Nanoparticle Deposits in a Single Step Using Liquid Flame Spray. J. Aerosol Sci., 52: 57–68.
- Aromaa, M., Keskinen, H., and Mäkelä, J. M. (2007). The Effect of Process Parameters on the Liquid Flame Spray Generated Titania Nanoparticles. Biomol. Eng., 24(5): 543–548.
- Backman, U., Tapper, U., and Jokiniemi, J. K. (2004). An Aerosol Method to Synthesize Supported Metal Catalyst Nanoparticles. Synth. Met., 142(1–3): 169–176.
- Bartholomew, C. H. (2001). Mechanisms of Catalyst Deactivation. Appl. Catal. A., 212(1–2): 17–60.
- Binder, A., Heel, A., and Kasper, G. (2007). Deposition of Palladium Nanodots of Controlled Size and Density Onto Surface-Modified SiO2 Particles by an Atmospheric Pressure CVS/MOCVD Process. Chem. Vap. Deposition, 13(1): 48–54.
- Binder, A., Seipenbusch, M., and Kasper, G. (2010). Sintering of Pd Catalyst Particles on SiO2–TiO2 Carrier Particles of Different Mixing Ratios. J. Phys. Chem. C., 114(17): 7816–7821.
- Boies, A. M., Lei, P., Calder, S., and Girshick, S. L. (2011). Gas-Phase Production of Gold-Decorated Silica Nanoparticles. Nanotechnology, 22(31): 315603.
- Eggersdorfer, M. L., and Pratsinis, S. E. (2014). Agglomerates and Aggregates of Nanoparticles Made in the Gas Phase. Adv. Powder Technol., 25(1): 71–90.
- Faust, M., Enders, M., Bruns, M., Bräse, S., Gao, K., and Seipenbusch, M. (2013). Synthesis of Nanostructured Pt/Oxide Catalyst Particles by MOCVD Process at Ambient Pressure. Surf. Coat. Technol., 230: 284–289.
- Goertz, V., Weis, F., Keln, E., Nirschl, H., and Seipenbusch, M. (2011). The Effect of Water Vapor on the Particle Structure and Size of Silica Nanoparticles during Sintering. Aerosol Sci. Technol., 45(11): 1287–1293.
- Gontier-Moya, E. G., Beszeda, I., and Moya, F. (2004). Comparisons of Parameters Involved in Mass Transport and Desorption at the Surface of Noble Metals and Sapphire. Sur. Sci., 566–568: 148–154.
- Haapanen, J., Aromaa, M., Teisala, H., Tuominen, M., Stepien, M., Saarinen, J. J., Heikkilä, M., Toivakka, M., Kuusipalo, J., and Mäkelä, J. M. (2015). Binary TiO2/SiO2 Nanoparticle Coating for Controlling the Wetting Properties of Paperboard. Mater. Chem. Phys., 149–150: 230–237.
- Harra, J., Mäkitalo, J., Siikanen, R., Virkki, M., Genty, G., Kobayashi, T., Kauranen, M., and Mäkelä, J. M. (2012). Size-Controlled Aerosol Synthesis of Silver Nanoparticles for Plasmonic Materials. J. Nanopart. Res., 14(6): 870.
- Harra, J., Nikkanen, J.-P., Aromaa, M., Suhonen, H., Honkanen, M., Salminen, T., Heinonen, S., Levänen, E., and Mäkelä, J. M. (2013). Gas Phase Synthesis of Encapsulated Iron Oxide–Titanium Dioxide Composite Nanoparticles by Spray Pyrolysis. Powder Technol., 243: 46–52.
- Harris, P. J. F. (1986). The Sintering of Platinum Particles in an Alumina-Supported Catalyst: Further Transmission Electron Microscopy Studies. J. Catal., 97(2): 527–542.
- Harris, P. J. F. (1995). Growth and Structure of Supported Metal Catalyst Particles. Int. Mater. Rev., 40(3): 97–115.
- Height, M. J., Pratsinis, S. E., Mekasuwandumrong, O., and Praserthdam, P. (2006). Ag-ZnO Catalysts for UV-Photodegradation of Methylene Blue. Appl. Catal. B, 63(3–4): 305–312.
- Järvinen, A., Aitomaa, M., Rostedt, A., Keskinen, J., and Yli-Ojanperä, J. (2014). Calibration of the New Electrical Low Pressure Impactor (ELPI+). J. Aerosol Sci., 69: 150–159.
- Järvinen, A., Kuuluvainen, H., Niemi, J., Saari, S., Dal Maso, M., Pirjola, L., Hillamo, R., Janka, K., Keskinen, J., and Rönkkö, T. (2015). Monitoring Urban Air Quality with a Diffusion Charger Based Electrical Particle Sensor. Urban Climate, doi:10.1016/j.uclim.2014.10.002.
- Kasper, G. (1983). Note on the Slip Coefficient of Doublets of Spheres. J. Aerosol Sci., 14(6): 753–754.
- Keskinen, H., Mäkelä, J. M., Aromaa, M., Ristimäki, J., Kanerva, T., Levänen, E., Mäntylä, T., and Keskinen, J. (2007). Effect of Silver Addition on the Formation and Deposition of Titania Nanoparticles Produced by Liquid Flame Spray. J. Nanopart. Res., 9(4): 569–588.
- Keskinen, H., Mäkelä, J. M., Heikkinen, R., Suopanki, A., and Keskinen, J. (2007). Synthesis of Pd–Alumina and Pd–Lanthana Suspension for Catalytic Applications by One-Step Liquid Flame Spray. Catal. Lett., 119(1–2): 172–178.
- Keskinen, J., Pietarinen, K., and Lehtimäki, M. (1992). Electrical Low Pressure Impactor. J. Aerosol Sci., 23(4): 353–360.
- Kim, K.-T., and Ihm, S.-K. (1985). Sintering Behavior of Nickel Particles Supported on Alumina Model Catalyst in Hydrogen Atmosphere. J. Catal., 96(1): 12–22.
- Krinke, T. J., Deppert, K., Magnusson, M. H., Schmidt, F., and Fissan, H. (2002). Microscopic Aspects of the Deposition of Nanoparticles from the Gas Phase. J. Aerosol Sci., 33(10): 1341–1359.
- Kuuluvainen, H., Arffman, A., Saukko, E., Virtanen, A., and Keskinen, J. (2013). A New Method for Characterizing the Bounce and Charge Transfer Properties of Nanoparticles. J. Aerosol Sci., 55: 105–115.
- Kuuluvainen, H., Kannosto, J., Virtanen, A., Mäkelä, J. M., Kulmala, M., Aalto, P., and Keskinen, J. (2010). Technical Note: Measuring Condensation Sink and Ion Sink of Atmospheric Aerosols with the Electrical Low Pressure Impactor (ELPI). Atmos. Chem. Phys., 10: 1361–1368.
- Lu, Z. G., and Zhu, J. H. (2007). Thermal Evaporation of Pure Ag in SOFC-Relevant Environments. Electrochem. Solid State Lett., 10(10): B179–B182.
- Mädler, L., Roessler, A., Pratsinis, S. E., Sahm, T., Gurlo, A., Barsan, N., and Weimar, U. (2006). Direct Formation of Highly Porous Gas-Sensing Films by In Situ Thermophoretic Deposition of Flame-Made Pt/SnO2 Nanoparticles. Sens. Actuators B, 114(1): 283–295.
- Pfeiffer, T. V., Feng, J., and Schmidt-Ott, A. (2014). New Developments in Spark Production of Nanoparticles. Adv. Powder Technol., 25(1): 56–70.
- Pfeiffer, T. V., Kedia, P., Messing, M. E., Valvo, M., and Schmidt-Ott, A. (2015). Precursor-Less Coating of Nanoparticles in the Gas Phase. Materials, 8(3): 1027–1042.
- Sigmund, S., Yu, M., Meyer, J., and Kasper, G. (2014). An Aerosol-Based Process for Electrostatic Coating of Particle Surfaces with Nanoparticles. Aerosol Sci. Technol., 48(2): 142–149.
- Sotiriou, G. A., Teleki, A., Camenzind, A., Krumeich, F., Meyer, A., Panke, S., and Pratsinis, S. E. (2011). Nanosilver on Nanostructured Silica: Antibacterial Activity and Ag Surface Area. Chem. Eng. J., 170(2–3): 547–554.
- Teoh, W. Y., Amal, R., and Mädler, L. (2010). Flame Spray Pyrolysis: An Enabling Technology for Nanoparticles Design and Fabrication. Nanoscale, 2: 1324–1347.
- Tikkanen, J., Gross, K. A., Berndt, C. C., Pitkänen, V., Keskinen, J., Raghu, S., Rajala, M., and Karthikeyan, J. (1997). Characteristics of the Liquid Flame Spray Process. Surf. Coat. Technol., 90(3): 210–216.
- Wynblatt, P. (1976). Particle Growth in Model Supported Metal Catalysts—II. Comparison of Experiment with Theory. Acta Metallurgica, 24(12): 1175–1182.
- Yli-Ojanperä, J., Mäkelä, J. M., Marjamäki, M., Rostedt, A., and Keskinen, J. (2010). Towards Traceable Particle Number Concentration Standard: Single Charged Aerosol Reference (SCAR). J.Aerosol Sci., 41(8): 719–728.
- Zdanowicz, M., Harra, J., Mäkelä, J. M., Heinonen, E., Ning, T., Kauranen, M., and Genty, G. (2013). Ordered Multilayer Silica-Metal Nanocomposites for Second-Order Nonlinear Optics. Appl. Phys. Lett., 103(25): 251907.
- Zdanowicz, M., Harra, J., Mäkelä, J. M., Heinonen, E., Ning, T., Kauranen, M., and Genty, G. (2014). Second-Harmonic Response of Multilayer Nanocomposites of Silver-Decorated Nanoparticles and Silica. Sci. Rep., 4: 5745.
- Zihlmann, S., Lüönd, F., and Spiegel, J. K. (2014). Seeded Growth of Monodisperse and Spherical Silver Nanoparticles. J. Aerosol Sci., 75: 81–93.

