
Abstract
A comparison between the filter-based, laboratory ion chromatography technique and a semi-continuous analyzer (URG 9000B Ambient Ion Monitor [AIM]) was conducted to evaluate the performance of the AIM in measuring the concentrations of the main airborne ionic species in PM10. The study was carried out in an urban background area of London (UK) in 2013. The two methods showed an overall good correlation (R2 > 0.83) for nitrate, sulfate, chloride, ammonium, and magnesium and poor correlation was found for sodium, potassium, and calcium (R2 < 0.50). The AIM gave consistently higher concentrations for sodium and potassium, possibly due to a positive bias within the sampling unit. During high concentration episodes, both the efficiency of the particle extraction and removal of gases by the denuder may be reduced. A HEPA filter test demonstrated that the denuder was removing gaseous components effectively but that there was some potential for contamination. Overall, the AIM was found to be a good instrument for measuring hourly anion and cation concentrations in PM10 in urban sites.
Copyright 2015 American Association for Aerosol Research
1. INTRODUCTION
Atmospheric aerosol particles consist of many chemical species, including organic compounds, elemental carbon, water, metals, ammonium, nitrates, sulfates, and sea-salt (Seinfeld and Pandis Citation2006). Particles play an important role in the chemistry and physics of the atmosphere: they decrease visibility, they change cloud properties, and scatter solar radiation (Seinfeld and Pandis Citation2006). In addition, they have a major impact on air quality and human health (Pope and Dockery Citation2006). Inorganic compounds (nitrates, sulfates, calcium salts, and sodium chloride) have been estimated to contribute 51% of PM10 overall at a background site in the UK, rising to 64% during episode conditions (Yin and Harrison Citation2008). To comply with the European Directive 2008/50/EC (European Parliament and Council Citation2008), the UK is required to measure the concentration of chloride, sulfate, nitrate, sodium, ammonium, potassium, magnesium, and calcium in the PM2.5 fraction in the rural environment. Under this Directive, member states can subtract the contributions from natural sources when assessing compliance with air quality limit values; measurements of sodium and chloride are key to reducing the uncertainty in these assessments. These water soluble inorganic ions have been determined in the UK by collecting atmospheric particulate on filters, followed by analysis of extracted particles in water by ion chromatography (IC) (Abdalmogith and Harrison Citation2006; NPL REPORT AS 65 Citation2011). However, this well-assessed and most used method is both labor intensive and limited in its time resolution; furthermore the time required to process the samples, extract, and analyze introduces a significant delay in reporting measurements. Finally, both positive and negative artifacts can occur on filter media; the most common concerning inorganic compounds are the evaporation of ammonium nitrate (negative artifact) and the adsorption of nitric acid gas (positive artifact) during or after the sampling (Vecchi et al. Citation2009).
To automate the chemical analysis of these water soluble inorganic species and to meet the need of higher time resolution information of aerosol composition, several semi-continuous analyzers have been developed in the last decade for both organic (Birch Citation1998; Jayne et al. Citation2000; Sorooshian et al. Citation2006; Ng et al. Citation2011) and inorganic aerosol species (Khlystov et al. Citation1995; Weber et al. Citation2001; Moon et al. Citation2006; ten Brink et al. Citation2007; Godri et al. Citation2009). Aerosol mass spectrometer (AMS) technology (Jayne et al. Citation2000) has the advantage of measuring all non-refractory aerosols including inorganic and organic components; however, its particle size cut-off is limited at PM1 and it is unable to measure refractory aerosols such as sodium chloride. Several instruments have been developed to measure soluble inorganic aerosol species (e.g., NO3−, SO42−, Cl−, and NH4+) and their associated precursor gases (HCl, SO2, HNO3, NH3) in PM2.5 and/or PM10 at a high time resolution based on IC. The particle-into-liquid sampler (PILS; Weber et al. Citation2001) coupled with an IC combines two aerosol technologies—particle growth in a mixing condensation particle counter and droplet collection by a single jet inertial impactor—and takes advantage of the principle of steam-jet aerosol collector (SJAC; Khlystov et al. Citation1995). Other methods based on the same principle are the Dionex gas particle ion chromatography (GPIC; Godri et al. Citation2009), the MARGA air monitor (measuring aerosol and gases; ten Brink et al. Citation2007), and the series of URG 9000 (A-D) Ambient Ion Monitors (Moon et al. Citation2006). These IC methods have the advantage over the AMS technology of capturing all the soluble compounds of interest for size fractions greater than PM1. Moreover they have the capability of speciating specific organic species, i.e., organic acids. These are of importance as they serve as tracers for specific processes like cloud formation or biomass burning (Sorooshian et al. Citation2010).
A number of comparison exercises have been carried out in order to evaluate the performance of these analyzers in PM2.5. A study conducted in an urban site in New York has investigated the performance of four semi-continuous analyzers for measuring sulfate in PM2.5 (Drewnick et al. Citation2003): the AMS and the PILS, the R&P 8400S sulfate monitor (Stolzenburg and Hering Citation2000) and the HSPH continuous sulfate monitor (Allen et al. Citation2001). The results showed that the four analyzers compared with each other very well (R2 > 0.9). The comparison with the filter measurements was also linear (R2 0.86–0.98), however the analyzers measured about 85% of sulfate mass on the filters. A combination of positive artifacts on filters and negative biases of the semi-continuous analyzers (i.e., inlet lines losses, limited collection efficiency for small particles) was suggested to explain this deviation. A similar comparison was conducted on ammonium concentrations, the same site in New York and a rural site, using AMS, PILS, and a wet scrubbing long path absorption photometer (Bae et al. Citation2007). The correlation with the filters resulted in R2 values above 0.9 but on average the semi-continuous analyzers reported lower ammonium concentrations than the filters. Other comparisons carried out using the PILS in Houston (Texas) by Orsini et al. Citation(2003) and in Helsinki (Finland) by Timonen et al. Citation(2011), respectively in PM2.5 and in PM1, have showed a good correlation for sulfate and ammonium (R2 > 0.86 and slope > 0.9 PILS versus filters). However, the agreement for nitrate was poor in both cases, showing scattered data and low correlation factors. Nitrate losses from filters and concentrations near the detection limit have been identified as possible causes of these discrepancies. The work in Helsinki also included chloride, sodium, and potassium measurements, but given the very low concentrations observed in PM1, no statistically significant conclusions could be drawn. An evaluation of the URG 9000B AIM was undertaken in Shanghai and Beijing (China) for PM2.5 sulfate and nitrate measurements (Wu and Wang Citation2007). This showed a good agreement in clean to moderately polluted conditions (SO2 < 30 ppbv, sulfate < 20 μg·m−3, and nitrate < 15 μg·m−3). Some modifications made to the AIM (i.e., reducing the sampling flow rate and changing the denuder liquid) were effective in reducing underestimation and overestimation problems found in measuring these two species (Nie et al. Citation2010). In more recent work, a comparison for all the species measured using the URG 9000B AIM has showed excellent correlation for chloride, nitrate, sulfate, ammonium, and potassium (R2 = 0.84–095 and slope = 0.83–1.08 AIM versus filters) and good correlation for fluoride, sodium, magnesium, and calcium (R2 = 0.46–0.90 and slope = 0.83–1.08; Gao et al. Citation2011). Only one study was identified that compared the MARGA analyzer and the conventional filter sampling method for PM10 ion concentrations (Makkonen et al. Citation2012); here a good correlation was found for chloride, nitrate, ammonium, and sulfate (R2 = 0.77–0.98, slope = 0.72–0.91) and poor for sodium (R2 = 0.55, slope = 0.45). A good correlation but very large slopes were found for magnesium and calcium (slope = 3) and not enough data above the detection limit were collected for potassium.
These studies have shown an overall good performance of these instruments in measuring the main ionic species in the fine fraction, such as sulfate. However, except for the study involving the MARGA analyzer, no other work has been done on the comparison between a semi-continuous analyzer and the filter sampling method in the PM10 fraction. Sodium, sulfate, chloride, magnesium, and calcium can be found predominantly in the coarse fraction (PM10-2.5) as they are generated from mechanical processes (e.g., sea-salt evaporation and resuspension of soil dust). The comparability of results for nitrate may be variable as it can be found in both the fine and the coarse fraction depending on the air mass history and atmospheric conditions at the time. Fine nitrate is usually present as ammonium nitrate formed from the nitric acid/ammonia reaction, while coarse nitrate is the product of coarse particle/nitric acid reactions (Seinfeld and Pandis Citation2006).
In the UK the MARGA is currently used in two rural sites to comply with European Directive 2008/50/EC (European Parliament and Council Citation2008). Meanwhile, the URG 9000B is used at one urban-background and one near-road location in London to provide information on the composition of urban aerosols and inform policy development. In this work, the results of the first comparison between the URG 9000B Ambient Ion Monitor and the filter-based method will be presented for PM10 anion and cation measurements for the urban-background location in London. The aim of this study is to compare the URG and filter-based methods for PM10, which is a novel application for this instrument, and assess the continuity of this automated method with the previously used filter-based method.
2. EXPERIMENTAL: MATERIAL AND METHODS
2.1. Site Location
The measurements were conducted in an air quality monitoring station in North Kensington, London (51.52/−0.21). The monitoring station is located within a self-contained cabin in the grounds of a school; the nearest road is a quiet residential street approximately 5 m from the monitoring station. The surrounding area is mainly residential. The site is part of the London Air Quality Network and it is considered an urban background site; gaseous and PM measurements from this site have been reviewed extensively (Bigi and Harrison Citation2010). The measurements reported in this work and the filter sampling were carried out during 2013 as part of the UK Airborne Particulate Concentrations and Numbers Network. Prior to 2011, daily PM10 ion measurements in this network were determined using the filter method for anion concentrations only (chloride, nitrate, and sulfate).
2.2. Daily Filter Measurements
Twenty-four-hour filter sampling was carried out by using a Thermo Scientific Partisol 2025 sampler with a flow rate of 16.7 l/min to collect PM10 onto filters. Ultra-pure quartz filters (PALLFLEX, type Tissuequartz 2500QAT-UP) were used for all measurements. The filters sampled as part of the Network are normally analyzed for organic and elemental carbon content, hence the choice of the filter material; these filters are heat-treated by the manufacturer. Additional analysis by ion chromatography on some of these filters was done exclusively for the purpose of this comparison. All the laboratory analysis was carried out at NPL (National Physical Laboratory), which has ISO/IEC 17025 accreditation for this method. Thirty-three filters were analyzed, which were not sampled on consecutive days but rather chosen to cover as evenly as possible the whole year (January 2013–December 2013). The aim was for approximately one filter per week but, because of some gaps in the AIM data, it was not possible to analyze 52 filters. A Thermo Scientific (Dionex) ICS-1500 IC system was used for the analysis of chloride (Cl−), nitrate (NO3−), and sulfate (SO42−) on filters. The IC consisted of an IonPac AG and AS 14A column set and the eluent used was 11 mM Na2CO3 (sodium carbonate) and 2 mM NaHCO3 (sodium bicarbonate). The cation analysis was performed with an ICS-2100 system to measure sodium (Na+), ammonium (NH4+), potassium (K+), magnesium (Mg2+), and calcium (Ca2+), provided with a methanesulfonic acid (MSA) eluent generator. The column set used was IonPac CG and CS16. All the solutions (standard and sample solutions) were prepared gravimetrically in cleaned polypropylene lab-wear using D.I. water (18.2 MΩ cm). The standard solutions were prepared using traceable stock-certified solutions. The sampled filters were sub-sampled by cutting them in half using ceramic scissors (Brown and Keates Citation2011). The filter extraction was performed in 20 ml of D.I. water (18.2 MΩ cm) in an ultrasonic bath for 30 min. The anion and cation IC systems can work in tandem, which means that each sample vial was analyzed from both systems simultaneously. The uncertainty for the ambient concentrations is about 12% for all species at the 95% confidence level (Brown and Edwards Citation2009) and the limit of detection is 0.06, 0.04, 0.02, 0.05, 0.02, 0.02, 0.04, and 0.08 µg/m3 for, respectively, Cl−, NO3−, SO42−, Na+, NH4+, K+, Mg2+, and Ca2+.
2.3. Hourly Measurements: URG 9000B – AIM
The hourly anion and cation measurements were carried out using a URG-Ambient Ion Monitor (AIM) 9000B. This instrument can perform highly time resolved measurements of the main ionic components of ambient air in particulate phase only: Cl−, SO42−, NO3−, Na+, NH4+, K+, Mg2+, and Ca2+.
2.3.1. Sampling System
The sampler draws a volumetric flow (3 l/min), controlled using the pressure drop across an orifice, along with the orifice temperature, ambient temperature, and pressure. The sample passes adjacent to a membrane-based liquid diffusion denuder (Takeuchi et al. Citation2004), where interfering acidic and basic gases are removed by using a 5.5 mM of H2O2 solution. In order to achieve high collection efficiencies, the particle-laden air stream next enters the aerosol super saturation chamber to enhance particle growth. An inertial particle separator collects these enlarged particles, which are filtered and stored in an aerosol sample collector until the particles can be injected into the ICs. The instrument samples for 55 min during each hour, then analyses the collected sample; the analysis takes 15 min. It is a two-stage instrument, analyzing the previous sample while it is collecting the current sample. Therefore, the instrument allows the production of hourly averages for all relevant anions and cations, dramatically improving the science outputs. The sampler is manufactured to have a PM2.5 cyclone at a flow rate of 3 l/min. For consistency with the previous PM10 anion filter-based measurements in the Network, and to gain a better understanding of the particulate composition in the EU-regulated PM10 size fraction, the instrument was supplied with a size selective PM10 monitoring head. A total flow of 16.7 l/min was drawn into the system and a flow splitter installed before the denuder to allow 3 l/min flow into the sampler. The penetration efficiency of the denuder has been tested for particles of aerodynamic diameter range of 0.38 to 3.48 μm and at an air flow rate of 1 and 2 l/min, reporting a particle loss of 1.79% (Takeuchi et al. Citation2004). The particle loss for larger aerodynamic diameters and higher flow rate is currently unknown. Khlystov et al. Citation(1995) found that the efficiency of the steam-jet aerosol collector is more than 99% for particles in the size range of 0.019 to 0.886 µm, but no data could be found for larger particles.
2.3.2. IC Measurements
The sampler is used together with Dionex 2000 ICs using AS/AG 18 analytical and guard columns with potassium hydroxide eluent (KOH) for the anion system and CS/CG 16 analytical and guards column with methanesulfonic acid (MSA) eluent for the cation system. Calibrations of the ICs were performed regularly by injecting six mixed anion and cation standards (including a H2O blank) into the corresponding IC system through the injection valves. When the instrument was installed in February 2011, a concentrator was used instead of a sample loop. Concentrator columns are short columns that contain a stationary phase that is identical or similar to the analytical column used for the analysis. The function of a concentrator column is to “strip” ions from a measured volume of a relatively clean aqueous sample matrix. This process concentrates the desired species, which leads to lower detection limits. However, a few issues arose during the first two years of operation, mainly related to saturation in the column during PM pollution episodes. It has also been shown that with the use of a concentrator in the AIM analyzer, reported ambient concentrations could be biased low by 9–26%, depending on the species (Markovic et al. Citation2012). For these reasons, a 340 μl sample loop was installed on both anion and cation systems and used for this comparison. It is noteworthy that a comparison for the anion species only was performed in 2011 when this AIM analyzer was first installed. The comparison in that case was poor, with R2 ranging from 0.32 to 0.65. The change from the concentrator to the sample loop significantly improved the quality of the anion data.
The overall uncertainty of the ambient concentrations has been found to be around 10%, taking into account the uncertainty in determining the mass of each species, the volume of the solution collected, and the flow rate of the AIM sampler. This is in agreement with previous work (Zhou et al. Citation2009). This uncertainty does not include the efficiency of the denuder and of the particle extraction system, which are currently unknown, as described in the previous section. The limit of the detection reported by the manufacturer is 0.1 µg·m−3 for all species.
3. RESULTS AND DISCUSSION
To evaluate the performance of the AIM, the hourly concentrations were averaged to compare with the daily concentrations obtained from the filter samples. Both instruments ran for 24 h each day. presents the total average concentrations of the particulate ionic species for the two methods.
TABLE 1 Statistics of the particulate ion components measured by the AIM and the filter-based method
When compared with the filters, the AIM showed substantially higher concentrations for Na+, K+, and NH4+. and show the time series from both methods and the scatter plots between the two measurements. The reduced major axis (RMA) method (Hirsch and Gilroy Citation1984) was chosen for calculating the linear fits rather than the ordinary least squares (OLS) regression. The RMA method is recommended when both variables are subject to measurement errors and are independent, as it is common in air quality analysis (Ayers Citation2001).
FIG. 1. Time trends of PM10 daily ion filter measurements and PM10 daily averaged ion AIM measurements.
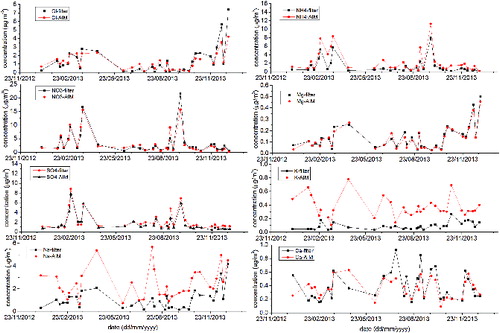
FIG. 2. Scatter plots between PM10 daily filter measurements and PM10 daily averaged AIM measurements. The linear regressions were calculated using the RMA method (Hirsch and Gilroy Citation1984). The RMA method is used when both variables are subject to measurement errors and are independent.
Excellent correlations were found for NO3− and SO42− and Mg2+ (R2 = 0.90–0.96). Good correlations were also found for NH4+ (R2 = 0.89) and Cl− (R2 = 0.83). Lower correlations (R2 < 0.50) were found for K+, Na+, and Ca2+. Despite the good correlation, NH4+-AIM concentrations were higher than those found on the filters by approximately 40%. The loss of NH4+ (and NO3−) from the filters is an accepted negative artifact of sampling on filters (Chow et al. Citation2005). However, the better comparison for NO3− showed this cannot be the reason. Moreover, there is also a possibility of evaporation of semi-volatile species in steam collection devices, as described in the study carried out by Sorooshian et al. Citation(2006). The excess NH4+ measured could be attributable to the incomplete removal of NH3 by the denuder. HEPA filter blanks, illustrated later in this section, suggest that this may not be the case. However, recent tests using expected NH4+, calculated from NO3− and SO42− concentrations, showed that the calculated and measured NH4+ clearly agree better after a new denuder was installed, which occurs about every two weeks. The HEPA filter test was carried out soon after changing the denuder and the HEPA filter was left in place for only three days. This would indeed suggest a breakthrough of NH3 through the denuder. Further, HEPA filter tests will be carried out to prove the breakthrough of NH3 after few days of use of the denuder. Although the Cl− correlation can also be described as good, the increased variability could be due to either the high and variable content of Cl− on quartz filters (Wieprechta et al. Citation2004) or loss of volatile NH4Cl (Witz et al. Citation1990; Liu et al. Citation2014). The discrepancy between the two methods is larger toward the end of year, where high values of Cl− were found on the filters as consequence of high concentrations of sea-spray in air. Low denuder penetration efficiency for coarse PM could be a reason for such discrepancy. The efficiency for particles larger than 2.5 µm has not yet been tested.
The lack of correlation for K+ was thought to be due to the K+ extracted from the filters being very close to the LOD. A test using a larger sample loop (100 μl instead of the previous 25 μl loop) showed an improvement in correlation (R2 = 0.68) between the two methods but the slope was still larger than 2. The very low K+ concentrations found at this site are still the main possible reason of discrepancy.
The correlation for Ca2+ is also poor (R2 = 0.48). However, if the first 11 points are removed from the dataset, the R2 for Ca2+ increases to 0.68. An instrument service was carried out around the time the correlation starts to get better, which could explain the improvement in the data quality. The service mainly includes the replacing of the sample line and the cleaning of the sample syringes. Possible Ca2+ contamination could have been present in these parts of the sampler. Ca2+ compounds are also difficult to measure accurately with IC due to the low solubility in water of these compounds. The different particle extraction procedures from the two methods should also be taken into account.
Higher Na+ concentrations than expected are found when using the AIM instrument and the R2 was 0.44. It can be noted that the trends generally follow each other, but the AIM concentrations are significantly higher. Possible sources of contamination in the sampler are being investigated. Na+ is more ubiquitous than other ions and therefore more prone to contamination. This instrument is left unattended in the field for long periods (about two weeks) and therefore any possible contamination is difficult to identify promptly. Furthermore, de-ionized water is currently taken to site from the laboratory every four weeks, increasing the chance of contamination. The recent installation of a de-ionizer in the monitoring site will make sure fresh de-ionized water is fed continuously into the instrument on a daily basis.
The results found in this comparison are in slight disagreement with the results found in previous work carried out using a URG 9000B (AIM) (), fitted with the original PM2.5 cyclone, in Jinan, China (Gao et al. Citation2011). In that case a better correlation was found for K+ (R2 = 0.94), but worse for Mg2+ (R2 = 0.46). It should be noted that the K+ concentrations found in Jinan were significantly higher than the concentrations found in this work. The annual average was 2.36 μg·m−3, with the average in summer being 4.62 μg·m−3 and in winter 3.07 μg·m−3. These concentrations were attributed to biomass burning in summer and coal combustion in winter. The averages in spring and autumn were, respectively, 1.32 μg·m−3 and 1.44 μg·m−3. On the other hand, despite the similar annual average found for Mg2+ (0.11 μg·m−3), contribution from sea-salt in China is rare and it is mostly due to crustal and soil dust. In this work, the good correlation between Cl− and Mg2+ (R2 = 0.82 for the AIM measurements and R2 = 0.90 for the filter measurements) shows that sea-salt is the main source of Mg2+ in London. Therefore, the performance of the AIM could differ depending on the level of concentrations and environment. The correlation for Na+ and Ca2+ were to some degree better than the correlation found in this work (R2 = 0.56 for Na+ and R2 = 0.58 for Ca2+).
TABLE 2 Intercomparison results of the AIM URG 9000B and the MARGA with the filter-based method for all the ions
The results from this work were also compared with the results found during a campaign using the MARGA analyzer with a PM10 head (). The work was carried out in an urban background location about 5 km northeast of the center of Helsinki (Finland). The best correlations were found for Cl− (R2 = 0.83), NO3− (R2 = 0.93), SO4− (R2 = 0.98), and NH4+ (R2 = 0.83). Better correlations with respect to the AIM were found for Na+ (R2 = 0.55) and Ca2+ (v2 = 0.86) but not for Mg2+ (R2 = 0.69).
The offsets of the linear fits are generally large (Cl− 0.39 µg m−3, NO3− 0.20 µg m−3, Na+ 0.87 µg m−3, Ca2+ 0.10 µg m−3, K+ 0.12 µg m−3, NH4+ 0.51 µg m−3), except for Mg2+ (−0.001 µg m−3) and SO42− (−0.26 µg m−3). The standard calibration procedure of the AIM instrument involves an offline calibration of the ICs, injecting standard solutions into the injection valves, and by passing entirely the sampling system. Therefore, any contribution from the sample collection unit to the measurement would not be taken into account during calibration. To quantify the impact of the sampling system on the measurements, a HEPA filter was connected on the top of the inlet system during normal operation and left for 70 h. show the concentration trends over the time of the test.
FIG. 3. A HEPA filter test was performed to evaluate any contribution of the sampler to the offsets. A HEPA filter was connected to the sampling inlet and left for 70 h before removing it. (a) shows anion trends during the HEPA test and (b) shows the cation trends.
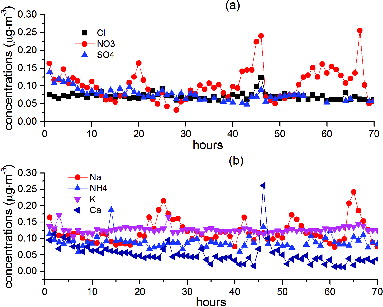
The concentrations decrease during the first few hours, as expected, but show some fluctuations over time, especially for Na+. The average concentrations, excluding the first 2 h to allow system stabilization, were 0.07, 0.10, 0.07, 0.12, 0.09, 0.13, 0.05 µg·m−3, respectively, for Cl−, NO3−, SO42−, Na+, NH4+, K+, and Ca2+. The LOD of the AIM declared by the manufacturer is 0.1 µg·m−3 for all species, therefore, except for Na+ and K+, the concentrations during the HEPA filter test are at or below the LOD. This demonstrates that (except for Na+ and K+) there are no significant artifacts induced by the sampling system and that the denuder is effectively removing the gas phase species. However, the NO3− measurements demonstrated a cyclic pattern that correlated well with NOx concentrations from the same monitoring site. This may be due to a breakthrough of HNO3 through the denuder. K+ concentrations have a clear offset of about 0.13 µg·m−3, which coincides with the offset of the linear fit between the AIM-K+ and the filter-K+ measurements. The Na+ concentration measured during the HEPA filter test does not fully address the offset between the filter and AIM measurements; this relationship is likely to be more influenced by contamination of the sampling/analysis system. Although many of these HEPA filter results are low, it is recommended that they are used as a zero correction to the data to account for any bias introduced due to the sampling system. Frequent HEPA filter tests should therefore be performed on these systems to assess any ongoing or variable bias.
An ion balance was calculated for both methods and shown in .
FIG. 4. Ion balance for the filter measurements (a) and the AIM instrument (b).
The relationship between the anions and the cations for the filter method is very close to unity. Underestimation is likely to be due to not measuring all the cations (like H+) and anions (nitrite and oxalate). The more scattered plot for the AIM instead shows that further work is necessary to resolve the issues in the measurements made by this instrument but is likely to be due to the higher NH4+, Na+, and, to a lesser extent, K+ contamination.
4. CONCLUSIONS
Overall, the comparison between the two methods showed that the AIM is a good instrument for measuring the main ionic components in an urban atmosphere at an hourly resolution. In London, where ammonium concentrations can reach 20 µg·m−3, using a concentrator column led to a saturation in the ammonium response. The concentrator column was therefore replaced with a 340 μl sample loop; this reduced the mass of analyte injected onto the column and resolved the saturation problems. However, this has reduced the mass of lower concentration ions, such as K+, which are injected into the IC. As these measurements are designed to understand the major sources of PM in the urban areas, resolution of the more minor species has been sacrificed.
There was also evidence that other ions measured using the AIM, notably NO3−, were underestimated when compared to filter samples. However, after the sample loop modification, elevated concentrations still resulted in AIM concentrations lower than the filter-based method. This is likely to be due to either the accepted positive artifacts on the filter-based method or low penetration efficiency in the denuder for coarse PM.
Any positive filter artifacts effects are less than 10% (the regression slope between the AIM and filter was 0.9). A modified filter sampling protocol, including a denuder, would have been required to explore these discrepancies; this differs from the historic filter sampling protocol which this study was designed to test continuity with.
The penetration efficiency of the denuder remains among the most likely explanations for some of the difference between the two measurement methods due to an underestimation of coarse atmospheric aerosols such as NaNO3, NH4NO3, and NaCl; this needs to be investigated further.
Frequent HEPA filter tests will be the main means in future to identify any contamination in the system that seems to lead to high Na+, and possibly K+, concentrations.
Funding
Funding by the UK Department for Business Innovation and Skills of the National Measurement System's Chemical & Biological Metrology Programme, and by the UK Department for Environment, Food and Rural Affairs of the UK Particle Number and Concentration Air Quality Network, is gratefully acknowledged.
REFERENCES
- Abdalmogith, S. S., and Harrison, R. M. (2006). An Analysis of Spatial and Temporal Properties of Daily Sulfate, Nitrate and Chloride Concentrations at UK Urban and Rural Sites. J. Environ. Monitor., 8(7):691–699.
- NPL REPORT AS 65 (2010). Airborne Particulate Concentrations and Numbers in the United Kingdom (Phase 2) Annual Report. National Physical Laboratory, Teddington, United Kingdom. http://ukair.defra.gov.uk/assets/documents/reports/cat05/1109011413_Particles_Network_Annual_Report_2010_AS_65.pdf.
- Allen, G. A., Harrison, D., and Koutrakis, P. (2001). A New Method for Continuous Measurement of Sulphate in the Ambient Atmosphere. Paper presented at the 20th Annual Conference of the American Association for Aerosol Research, October 15–19, Portland, Oregon.
- Ayers, G. P. (2001). Comment on Regression Analysis of Air Quality Data. Atmos. Environ., 35:2423–2425.
- Bae, M. S., Demerjian, K. L., Schwab, J. J., Weimer, S., Hou, J., Zhou, X., Rhoads, K., and Orsini, D. (2007). Intercomparison of Real Time Ammonium Measurements at Urban and Rural Locations in New York. Aerosol Sci. Technol., 41:329–341.
- Bigi, A., and Harrison, R. M. (2010). Analysis of the Air Pollution Climate at a Central Urban Background Site. Atmos. Environ., 44:2004–2012.
- Birch, M. E. (1998). Analysis of Carbonaceous Aerosols: Interlaboratory Comparison. Analyst, 123(5):851–857.
- Brown, R. J. C., and Edwards, P. R. (2009). Measurement of Anions in Ambient Particulate Matter by Ion Chromatography: A Novel Sample Preparation Technique and Development of a Generic Uncertainty Budget. Talanta, 80:1020–1024.
- Brown, R. J. C., and Keates, A. C. (2011). Spatial Inhomogeneity of Anions in Ambient Particulate Matter Collected on Air Filters: Determination Using a Drift-Corrected Ion Chromatography Technique. Talanta, 84:918–923.
- Chow, J. C., Watson, J. G., Lowenthal, D. H., and Magliano, K. L. (2005). Loss of PM2.5 Nitrate from Filter Samples in Central California. J. Air Waste Manag. Assoc., 55(8):1158–1168.
- European Parliament and Council. (2008). Directive 2008/50/EC of the European Parliament and of the Council of 21 May 2008 on Ambient Air Quality and Cleaner Air for Europe. Off. J. EU, 152:1–44.
- Drewnick, F., Schwab, J. J., Hogrefe, O., Peters, D., Husain, L., Diamond, D., Weber, R., and Demerjian, K. L. (2003). Intercomparison and Evaluation of Four Semi-Continuous PM2.5 Sulfate Instruments. Atmos. Environ., 37(24):3335–3350.
- Gao, X., Yang, L., Cheng, S., Gao, R., Zhou, Y., Xue, L., Shou, Y., Wang, J., Wang, X., Nie, W., Xu, P., and Wang, W. (2011). Semi-Continuous Measurement of Water-Soluble Ions in PM2.5 in Jinan, China: Temporal Variations and Source Apportionments. Atmos. Environ., 45(33):6048–6056.
- Godri, K. J., Evans, G. J., Slowik, J., Knox, A., Abbatt, J., Brook, J., Damn, T., and Dabek-Zlotorzynska, E. (2009). Evaluation and Application of a Semi-Continuous Chemical Characterization System for Water Soluble Inorganic PM2.5 and Associated Precursor Gases. Atmos. Meas. Tech., 2:65–80.
- Hirsch, R. M., and Gilroy, E. J. (1984). Methods of Fitting a Straight Line to Data: Examples in Water Resources. Water Resour. Bull., 20(5):705–711.
- Jayne, J. T., Leard, D. C., Zhang, X., Davidovisit, P., Smoth, K. A., Kolb, C. E., and Worsnop, D. R. (2000). Development of an Aerosol Mass Spectrometer for Size and Composition Analysis of Submicron Particles. Aerosol Sci. Technol., 33:49–70.
- Khlystov, A., Wyers, G. P., and Slanina, J. (1995). The Steam-Jet Aerosol Collector. Atmos. Environ., 29:2229–2234.
- Liu, C. N., Lin, S. F., Awasthi, A., Tsai, C. J., Wu, Y. C., and Chen, C. F. (2014). Sampling and Conditioning Artifacts of PM2.5 in Filter-Based Samplers. Atmos. Environ., 85:48–53.
- Makkonen, U., Virkkula, A., Mäntykenttä, J., Hakola, H., Keronen, P., Vakkari, V., and Aalto, P. P. (2012). Semi-Continuous Gas and Inorganic Aerosol Measurements at a Finnish Urban Site: Comparison with Filters, Nitrogen in Aerosol and Gas Phases, and Aerosol Acidity. Atmos. Chem. Phys., 12:5617–5631.
- Markovic, M. Z., VandenBoer, T. C., and Murphy, J. G. (2012). Characterization and Optimization of an Online System for the Simultaneous Measurements of Atmospheric Water-Soluble Constituent in the Gas and Particle Phase. J. Environ. Monitor., 14:1872–1884.
- Moon, K. J, Han, J. S., Jung, I. R., Kondo, Y., and Miyazaki, Y. (2006). Evaluation of a URG Ambient Ion Monitoring System (AIM) for Measuring Water-Soluble Ion Components of Ambient PM2.5: Intercomparison with PILS-IC Monitor. Paper presented at the Seventh International Aerosol Conference, September 10–15, St. Paul, Minnesota, USA.
- Ng, N. L., Herndon, S. C., Trimborn, A., Canagaratna, M. R., Croteau, P. L., Onasch, T. B., Sueper, D., Worsnop, D. R., Zhang, Q., Sun, Y. L., and Jayne, J. T. (2011). An Aerosol Chemical Speciation Monitor (ACSM) for Routine Monitoring of the Composition and Mass Concentrations of Ambient Aerosol. Aerosol Sci. Technol., 45:770–784.
- Nie, W., Wang, T., Gao, X., Pathak, R. V., Wang, X., Gao, R., Zhang, Q., Yang, L., and Wang, W. (2010). Comparison among Filter-Based, Impactor-Based and Continuous Techniques for Measuring Atmospheric Fine Sulphate and Nitrate. Atmos. Environ., 44:4396–4403.
- Orsini, D. A., Ma, Y., Sullivan, A., Sierau, B., Bauumann, K., and Weber, R. J. (2003). Refinements to the Particle-Into-Liquid-Sampler (PILS) for Ground and Airborne Measurements of Water Soluble Aerosol Composition. Atmos. Environ., 37:1243–1259.
- Pope, C. A., and Dockery, D. W. (2006). Health Effects of Fine Particulate Air Pollution: Lines That Connect. J. Air Waste Manage. Assoc., 56:709–742.
- Seinfeld, J. H., and Pandis, S. N. (2006). Atmospheric Chemistry and Physics. John Wiley, New York.
- Sorooshian, A., Brechtel, F. J., Ma, Y. L., Weber, R. J., Corless, A., Flagan, R. C., and Seinfeld, J. H. (2006). Modeling and Characterization of a Particle-Into-Liquid-Sampler (PILS). Aerosol Sci. Technol., 40:396–409.
- Sorooshian, A., Murphy, S. M., Hersey, S., Bahreini, R., Jonsson, H., Flagan, R. C., and Seinfeld, J. H. (2010). Constraining the Contribution of Organic Acids and AMS m/z 44 to the Organic Aerosol Budget: On the Importance of Meteorology, Aerosol Hygroscopicity, and Region. Geophys. Res. Lett., 37:L21807, DOI: 10.1029/2010GL044951
- Stolzenburg, M. R., and Hering, S. V. (2000). A New Method for Automated Measurements of Atmospheric Fine Particle Nitrate. Environ. Sci. Technol., 34:907–914.
- Takeuchi, M., Li, J., Morris, K. J., and Dasgupta, P. K. (2004). Membrane-Based Plate Denuder for the Collection and Removal of Soluble Atmospheric Gases. Anal. Chem., 76:1204–1210.
- ten Brink, H. M., Otjes, R., Jongejan, P., and Slanina, J. (2007). An Instrument for Semi-Continuous Monitoring of the Size-Distribution of Ammonium Nitrate Aerosol. Atmos. Environ., 41:2768–2779.
- Timonen, H., Aurela, M., Saarnio, K., Frey, A., Saarikoski, S., Teinilä, K., Kulmala, M., and Hillamo, R. (2011). Monitoring of Inorganic Ions, Carbonaceous Matter and Mass in Ambient Aerosol Particles with Online and Offline Methods. Atmos. Meas. Tech. Discuss., 4:6577–6614.
- Vecchi, R., Valli, G., Fermo, P., D'Alessandro, A., Piazzalunga, A., and Bernardoni, V. (2009). Organic and Inorganic Sampling Artefacts Assessment. Atmos. Environ., 43(10):1713–1720.
- Weber, R. J., Orsini, D., Daun, Y., Lee, Y. N., Klotz, P. J., and Brechtel, F. (2001). A Particle-Into-Liquid Collector for Rapid Measurement of Aerosol Bulk Chemical Composition. Aerosol Sci. Technol., 35:718–727.
- Wieprechta, W., Ackera, K., Müllerb, K., Spindlerb, G., Brüggemannb, E., Maenhautc, W., Chic, X., Hitzenbergerd, R., Bauere, H., and Brinkf, H. (2004). INTERCOMP2000: Ionic Constitution and Comparison of Filter and Impactor. Atmos. Environ., 38:6477–6486.
- Witz, S., Eden, R. W., Wadley, M. W., Dunwoody, C., Papa, R. P., and Torre, K. J. (1990). Rapid Loss of Particulate Nitrate, Chloride and Ammonium on Quartz Filters during Storage. Air Waste Manage., 40(1):53–61.
- Wu, W. S., and Wang, T. (2007). On the Performance of a Semi-Continuous PM2.5 Sulphate and Nitrate Instrument under High Loadings of Particulate and Sulphur Dioxide. Atmos. Environ., 41:5442–5451.
- Yin, J., and Harrison, R. M. (2008). Pragmatic Mass Closure Study for PM 1.0, PM 2.5 and PM 10 at Roadside, Urban Background and Rural Sites. Atmos. Environ., 42:980–988.
- Zhou, Y., Wang, T., Gao, X., and Xue, L. (2009). Continuous Observations of Water-Soluble Ions in PM2.5 at Mount Tai (1534 m a.s.l.) in Central-Easter China. J. Atmos. Chem., 64:107–127.