
Abstract
The aerosol particle size distributions of solution-based pressurized metered dose inhalers containing 15%w/w ethanol and different quantities of nonvolatile component (NVC) (drug and glycerol) were evaluated at 25°C and 55°C, using a custom-built heating rig that preheated air prior to aerosolization. Particle size distributions were assessed using an Andersen cascade impactor and mass‐weighted cumulative aerodynamic diameter distributions were compared to a theoretical model that predicts the final size distribution, based on initial droplet size, vapor pressure of the formulation containing HFA 134a and percent NVC. In general, the mass median aerodynamic diameter was proportional to NVC1/3, with experimental particle size distributions following theoretical values. However, when comparing theoretical vs. experimental data over the range of mass-weighted cumulative aerodynamic diameter distributions between 10 and 90%, the 55°C experimental measurements more closely fitted the theoretical equation when compared to 25°C. This was attributed to incomplete drying of some of the larger initial droplets prior to impaction. Additionally, postinduction port measurements of volumetric size distribution using laser diffraction, showed a reduction in median particle diameter at 55°C, compared to 25°C and a change from bimodal to monomodal distribution, indicating complex drying kinetics under ambient conditions.
Copyright 2015 American Association for Aerosol Research
1. INTRODUCTION
The use of liquefied propellants to generate aerosols of a suitable size for respiratory drug delivery dates back to the 1950s (Thiel Citation1996). The use of pressurized metered dose inhalers (pMDIs) to deliver medicaments is now commonplace and both suspension- and solution-based formulations exist for the treatment of respiratory diseases including asthma and chronic obstructive pulmonary disease (Rogueda et al. Citation2012; Myrdal et al. Citation2014). In general, the final aerosol particle size distribution of a suspension-based system will primarily be governed by the properties of the suspended particles; including primary particle size, suspension density, ability to resuspend, and accurately meter the drug during use (Myrdal et al. Citation2014). In comparison, the aerosol particle size distribution of a solution-based pMDI will be primarily dependent on the nonvolatile component (NVC) and the vapor pressure of the formulation (Myrdal et al. Citation2014; Zhu et al., accepted). This governs the initial droplet diameter distribution and based on the mass of nonvolatiles in solution, the density of the residual particles and thus the final MMAD (Lewis et al. Citation2004; Stein and Myrdal Citation2004; Lewis Citation2013). With knowledge of the initial particle size (d0) it becomes possible to calculate the final dried particle aerosol size (d1).
Previous researchers have developed theoretical models for droplet and particle formation from pMDIs and a recent review of these models is presented by Zhu et al. (Zhu et al. Accepted August 19th Citation2014) Of note are the atomization break up models proposed by Dunbar et al. (Dunbar et al. Citation1997) and Clarke (Clark Citation1991) for the formation of primary particles and evaporation kinetics. Furthermore, the influence of cosolvents on vapor pressure and aerosol generation have been studied by a number of researchers (Vervaet and Byron Citation1999; Stein et al. Citation2002; Stein and Myrdal Citation2004) including cosolvent evaporation on the final median aerodynamic diameter and the influence of drying time and temperature (Stein et al. Citation2002; Haynes et al. Citation2004; Stein and Myrdal Citation2004; Stein and Myrdal Citation2006). Here, we focus on the influence of nonvolatile components on the final “maturated” particle diameters collected on cascade impactor stages and compare empirically driven theoretical models with experimental measurements at both ambient and elevated temperatures.
Based on historical analysis of 47 different formulations containing a range of nonvolatile concentrations, ethanol concentrations, and actuator orifice diameters, Lewis et al. Citation(2004) described the mass median aerodynamic diameter (MMAD) of residual particles emitted from HFA 134a solution pMDIs to be directly related to the cube-root of the% w/w of the NVC:[1] where MMAD is the mass median aerodynamic diameter in micrometers. The constant 2.31 takes into account the vapor pressure of HFA 134a and an ethanol concentration of 13–15% w/w; this can be replaced with the value 3.26 when predicting MMAD of particles generated from HFA 227. Furthermore, this model is insensitive to actuator orifice size 0.14–0.42 mm and metering volume 25–100 µl and is based on measurements conducted using an Andersen cascade impactor with USP induction port (Lewis Citation2013; Lewis et al. Citation2004).
Lewis et al. went on to define the percentage of particles that would have a diameter suitable for inhalation (i.e., percentage ≤5 µm or fine particle fraction [%FPF]):[2] where C134a is the amount of HFA 134a (%w/w) in the formulation, a is the actuator orifice diameter in millimeters, and v is the metering volume in microliters. Equation (Equation2
[2] ) takes into consideration the initial plume properties such as plume duration and velocities entering the United States Pharmacopeia (USP) specification induction port or “throat.” It does this by modeling the effects of varying actuator orifice diameter and valve metered volume on FPF, which may respond to changes in plume properties. An overview of actuator-related impact on aerosol formation can be found in the review by Zhu et al. (accepted). In general, smaller actuator orifices and metering volumes produce higher FPF values while the NVC and vapor pressure control the final size of fully dried aerosol particles. This model makes the assumption that ethanol has a limited effect on the vapor pressure in the concentrations used (Lewis et al. Citation2004) and the influence of ethanol on vapor pressure at higher mole fractions would need to be taken into account (Vervaet and Byron Citation1999).
Considering complete drying of the aerosol cloud “post throat,” Lewis predicted the initial droplet size (d0), at any given cumulative undersize (d0,y) for a droplet from an HFA134a solution, based on the MMAD (Lewis Citation2013):[3]
This “initial droplet particle size distribution” described here is based on MMAD values from impactor-classified measurements and does not take into consideration the intrinsic size of particles that are captured in the induction port, which has been shown to have a significant effect on the calculation of initial droplet size (Stein and Myrdal Citation2004). Moreover, the definition of intrinsic particle size is still not clear since flash evaporation of propellant (and presumably some ethanol) occurs prior to exiting the actuator orifice. Recent work by Ivey et al., has recently formalized this terminology and approach through a content-equivalent diameter concept (Ivey et al. Citation2014)
Based on Equation (Equation3[3] ), with knowledge of the final nonvolatile component in the dried particle (NVC1), it becomes possible to predict the final residual aerodynamic particle diameter d1:
[4]
This assumes that NVC1 (in % w/w) contains drug and excipient and not residual solvent, however this can be incorporated into the model if ethanol is present in the final maturated particles. Furthermore, it assumes that the final particle density and morphology are approximately similar to the particles used to develop the empirical model. Thus, combining Equations (Equation3[3] ) and (Equation4
[4] ), the cumulative mass aerodynamic particle size distribution measured by a cascade impactor may be predicted as
[5]
In general, the predicted particle size distribution correlates well with experimental data from studies using Andersen cascade impactors across a number of formulations (Lewis et al. Citation2004; Lewis Citation2013). However, the modeled cumulative distribution may not always fit experimental data well at the higher end of the particle size distribution. (Stein and Myrdal Citation2004, Citation2006; Lewis Citation2013) This maybe due to the MMAD being the key descriptor for development of the theoretical model for predicting size distributions across a wide range of d1 values. Thus, incomplete evaporation of larger droplets during classification in the impactor may cause deviation from the model.
In order to investigate the effect of evaporation rate, and formulation variables on the final post-throat aerosol particle size distributions, a drying rig was constructed to preheat the continuous phase during particle sizing studies. A number of formulations containing varying concentrations of NVC (0.4–1.4%) were then studied using inertial impaction at 25°C and 55°C and the impact of drying on particle size distributions was reported.
2. MATERIALS AND METHODS
2.1. Materials
Budesonide (EP grade) were supplied by Yicheng Chemical Corp. (Jiangsu, China). Glycerol (≥99.99%) was purchased from Sigma-Aldrich (Castile Hills, NSW, Australia). The propellant—1,1,1,2-terafluoroethane (HFA 134a) was supplied by Solvay (Brussels, Belgium). pMDI actuators with an orifice diameter of 0.33 mm and 50 µl metering valves were kindly supplied by Bespak Europe Limited (Norfolk, UK). Pressure-resistant glass canisters were supplied by Saint Gobain plc. (Courbevoie, France). Ethanol (100%), methanol and all other solvents (HPLC grade) were obtained from Biolab (Clayton, Victoria, Australia). Water was purified by reverse osmosis (MilliQ, Millipore, France).
2.2. Formulation of Model Solution Based pMDIs
Budesonide solution pMDI formulations containing 15% (w/w) ethanol and various concentrations of glycerol were prepared as outlined in using a Pamasol Laboratory plant P2016 (Pamasol Willi Maäden AG, Paffikon, SZ). 0.4% w/w budesonide was added to all formulations along with 0–1% glycerol resulting in a% w/w NVC range of 0.4–1.4%. Prior to HFA filling, all components were directly weighed into the canister, which was fitted with the metering valve, crimped and pressure-filled with HFA. All canisters were sonicated for 5 min to ensure miscibility and visually examined prior to study.
TABLE 1 Solution-based pMDI formulations
2.3. Construction and Validation of a Heating Apparatus Coupled to an ACI
In order to evaluate the impact of drying air temperature on particle size distribution, a heating apparatus was developed. The core criterion for the apparatus setup was that air passing the pMDI orifice had reached a set temperature of either 25°C (considered ambient) or 55°C prior to actuation. In order to achieve this, an elongated heating tube was set up prior to the actuator, along with a modified canister seating block and housing that allowed aerosolization into the airflow. In order to estimate the heating power and inlet length required to raise the temperature to the desired profile, it was necessary to calculate the required heat when air was drawn through the Andersen Cascade Impactor (ACI) at 28.3 l/min (the standard airflow stated in the British Pharmacopeia for impactor measurement of pMDIs). Based on heat transfer equations, a stainless steel tube of 38 mm internal diameter and 1.5 m length was chosen and wrapped with a flexible heating element (SR4 600 W, Helios Electroheat Pty Ltd., Seven Hills, Australia) connected to a custom-built power source that could provide a minimum of 257.74 W.M−2. The heating element (Part A) was connected to the actuation block (Part B), which was designed in CAD and manufactured using a 3D printer (Dimension® Elite, Stratasys Ltd., MN, USA) in acrylonitrile butadiene styrene. The whole experimental rig is shown in . The temperature and humidity profiles of inlet air at 55°C were validated using a HygroWin temperature and humidity probe (HC2-WIN-USB, Pryde Measurement Pty. Ltd, Victoria, Australia) placed at the actuation block position. The stainless steel extension tube was preheated at 600 W for 30 min before the pump, preset to 28.3 l/min, was started. Time to equilibration of temperature and humidity were recorded. Based on the temperature and humidity profiles (), a 10-min waiting time after starting the pump was deemed sufficient prior to actuation of the pMDI. It is important to consider that there is a difference in humidity between the two experimental temperatures (40% RH vs. 10% RH), however previous studies by Shemirani et al., (Shemirani et al. Citation2013) have shown in vitro throat and lung fractions of solution pMDIs to be unaffected by a wide range of humidities (0–80% RH) at two temperatures (20 and 40°C) using the flow rate studied here. The pMDI was not inserted into the assembly until aerosol measurements were conducted to avoid heating the canister and valve components.
FIG. 1. Photograph of the inlet air heating assembly (a) and cross-sectional view of canister housing and actuation block (b) connected to an eight-stage Andersen cascade impactor with standard USP induction port.
FIG. 2. Temperature and humidity profiles at the actuator block downstream from the inlet air heating assembly.
2.4. Andersen Cascade Impactor Measurements
An eight-stage Andersen Cascade Impactor (ACI) (Copley Scientific Ltd., Nottingham, UK) was used to study the aerodynamic aerosol performance of each solution-based pMDI formulation. A United States Pharmacopeia (USP) induction port was coupled to the impactor. The whole system was connected to the modified inlet assembly and the outlet port of the impactor was connected to a vacuum pump that was calibrated at 28.3 l/min (±2 l/min, Pharmacopeia standard) using a flowmeter (TSI 3063, TSI Instruments Ltd., Buckinghamshire, UK). For each analysis, the first five shots of each canister were fired to waste with a 2-s shaking protocol in-between. The primed pMDIs were inserted into the custom-made mouthpiece adaptor and actuated into the temperature-controlled airflow. After testing, each part of the assembly was thoroughly rinsed with a methanol/water solution (80/20, v/v) and samples collected for chemical quantification using high-performance liquid chromatography (HPLC). The MMAD was calculated from log-probability plots of cumulative percentage mass deposition data from each impactor stage versus cutoff diameter. The GSD (geometric standard deviation) was calculated as the square root of the 84th/16th percentile deposition data (dx) from the same plots[6]
The FPF was defined as the percentage of the mass deposited from stage three to filter (corresponding to the cut-off size ≤4.7 μm), as a function of the ex-valve dose (including actuator, USP induction port, and all ACI stages). All experiments were conducted in triplicate.
2.5. High-Performance Liquid Chromatography
The mass of budesonide collected from the cascade impactor stages and USP induction port were analyzed using reverse HPLC. A Shimadzu HPLC system consisting of an LC20AT pump, an SIL20AHT autosampler, and an SPD-20A UV-VIS detector (Shimadzu, Sydney, NSW, Australia) and C18 column (Novapak 5 µm, Waters, Rydalmere, Australia) was used for quantification. The flow rate was 1 ml.min−1 with an injection volume of 100 µl and detection wavelength of 243 nm. Standard solutions were freshly prepared with mobile phase daily and the linearity was confirmed between 0.1 and 100 μg/ml (R2 > 0.999). Quantification was calculated based on the peak area integration using Shimadzu's automated software solution (LCsolution Workstation, Shimadzu. Sydney, NSW, Australia)
2.6. Laser Diffraction Measurements
In addition to conventional pharmacopeia impactor studies, the aerosol size distribution of the post-USP induction port particles emitted from each pMDI formulation were determined by laser diffraction. A Malvern Spraytec® (Malvern Instrument Ltd., Worcestershire, UK) equipped with inhalation cell and USP induction port as in the cascade impactor studies, was connected to the inlet air heating assembly in lieu of the cascade impactor. The entire assembly was connected to a vacuum pump to control the flow rate (28.3 l.min−1) in the measurement zone. The particles were measured using a dispersion refractive index of 1.0, particle refractive index of 1.5, and density of 1.3 g/cm3 at a sampling frequency of 2.5 kHz using a 300 mm lens. Data were reported as cumulative volume undersize. In addition, the obscuration rate of particles within the measurement zone from each spray was recorded as a function of spray duration. It is important to note that previous work such as that published by Haynes et al., (Haynes et al. Citation2004) has studied particle size distributions of nonvolatile-containing pMDI formulations (such as propylene glycol) at elevated temperatures using laser diffraction. However, this previous study was focused on directly comparing laser diffraction and impactor methodologies rather than studying a theoretical model for particle formation. Importantly, findings from this previous study highlighted the poor correlation between laser diffraction derived 50th percentile volume diameters and inertial impactor mass median aerodynamic diameters, where a regression slope of 0.29 and R2 of 0.80 were observed at 25°C and a slope of 0.31 and R2 0.89 were observed at 40°C (Haynes et al. Citation2004). Thus, it is important to consider laser diffraction as a complementary tool, capable of evaluating the dynamics of the spray formation and real-time size distribution and should not be considered a substitute for the aerodynamic mass-based cascade impactor measurements, on which the particle size theory is based.
2.7. Statistical Analysis
One-way ANOVA analysis, followed by the post-hoc (Tukey's) multiple comparisons were performed. Significance was determined at a p value <0.05. Unless otherwise stated, data is presented as mean ± standard deviation.
3. RESULTS
3.1. Andersen Cascade Impactor Measurements
The mass deposition patterns of each experimental formulation at two different inlet air temperatures are shown in . In general, the ex-valve dose for all the formulations were within 15% of the nominal dose, with USP induction port having the highest amount of particle deposition. This is in good agreement with previously published data for similar formulations (Brambilla et al. Citation1999).
FIG. 3. Andersen cascade impactor percentage stage mass deposition of budesonide from pMDI formulations containing 0 to 1% glycerol w/w at (a) 25°C and (b) 55°C.
For any given temperature, significant differences in stage 3–7 depositions were seen across the NGI when comparing formulations containing different amounts of glycerol. In comparison, no difference in actuator or USP induction port deposition was observed when comparing different formulations at the same temperature and only minimal deposition was seen on stages 1–3. Thus, only a small change in FPF was observed, but a more pronounced change in MMAD resulted from the shift in mass distribution of the residual particles on stages 3-filter.
When comparing the influence of temperature (25°C vs. 55°C) on stage deposition, significant differences in the USP induction port and impactor stages 3-filter were observed. In general, the USP induction port deposition for all formulations at 55°C were significantly lower (ca. 10% lower) than at 25°C, although no changes in actuator deposition were observed. This resulted in increased stage deposition and thus a significant increase in FPF as gas temperature was increased. MMAD, GSD, and FPF values for each formulation at each temperature are reported in .
TABLE 2 MMAD, GSD and FPF of glycerol-containing budesonide solution pMDI formulations at 25°C and 55°C (n = 3, ± StDev)
3.2. Laser Diffraction Measurements
The post-USP induction port aerosol time-averaged volume-weighted particle diameter frequency distribution and temp- oral laser obscuration during each spray event was measured downstream of the USP induction port using a Spraytec inhalation cell. In general, it may be considered that the volume of a particle in the measurement zone can be related to its mass (assuming particle density and refractive index remains constant at 1.30 g/cm3 and 1.5, respectively) and thus obscuration can be used as an approximation to mass crossing the laser as a function of time. The approximation of density and refractive index is necessary since the true values of the composite particles containing glycerol and budesonide are not known. However, these values are approximated from reported densities of glycerol and budesonide (˜1.3 g/cm3) and their refractive indices (estimated as ˜1.6 for budesonide [Cao et al. Citation2009] and 1.47 for glycerol [Birkhoff et al. Citation1978]). Additionally, it should be noted that incomplete evaporation of ethanol from these drying droplets and the molecular arrangement of the composite particles may cause a deviation from the “ideal” densities of the raw materials. It is thus envisaged that changes in the budesonide/glycerol composition of the dried particle will not have a large effect RI and thus size distributions. Furthermore, the RI for the dispersing media (air) is assumed to be 1 since the amount of volatile components in the airstream post-USP induction port is very small and thus the RI of HFA and ethanol can be considered negligible. Specifically, at 28.3 l/min, the majority of the formulation is introduced into the airstream over 200 ms (). This equates to 50 µl being introduced into a volume of 100,000 µl over 200 ms). Laser time-obscuration and particle size distributions of each formulation at both 25°C and 55°C are shown in and , respectively.
FIG. 4. Temporal obscuration rate of each experimental pMDI formulation as a function of time: (a) 25°C and (b) 55°C.
FIG. 5. Size distribution of particles released from the experimental pMDI formulations: (a) 25°C and (b) 55°C.
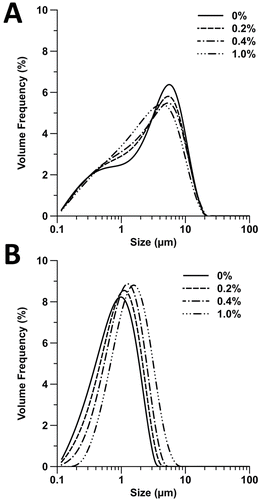
In general, the obscuration profiles for each of the formulations at 25°C were similar, with a small increase in the obscuration as a function of glycerol content after ˜200 ms. This most likely corresponds to an increase in mass of the dried droplets (due to increased NVC) toward the end of the actuation cycle. Interestingly, little variation occurred in the first 200 ms. In comparison, the obscuration for formulations aerosolized at 55°C showed marked differences in obscuration profile across the whole actuation period with increasing obscuration being observed, as glycerol content increased. Furthermore, the maximum obscuration of samples at 25°C (ca. 40%) was approximately double that of formulations tested at 55°C (≤20%) suggesting incomplete drying of the droplets at the lower temperature.
The averaged particle size distribution of each formulation at 25°C (shown in ) showed a biomodal size distribution with an increase in median diameter as glycerol content was increased within the formulation. In comparison, the formulations tested at 55°C (shown in ) showed a monomodal distribution with increase in median diameter as glycerol content increased. The difference between the bimodal and monomodal distributions is likely to be due to incomplete drying of the aerosol at 25°C.
4. DISCUSSION
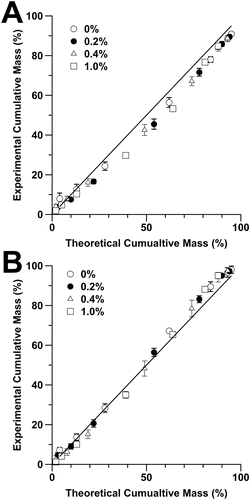
Cumulative mass distributions of each formulation at 25°C and 55°C are plotted in , respectively, along with the theoretical cumulative particle size distributions calculated from Equation (Equation5[5] ). In general, it can be seen that as the NVC concentration is increased, the theoretical residual size distribution d1 concurrently increases. Thus, for the aerosol containing 0% w/w glycerol and 0.4% w/w drug, the calculated MMAD is 1.71 µm in comparison to 2.60 µm when 1% w/w glycerol is present (equivalent to 1.4% w/w NVC). In general, all formulations fit the theoretical trend lines; however, for the experiments performed at 25°C, the theoretical values tend to underestimate the experiential particle sizes, particularly toward high size fractions. This is most likely due to incomplete drying of the 15% ethanol containing droplets resulting in an underestimation of droplet size at the point of impaction. This observation is further substantiated when observing the post-USP induction port aerodynamic size as measured using laser diffraction, which clearly shows a bimodal size distribution for the lower temperature aerosols (). Interestingly, similar findings were observed in previous studies, when evaluating the aerosol size distributions generated from solution-based pMDIs, using both laser diffraction and cascade impaction (Smyth and Hickey Citation2003). In this previous study, Smyth and Hickey suggested this bimodal size distribution be due to incomplete drying of ethanol.
FIG. 6. Cumulative mass undersize percentage of each pMDI formulation at (a) 25°C and (b) 55°C, with theoretical fit based on Equation (Equation5[5] ).
![FIG. 6. Cumulative mass undersize percentage of each pMDI formulation at (a) 25°C and (b) 55°C, with theoretical fit based on Equation (Equation5[5] ).](/cms/asset/1b1767a2-deaf-4859-ba8e-f9773e3bec2c/uast_a_1096897_f0006_b.gif)
While the low-temperature measurements presented here showed bimodal size distributions, in comparison, at 55°C, the particle size distribution becomes monomodal () and experimental cumulative particle size distributions across the whole range more closely approximate theoretical values (). The reason for a bimodal droplet size distribu-tion is complex since the evaporation process needs to be considered in terms of both aerosol cloud density (number of droplets per volume) and plume evolution as a function of time. Furthermore, it is important to consider that HFA/ethanol mixtures do not follow Dalton's law (Smyth et al. Citation2002) and the vapor pressure in a drying droplet will not vary linearly as the cosolvent and HFA evaporate. This departure from Dalton's law will also result in variable evaporation rate which can help explain the emergence of bimodal distributions. Coupled with the fact that the plume geometry and aerodynamic shear is not uniform (Buchmann et al. Citation2014), the potential to have regions with enhanced drying rates may occur. This would be reduced at elevated surrounding gas temperature since evaporation would be significantly increased throughout the plume, thus shifting to monomodal size distributions.
As previously discussed, the FPF is related to the HFA concentration, valve volume, and actuator orifice, rather than initial particle size (Equation (Equation2[2] )), where an increase in jet velocity, due to variations in orifice diameter, may result in increased USP induction port deposition (Hochrainer et al. Citation2005).
Interestingly, the FPF is almost totally independent of the MMAD since the majority of the dried particles will always be less than 5 µm. In an ideal system, the metering volume and actuator orifice could be modified so that the initial droplets do, dry unobstructed to their final diameter. This would result in an FPF approximating 80–100% depending on the NVC concentration, as per the theoretical calculations outlined in . The post-USP induction port particle size distribution, measured by laser diffraction, indicates that particles have not dried sufficiently at 25°C by the time they reach the measurement cell and thus the system has a lower FPF (ca. 30%) when compared to the 55°C where the size distribution shifts in relation to the NVC concentration in the final droplets. For the 55°C samples, a linear decreasing trend in FPF was observed (R2 = 0.99) as NVC concentration increased; relating to increased particles >5 µm in the theoretical size distribution. Ultimately, however, a significant percentage of the aerosol is still captured in the USP induction port and actuator due to the ballistic nature of the expanding aerosol cloud from the actuator nozzle (Buchmann et al. Citation2014).
To further understand the impact of drying on the final particle size distributions, the theoretical cumulative undersize data was plotted against experimentally derived results for all formulations at 25°C () and 55°C (), respectively. It can be seen that the x/y fit for the 55°C data were closer to unity when compared to 25°C, suggesting that incomplete drying of larger droplets shifted the cumulative size distribution in the lower temperature experiments. This is further supported when comparing percentage errors from 10–90% cumulative mass values where only two data points had a% error greater than 10% for the 55°C measurements, compared to nine data points for the 25°C data series. The reason for the experimental deviation from theoretical particle size distribution is most likely due to the nature in which Equation (Equation5[5] ) was derived. The theoretical particle size distributions were empirically based on experimental measurements of MMAD across many formulations containing different NVC and ethanol concentrations. Based on these MMAD values, an empirical equation was derived which takes into account vapor pressure of the HFA and initial droplet size which can be extrapolated to the whole particle size distribution. Subsequently, the equation assumes that all particles dry fully, where in actual fact a number of larger droplets are likely to be incompletely dried at lower temperatures. This incomplete drying results in a bimodal size distribution and deviation from theoretical values at higher d1 particle sizes. Indeed, this is seen to some degree in the fit of experimental data to the model originally proposed by Lewis (Lewis Citation2013). Another important aspect of this study is the modification of the pMDI actuation housing itself. In a conventional pMDI the airflow passes through a narrow opening around the pressurized canister before flowing around the sump/actuator nozzle and out through the mouthpiece. Here, the airflow runs through the entire assembly parallel to the actuator nozzle. This difference in air velocity at a set volumetric flow rate is a result in difference in cross-sectional area when compared to a conventional canister. This ultimately, will affect the drying kinetics of the primary droplets near the actuator nozzle and thus cannot be directly compared to a commercial inhaler.
FIG. 7. Plot of experiemental vs. theoretical cumulative mass values at (a) 25°C and (b) 55°C. Line indicates exact correlation.
5. CONCLUSIONS
The particle size distribution of a number of formulations containing different percentages of NVC were studied using cascade impaction and laser diffraction at 25°C and 55°C. In general, the particle size distribution could be predicted based on an empirically derived theoretical model, however, incomplete drying of larger droplets at the lower temperature resulted in deviation from this model and bimodal size distributions. The incomplete droplet evaporation of inhaled particles may have implications in terms of in vitro characterization methods used to assess lung deposition during research and development. Additionally, this incomplete drying may also impact regional deposition in vivo (specifically in terms of MMAD), especially when the generated aerosol plume has increased drying times (such as in the case of valve holding chamber use). Future studies should investigate the effect of ethanol and the impact of turbulence on drying kinetics.
FUNDING
Paul M. Young is the recipient of an Australian Research Council Future Fellowship (project number FT110100996). Daniela Traini is the recipient of an Australian Research Council Future Fellowship (project number FT12010063).
Related Research Data
REFERENCES
- Birkhoff, R. D., Painter, L. R., and Heller, J. M. (1978). Optical and Dielectric Functions of Liquid Glycerol from Gas Photo-Ionization Measurements. J. Chem. Phys., 69:4185–4188.
- Brambilla, G., Ganderton, D., Garzia, R., Lewis, D., Meakin, B., and Ventura, P. (1999). Modulation of Aerosol Clouds Produced by Pressurised Inhalation Aerosols. Int. J. Pharmaceut., 186:53–61.
- Buchmann, N. A., Duke, D. J., Shakiba, S. A., Mitchell, D. M., Stewart, P. J., Traini, D., Young, P. M., Lewis, D. A., Soria, J., and Honnery, D. (2014). A Novel High-Speed Imaging Technique to Predict the Macroscopic Spray Characteristics of Solution Based Pressurised Metered Dose Inhalers. Pharmaceut. Res., 31:2963–2974.
- Cao, X. P., Hancock, B. C., Leyva, N., Becker, J., Yu, W. L., and Masterson, V. M. (2009). Estimating the Refractive Index of Pharmaceutical Solids Using Predictive Methods. Int. J. Pharmaceut., 368:16–23.
- Clark, A. R. (1991). Metered Atomisation for Respiratory Drug Delivery, Loughborough University, UK.
- Dunbar, C. A., Watkins, A. P., and Miller, J. F. (1997). An Experimental Investigation of the Spray Issued from a pMDI using Laser Diagnostic Techniques. J. Aerosol Med., 10:351–368.
- Haynes, A., Shaik, M. S., Krarup, H., and Singh, M. (2004). Evaluation of the Malvern Spraytec (R) with Inhalation Cell for the Measurement of particle size distribution from Metered Dose Inhalers. J. Pharmaceut. Sci., 93:349–363.
- Hochrainer, D., Holz, H., Kreher, C., Scaffidi, L., Spallek, M., and Wachtel, H. (2005). Comparison of the Aerosol Velocity and Spray Duration of Respimat (R) Soft Mist (TM) Inhaler and Pressurized Metered Dose Inhalers. J. Aerosol Med., 18:273–282.
- Ivey, J. W., Lewis, D., Church, T., Finlay, W. H., and Vehring, R. (2014). A Correlation Equation for the Mass Median Aerodynamic Diameter of the Aerosol Emitted by Solution Metered Dose Inhalers. Int. J. Pharm., 465:18–24.
- Lewis, D. (2013). Intrinsic Particle Size Distribution: A New Metric to Guide the Design of HFA Solution pMDIs. RRD Europe, 1:175–184.
- Lewis, D., Ganderton, D., Meakin, B., and Brambilla, G. (2004). Theory and Practice with Solution Systems. Respiratory Drug Delivery IX, Davis Healthcare International, River Grove, IL, pp. 109–115.
- Myrdal, P. B., Sheth, P., and Stein, S. W. (2014). Advances in Metered Dose Inhaler Technology: Formulation Development. Aaps. Pharmscitech., 15:434–455.
- Rogueda, P., Lallement, A., Traini, D., Iliev, I., and Young, P. M. (2012). Twenty Years of HFA pMDI Patents: Facts and Perspectives. J. Pharm. Pharmacol., 64:1209–1216.
- Shemirani, F. M., Hoe, S., Lewis, D., Church, T., Vehring, R., and Finlay, W. H. (2013). In Vitro Investigation of the Effect of Ambient Humidity on Regional Delivered Dose with Solution and Suspension MDIs. J. Aerosol Med. Pulm., D 26:215–222.
- Smyth, H. D., and Hickey, A. J. (2003). Multimodal Particle Size Distributions Emitted from HFA-134a Solution Pressurized Metered-Dose Inhalers. Aaps, Pharmscitech., 4:E38.
- Smyth, H. D., Mejia-Millan, E. A., and Hickey, A. J. (2002). The Effect of Ethanol on Solvency, Vapor Pressure, and Emitted Droplet Size of Solution Metered Dose Inhalers Containing HFA 134a, in Proceedings of Respiratory Drug Delivery, R. N. Dalby, P. R. Byron, J. Peart, S. J. Farr, eds., Davis Healthcare, 735–738.
- Stein, S. W., Gabrio, B. J., Oberreit, D., Hairston, P., Myrdal, P. B., and Beck, T. J. (2002). An Evaluation of Mass-Weighted Size Distribution Measurements with the Model 3320 Aerodynamic Particle Sizer. Aerosol Sci. Technol., 36:845–854.
- Stein, S. W., and Myrdal, P. B. (2004). A Theoretical and Experimental Analysis of Formulation and Device Parameters Affecting Solution MDI Size Distributions. J. Pharmaceut. Sci., 93:2158–2175.
- Stein, S. W., and Myrdal, P. B. (2006). The Relative Influence of Atomization and Evaporation on Metered Dose Inhaler Drug Delivery Efficiency. Aerosol Sci. Technol., 40:335–347.
- Thiel, C. G. (1996). From Susie's Question to CFC Free: An Inventor's Perspective on Forty Years of MDI Development and Regulation, in Proceedings of Respiratory Drug Delivery, R. N. Dalby, P. R. Byron, S. J. Farr, eds., Interpharm Press, 115–124.
- Vervaet, C., and Byron, P. R. (1999). Drug-Surfactant-Propellant Interactions in HFA-Formulations. Int. J. Pharmaceut., 186:13–30.
- Zhu, B., Traini, D., and Young, P. M. (2015). Aerosol Particle Generation from Solution-Based Pressurised Metered Dose Inhalers: A Technical Overview of Parameters That Influence Respiratory Deposition. Pharmaceut. Dev. Technol., accepted. http://www.ncbi.nlm.nih.gov/pubmed/25243986