
ABSTRACT
Particles deposited on indoor surfaces may be resuspended and become airborne when disturbed by intensive jets. Depending on the intended purpose, the resuspension of deposited particles may be minimized or promoted. This investigation experimentally measured the resuspension of Arizona test dusts (ATDs) after a jet impingement. The simulating pulsed jets were created by a tube using compressed nitrogen gas. The jets were released into the test section in a wind tunnel that was cleaned by high-efficiency particulate air (HEPA) filters. The particle resuspension was evaluated by the dust-removal zone shapes on particle-laden plates, total dust-removal mass, and the number of airborne particles. The effects of the jet impingement heights, surface dust loads, and particle-laden plate surface roughness on particle resuspension were examined. This study revealed that sparsely deposited dusts indoors are more difficult to resuspend by jets than are densely deposited dusts. The jet impingement to a surface whose roughness is comparable to the particle diameters may cause severer airborne particle exposure than to surfaces with extremely small or large roughness values. For a high surface dust load, there is an optimal jet impingement height that can resuspend the maximum amount of the deposited dusts.
Copyright © 2016 American Association for Aerosol Research
EDITOR:
1. Introduction
Airborne particles are one of the major contaminants that result in indoor air pollution. Airborne particles in indoor environments originate from numerous sources. An inverse modeling study (Yakovleva et al. Citation1999) showed that up to 30% of particulate matter with diameters of less than 10 microns (PM10) originates from particle resuspension. Therefore, it is of great value to investigate the resuspension of indoor deposited particles.
Particles can become resuspended by either mechanical or aerodynamic disturbance or a combination of these (Gomes et al. Citation2007). A resuspension process is subject to many factors (Qian and Ferro Citation2008), such as particle material and size distribution, particle-adhered surface material and its orientation, background ventilation, psychrometric conditions, and electrostatic fields. Particle resuspension results from multiple force interactions (Ziskind et al. Citation1995) or energy accumulation (Reeks et al. Citation1988). The force interaction perspective believes that particle resuspension is due to the interaction of particle resuspension forces, gravity, and surface adhesion forces. Once the sum of all of the resuspension forces exceeds the sum of the gravitational force and the adhesion forces, particles begin to slide or rotate on the surface, and then the lifting-off (resuspension) phenomenon occurs (Wang Citation1990). The particle resuspension forces may include mechanical vibration force, aerodynamic force, and electrostatic force, while van der Waals forces account for the greatest surface adhesion force. The energy perspective attributes particle resuspension to the escape of the imaginary adhesive potential wells (Reeks et al. Citation1988). If the accumulated vibrational energy exceeds the adhesive threshold of the potential wells, then the particle detaches from the surface. The energy accumulation model appears more accepted when explaining particle resuspension in turbulent flows.
Indoor particles can be resuspended for many reasons, such as human activities (Ferro et al. Citation2004), animal activities (Arlian et al. Citation2001), and the heating, ventilating, and air-conditioning (HVAC) system operations (Krauter and Biermann Citation2007). The human activities, such as walking and vacuuming, were identified as an important reason to cause particle resuspension (Rosati et al. Citation2008; Kubota et al. Citation2009). Human motions, e.g., walking through a room, stopping, and then walking, were found to significantly drive particles to resuspend from a carpet (Oberoi et al. Citation2010). Descending objects can also cause deposited particles to resuspend due to the generated strong flow nearby and the associated aerodynamic forces (Eames and Dalziel Citation2000; Khalifa and Elhadidi Citation2007). In a sleep microenvironment, the bedding arrangement of mats, blankets, and pillows can resuspend deposited particles (Spilak et al. Citation2014). Resuspension of deposited particles in ventilation ducts was also investigated, which may deliver the resuspended particles into indoor spaces by air distribution (Krauter and Biermann Citation2007; Wang et al. Citation2012).
As a common disturbance source, gas jets can induce the resuspension of deposited particles. Many types of jets are used in indoor environments. For example, in some workshops, the gas-providing devices occasionally release intensive jets. Strong intensive jets are also present at some grilles and nozzles with only small opening areas. The maximum speed of the air jets from the overhead gaspers in an aircraft cabin is up to 80 m/s (Shi et al. Citation2015), while air jets in building environments may reach 10.0 m/s (Bin and Sekhar Citation2007). The human respiratory flows, such as sneezing, coughing, and even deep breathing, may generate strong jets (Tang et al. Citation2013). It was claimed that the maximum flow speed during a sneeze might reach 100 m/s (Wells Citation1955). The measurement using particle image velocimetry showed that the coughed airflow speed ranges widely from 6 to 22 m/s, with an average of approximately 11.2 m/s (Zhu et al. Citation2006). These intensive jets can induce the resuspension of deposited particles.
Although there is limited research on jet-induced particle resuspension in indoor environments, many studies were conducted in the semiconductor industry for cleaning of the chip surfaces. When cleaning a surface, the resuspension of deposited particles is promoted. The used gas is ordinary pressured air (Ziskind et al. Citation2002) or CO2 from dry ice (Liu et al. Citation2012). The studied particle materials range from polystyrene latex (Otani et al. Citation1995; Smedley et al. Citation1999), styrene/divinylbenzene (Masuda et al. Citation1994), wax (Otani et al. Citation1995), to glass (Zhang et al. Citation2002). The particle-deposited substrate materials are glass (Smedley et al. Citation1999), silicon (Otani et al. Citation1995), copper (Gotoh et al. Citation1996), and steel (Zhang et al. Citation2002), among others. To enhance the particle removal, the jet impingement at different angles (Gotoh et al. Citation1996), for different durations (Smedley et al. Citation1999; Ziskind et al. Citation2002), and for different pretreatments of deposited particles (Gotoh et al. Citation1996; Gotoh and Masuda Citation1998), was extensively studied.
The above review reveals that intensive jets are common in indoor environments, which can make indoor-deposited particles resuspend. Many experimental studies have been conducted in the semiconductor industry for the removal of deposited particles from surfaces. However, in indoor environments, the resuspention of indoor deposited particles must be inhibited to minimize airborne particle exposure; on the other hand, if deposited particles are to be removed by a jet-vacuum air-cleaning device, then the particle resuspension may have to be enhanced. Considering different jet types, particles, and deposited surface materials from those used in the semiconductor field, the jet-induced particle resuspension in indoor environments deserves an extensive investigation. This article presents our efforts in measuring the jet-induced particle resuspension in simulated indoor environments.
2. Principles of the experiment
The intensive jets were created using pressurized nitrogen gas from a round tube with an inner diameter of 6.5 mm. shows the schematics of the experimental test facility. The tube is embedded within a rigid metallic shell, which is mounted to the frame of the test section. A solenoid valve is connected to a timer to control the on-off status of the jets and the gas discharging duration. Upstream of the valve, a pressure regulator adjusts the gas pressure on demand. The test section is in an enclosure guarded by antistatic glass to minimize the impact of electrostatic forces and the disturbance from the outside. The dimensions of the test section are 1.2 m × 0.8 m × 0.6 m.
Figure 1. The jet generation device in the test section: (a) schematics, and (b) picture.
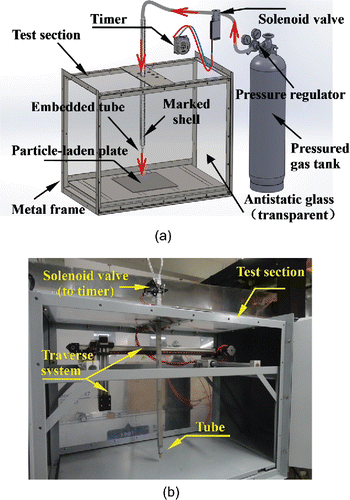
presents a picture of the test facility. A traverse system was installed in the test section to mount the particle sampler for airborne particle counting at a certain location. The test section is further connected to a wind tunnel to maintain a clean test environment. The wind tunnel consists of an intake fan, an air filtration section, a flow stabilization section, and a discharging outlet section. The air filtration section contains three filters, namely, a low-efficiency filter, an intermediate-efficiency filter, and a high-efficiency-particulate-air (HEPA) filter. Interested readers may access the online supplementary information (SI) for more details of the test facility.
Because there is a wide range of the jet-discharging speeds in indoor environments, an intermediate value of 20 m/s was adopted in the test, which corresponds to approximately 0.2 MPa for the static pressure. The discharging speed was measured by an ultrasonic anemometer (type: DA-650 and TR-92T; Kaijo Sonic, Japan) to further finely tune the required discharging pressure. The jet duration was set to 0.4 s (the timer setting of 0.2 s plus the hysteresis time of 0.2 s) to generate a single pulsed jet. Coincidently, a sneezing jet lasts 0.4 s according to Gupta et al. Citation(2009) and Tang et al. Citation(2013), but the discharging speed could be higher.
The investigated particles were ultrafine Arizona test dusts (ATDs), with a bulk density of approximately 500 kg/m3. The upper limit of the ATD size is 20 μm. The volumetric fraction of the ATDs that are less than 10 μm in diameters ranges from 97% to 100%. One can refer to the ISO standard (12103-1: 1997) for more detailed particle size distribution of the ATDs and some other information. Two different materials were used as particle-laden substrates: glass and stainless steel. The smooth and rough substrates of each material were adopted; thus, four particle-laden plates were tested. A three-dimensional surface profiler (type: New View 5022; ZYGO, USA) was applied to measure the roughness of the particle-laden plates. lists the measured roughness of these four plates. In the table, PV represents the maximum distance between the highest peak and the lowest valley on the surface, Rrms stands for the root mean square of the peak-valley distance, and Ra is the arithmetic mean of the distance between the peaks and the valleys. It can be seen that the smooth glass is the smoothest, while the rough glass is the roughest.
Table 1. Measured roughness of particle-deposited plate surfaces.
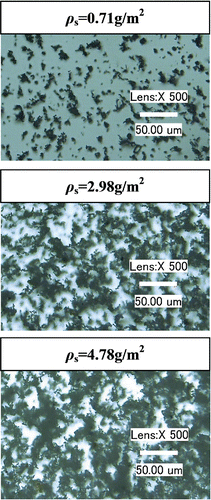
Particle deposition was conducted in a glass enclosure to ensure uniform deposition. The ATDs were fed to a solid aerosol generator (type: SAG 410; Topas, Germany) to make the ATDs airborne, and then the airborne ATDs were blown into the glass enclosure for natural deposition. By controlling the particle feeding rate and release time, different surface dust loads on the laden plates can be achieved. The surface dust load in indoor environments ranges across several orders of magnitudes. For example, the dust load on hard flooring is typically in the range of 0.1 to 1 g/m2 but in ventilation ducts it may vary from less than 1 g/m2 to over 100 g/m2 (Boor et al. Citation2013). shows pictures of deposited dusts on the rough stainless steel plates at different surface dust loads. More pictures can be found in Figure S.4 in the SI. The dusts with ρs ≤ 3 g/m2 are distributed more sparsely than are those with ρs > 3 g/m2, although some dust groups can occasionally be found. The dusts are more likely to agglomerate when ρs > 3 g/m2, and some dusts are believed to deposit in multiple layers.
Figure 2. Pictures of the deposited dusts on the rough stainless steel plates photographed by a 3D super depth digital microscope in which the dark dots represent particles.
After a jet impingement, the dust-removal area on the particle-laden plate was measured, the dust-removal mass was weighed, and the number of airborne particles was counted. The dust-removal area was identified by the gray scale of the photographed images using graphing software (Image-Pro-Plus, version 6.0). The boundaries of the identified dust-removal zone abruptly change in the gray scales. The dust mass on the deposited plates before and after a test was weighed using a digital precision balance (type: DV215CD; Ohaus, USA). The resolution of the digital balance is 0.01 mg with an accuracy of ±0.02 mg. The surface dust load is calculated as the dust mass divided by the plate area. The airborne particle number was recorded using a particle counter (type: 9310-02; TSI, USA). The sampled air was drawn from the isokinetic sampler that was mounted on the traverse system. An antistatic soft tube was used to connect the particle sampler to the particle counter. The flow rate of the particle counter is 28.3 l/min with ±5% accuracy. The counting efficiency is 50% for particles at 0.3 μm but 100% for particles larger than 0.45 μm. Before counting particles, the sampled air was diluted by a particle diluter (type: DIL 554; Topas, Germany) with a dilution ratio of 1:100 and a flow rate of 28.3 l/min with ±5% accuracy.
The particle resuspension process was photographed by a high-speed digital camera (type: acA2000–340 km; Basler, Germany). The camera was operated at 200 frames per second with a window size of 400 × 400 pixels. The recording process was accomplished with the illumination of a sector of light sheet (wavelength: 532 nm, green light) across the central plane of the impingement jet.
The experiment was conducted based on the following procedures:
Feed the ATDs to the solid aerosol generator, and discharge airborne dusts into the glass enclosure for natural deposition. The natural deposition lasts approximately 1 h for each test. Weigh the dust mass on the particle-deposited plate.
Turn on the wind-tunnel fan to remove the background airborne particles in the test section. Monitor the particle number concentration in the test section with the particle counter until the background particle (1.0–3.0 μm) concentration decreases to approximately 1% of that outside of the test section. Then, seal both ends of the test section, shut down the fan, and load the particle-laden plate with deposited ATDs into the test section.
Release the jet, record the particle resuspension process by the digital camera, and count the airborne particles until the particle number concentration decreases to the value before the jet impingement.
After counting airborne particles for approximately 4000 s, remove the particle-laden plate, photograph the dust-removal area on the plate, and weigh the dust mass on the laden plate. Then, turn on the wind-tunnel fan to clean the test section for the next test. Each test was repeated five times to ensure repeatability of the measurement.
In this investigation, the particle resuspension rates varying with the jet impingement height, surface dust load (g/m2), and the particle-laden surface materials were measured. lists the major parameters of the tests. The surrounding air temperature and humidity are not intentionally controlled.
Table 2. Major parameters of the experiments.
3. Results
3.1. Dynamic process of the particle resuspension
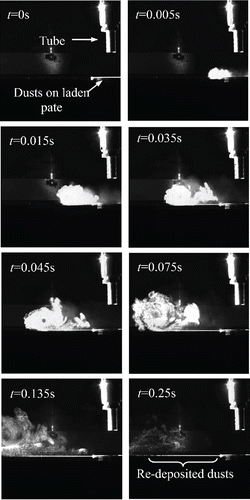
presents the evolution of the dust cloud after a jet impingement on deposited dusts on the laden plate. Due to the window size limitation of the camera, only a half section of the region was photographed. At t = 0, the white line underneath the tube represents the ATDs on the laden plate. The dust cloud was visible at t = 0.005 s, and some of the deposited dusts below the tube were absent. Then, the dust cloud increased in size and moved along the horizontal surface away from the gas discharge tube. From t = 0.045 s to 0.075 s, the clockwise vortex based on the photographed pictures can be seen. Subsequently, the dust cloud became increasingly weaker because of dilution and particle redeposition. At t = 0.25 s, some of the redeposited dusts outside the laden substrate can be seen, as highlighted in the bottom right subfigure. Note that the initially deposited dusts near the boundaries of the laden substrate remain there at t = 0.25 s, with virtually no change in light densities before and after the jet impingement. For more details, the readers are recommended to access the videos in the SI.
Figure 3. Jet-induced dust cloud from a rough stainless steel plate with H/D = 5 and ρs = 4.78 g/m2.
3.2. Particle resuspension versus jet height
The dust-removal area and mass vary with the jet impingement heights. shows the particle-laden plates after a jet impingement. Because the ATDs are light in color, the dust-removal zone appears dark. At a small impingement height with H/D = 5, the dust-removal zone appears as a circular disk, as shown in . However, with an increase in the jet impingement height, such as at H/D = 20, the dust-removal zone generally emerges as an annular stripe, as shown in . Inside and outside of the stripe, the deposited dusts are difficult to resuspend. The dust-removal rate can also be indicated by the light intensities of the photographs. Near the boundaries of the dust-removal zone, there are sharp changes in the light intensities. The fluctuations of light intensities imply that the resuspended dusts are random. The relative light intensities shown in are normalized by the value before the jet impingement. A comparison of the minimum light intensities between show that more dusts were removed at a lower jet impingement height, which is intuitive.
Figure 4. Pictures of the rough stainless steel plates with deposited dusts (ρs = 4.78 g/m2, upper parts) and the normalized light intensity along the horizontal central lines (lower parts) after a jet impingement at different heights: (a) H/D = 5, and (b) H/D = 20.
The different shapes of the dust-removal zone can be explained by the jet impingement theory. illustrates a sectional view of a steady jet plume and the generated shear stress on the wall. The jet plume can typically be divided into three zones: free jet zone A, impingement zone B, and wall jet zone C. The impingement zone B is usually within h/H > 0.86 and r/H < 0.22, which is near the stagnation point (SP in ). The origin of coordinate h is at the tube outlet, and the origin of r is at the stagnation point, SP. The wall shear stress, τ, increases from zero at the stagnation point to a peak value, τmax, within zone B and then decreases gradually and approaches zero in zone C. The ratio of wall shear stress to the maximum stress can be expressed as follows (Beltaos and Rajaratnam Citation1974):
Figure 5. Impingement jet plume and the generated wall shear stress: (a) a half-sectional view of a circular jet contour and the shear stress distribution, (b) variation of τ/τmax with the horizontal distance from the stagnation point, and (c) variation of normalized τmax with the jet height.
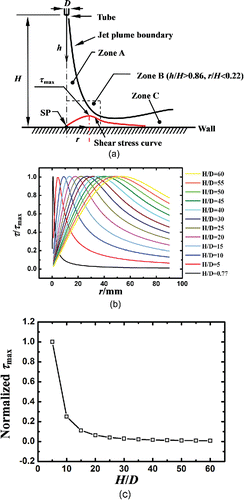
If the wall shear stress indicates one of the major forces causing deposited dusts to resuspend, then only the deposited dusts in a certain region in which the generated wall shear stress is greater than a threshold value can be resuspended. Based on , it is easy to understand that at H/D = 5, the dust-removed zone forms a circular disk, and the dusts near the stagnation point are resuspended to a lesser degree, as indicated by the light intensities shown in . With an increase of the jet height to H/D = 20, the wall stress near the stagnation point becomes small, as can be seen in . Only in the region where τmax appears can the dusts be resuspended, which forms an annular stripe of the dust-removal zone.
presents the dust-removal mass from the rough stainless steel plate versus the jet height at two different surface dust loads. The error bars in the figure represent the standard deviations of five repeated tests. The repeatability and stability of the discharging jets partially contribute to the fluctuations of the results and the standard deviations of the measurement data. shows that for ρs = 1.44 g/m2, the weighed dust-removal mass after a jet impingement generally decreases with the jet impingement height. Once H/D is greater than 30, the dust-removal mass is small and does not substantially rely on the jet impingement height. This is consistent with the variations of the wall shear stress with the jet heights, as shown in . However, an exception was found for ρs = 4.78 g/m2. The dust-removal mass at H/D = 5 is greater than that at H/D values of 0.77 and 10. This shows that there may be an optimal jet impingement height to promote particle resuspension at a high surface dust load of ρs = 4.78 g/m2.
Figure 6. Variation of the dust-removal mass from a rough stainless steel plate with the jet impingement height: (a) with ρs = 1.44 g/m2, removal mass normalized by 0.00339 g, and (b) with ρs = 4.78 g/m2, normalized by 0.02169 g.
With a higher jet height, the jet-impacted region is larger according to the diverging plume profile shown in . However, the resulting wall shear stress on the particle-laden plate decreases with the jet height according to Equation Equation(2)[2] . To obtain a maximum dust-removal mass, the jet-impacted region and the wall shear stress should be as large as possible. At a small surface dust load, particles are sparsely distributed, which increases the probability of monolayer deposition. The monolayer-deposited particles were found to require larger disturbance forces to resuspend (Zhang et al. Citation2013). Figure S.5 in the SI shows pictures of the particle-laden plates after jet impingements at two different heights with ρs = 1.44 g/m2. For H/D = 0.77, the dusts can be removed more completely, as indicated by the light intensities, although the jet-impact region is slightly smaller than that for H/D = 5. Thus, it is not surprising that for ρs = 1.44 g/m2, the wall shear stress is more critical than the jet-impacted region; hence, a lower jet can resuspend more dusts. However, for ρs = 4.78 g/m2, the impacted region by the jet at H/D = 5, as shown in , is much larger, but the removed dusts are not much less than that for H/D = 0.77, as shown in Figure S.6 in the SI. This is because with a larger surface dust load for which particles are more likely deposited in multiple layers and agglomerate, the threshold forces to resuspend the particles are smaller than those for the monolayer-deposited particles. Additional analysis on the effect of surface dust loads on particle resuspension is provided in the next section.
shows the total particle numbers counted for approximately 4000 s after a jet impingement. The isokinetic sampler was placed at a height of 38.5 cm and at a horizontal distance of 37 cm. In general, the counted particle numbers decrease with the jet height, regardless of particle bin sizes. Similar to the dust-removal mass, the counted particle numbers become insensitive to the jet height once H/D is greater than 30. The large standard deviations in the counted particle numbers for H/D ≤ 30 indicate the randomness of the jet impingement and the disturbed airborne particle numbers. A comparison of with shows that at a larger surface dust load, the particle number ratios for the sizes of 3 to 10 μm are higher than those at a small surface dust load. This reveals that some dusts might have agglomerated at a high surface dust load.
Figure 7. Variation of the total airborne particle numbers resuspended from the rough stainless steel plate with the jet impingement height; particles within the bin size of 1 to 3 μm refer to the left coordinate and other bin sizes to the right coordinate: (a) ρs = 1.44 g/m2, and (b) ρs = 4.78 g/m2.
3.3. Particle resuspension versus surface dust load
Because particle resuspension is more vigorous when H/D < 30, this investigation selected H/D = 0.77 and H/D = 20 to evaluate the variation of particle resuspension with surface dust load. presents the dust-removal mass after a jet impingement at H/D = 20. The results for H/D = 0.77 can be found in Figure S.7 in the SI. The dust-removal mass generally increases with the surface dust load, which is intuitive. However, the increase rates are different at different surface dust loads. The increase rates are nearly the same when ρs ≤ 3 g/m2, as marked by the dashed line. Once ρs > 3 g/m2, the dust-removal mass increases sharply with the surface dust load. This reveals that the deposited dusts are easier to resuspend at a larger surface dust load. The study by Zhang et al. Citation(2013) also showed that multiple-layer-deposited particles that have high surface dust loads are easier to resuspend.
Figure 8. Variation of the particle resuspension with the surface dust load after a jet impingement at H/D = 20: (a) dust-removal mass normalized by 0.01551 g, and (b) airborne particle numbers; particles within a bin size of 1 to 3 μm refer to the left coordinate and other bin sizes to the right coordinate.
shows the total particle numbers with the sampler at the same position as the previous measurements. The results for H/D = 0.77 can be found in Figure S.8 in the SI. The airborne particle numbers increase relatively steadily with the surface dust load. There are large standard deviations in the particle numbers, especially for particles within a bin size of 1 to 5 μm. However, the increase rate of particle numbers with the surface dust load is not as large as that for the dust-removal mass with the surface dust load. This shows that only a portion of resuspended airborne dusts can be recorded by the particle counter.
3.4. Particle resuspension versus particle-laden plate materials
shows the dust-removal mass from four different plates after a jet impingement at a height of H/D = 0.77 and a surface dust load of ρs = 0.46 g/m2. The dust-removal mass from the rough stainless steel plate is the largest, while the removal mass from the rough glass and the smooth stainless steel plates is the smallest. However, as shown in , the airborne particle numbers from the rough stainless steel are the largest and from the smooth stainless steel are the smallest. For the same material, the dust-removal mass from the rough stainless steel is much larger than that from the smooth stainless steel. However, the situation is opposite for the glass in which more deposited dusts can be resuspended from the smooth glass. The airborne particle numbers have the same varying trends with the dust-removal mass. This shows that the roughness exerts different effects on particle resuspension for the two tested materials.
Figure 9. Particle resuspension from different material surfaces: (a) dust-removal mass normalized by 0.00106 g, and (b) particle numbers; left coordinate for a bin size of 1 to 3 μm and right coordinate for other bin sizes.
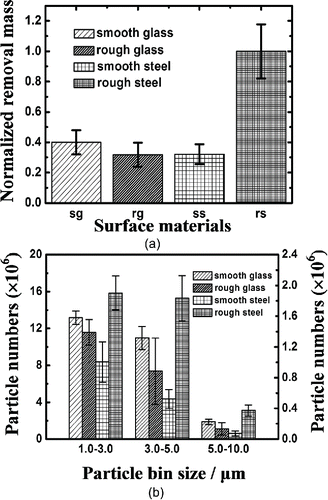
In general, if the roughness is much smaller than the deposited dust diameters, then an increase in roughness of the laden plate can promote particle resuspension, such as for the stainless steel plates. This is because with an increase in roughness, the contact area between the dusts and the plate decreases, which decreases the adhesion forces with the plate. This finding is consistent with the measurements by Corn Citation(1961), who concluded that a roughness within 220 to 480 nm could promote resuspension of particles with a diameter of tens of microns. Rabinovich et al. Citation(2000) further provided an estimation formula for the adhesion force between a particle and its adhered surface:[3] where Fad is the adhesion force, A is Hamaker's constant, d is particle diameter, Z0 is the minimum distance from the particle center to the adhered surface, k1 is a constant, Rrms is the root-mean-square roughness, and λ is the distance between two peak points. This formula implies that a larger roughness results in a smaller adhesion force. Figure S.9 in the SI also shows that most dusts are sparsely distributed at ρs = 0.46 g/m2; hence, the dusts are probably deposited in a single layer. Note that Equation Equation(3)
[3] is valid for 0.1 nm ≤ Rrms ≤ 20 nm, according to Rabinovich et al. Citation(2000). We extend this to explain the dust resuspension for our tests. Nevertheless, our findings agree with those found by Rabinovich et al. Citation(2000).
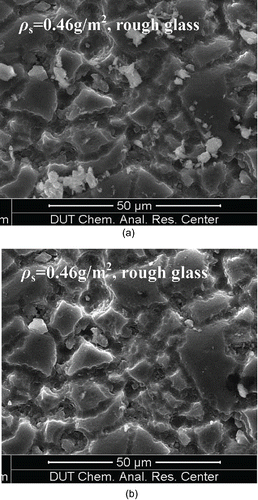
However, if the roughness is comparable to or much larger than the particle sizes, some dusts may be contained in concave pits of the plate, which makes dust resuspension extremely difficult. compares the dust distribution before and after a jet impingement. It can be clearly seen that most of the dusts above pits are resuspended, except for some dusts within some pits. This explains why fewer dusts were resuspended from the rough glass plate than from the smooth glass plate in .
Figure 10. Deposited dusts on the rough glass plate: (a) before a jet impingement, and (b) after a jet impingement.
4. Discussion
4.1. Limitation of the current study and future research
The parametric settings of the impinging jets in this investigation are not exactly identical to all of the jets encountered in indoor environments. For simplicity, a single pulsed jet was chosen as the disturbance source. On the one hand, pulsed jets are more intensive than constant jets, which would enhance the particle resuspension for measurement convenience. On the other hand, a single jet can minimize interruptions between jets. The extremely low jet height, such as H/D = 0.77, and the high surface dust load, such as 4.78 g/m2, are uncommon in typical indoor environments. Adopting these low or high ends of the test parameters enhances the particle resuspension for easy measurement and analysis.
The counted airborne particle numbers vary with particle sampler locations. Because the measurements are labor-intensive, we only measured the airborne particle numbers at one location. At different positions in the test section, the counted particle numbers and size distributions may be different. It is also difficult to differentiate the agglomerated particles from the original coarse particles. The particle agglomeration and deagglomeration require further fine investigation. Alternatively, we measured the total dust-removal mass as a key parameter to evaluate the particle resuspension strength. The extraction of air from the test section to the particle counter may lead to a negative pressure inside the test space. The negative pressure inevitably induces leaking in of the surrounding air that carries airborne particles. Nevertheless, we securely sealed the test section and most likely allowed an air leak into the test section after passing through the HEPA filters.
We used Equations Equation(1)[1] and Equation(2)
[2] to analyze the aerodynamic forces exerted on the deposited dusts when explaining the dust-removal zone shapes. Note that the wall shear stress is not identical to the aerodynamic forces on the dusts. Fundamental research is required to bridge them and to provide insightful explanations to various particle resuspension phenomena by jets. Equation Equation(3)
[3] has been overused to analyze the variation of dust resuspension with particle-laden plate roughness. Future studies may develop and verify more general models for particle-surface force interactions and detachment. In addition to surface roughness, the variation of the particle resuspension with other parameters of the particle-laden plates can also be investigated.
4.2. Potential applications
and illustrate that the particle resuspension generally decreases with the jet height. To minimize particle resuspension, the jets shall maintain a large distance from a dust-deposited surface. shows that the sparsely deposited dusts are more difficult to resuspend. Hence, indoor surfaces should be cleaned often to avoid dusts in a dense multilayer deposition. Meanwhile, either extremely smooth or extremely rough materials are a good choice for furnishing to prevent dusts from resuspending into the air, according to . However, for surface cleaning, opposite strategies should be adopted. In addition, based on , to remove dusts at a high surface dust load, an optimal jet height can be used to promote the particle resuspension into the air, and then the airborne dusts can be collected using a vacuum. The above provides a general outline of the very limited example application of the findings in this article.
5. Conclusions
This study experimentally measured the resuspension of ATDs from glass and stainless steel plates when impinged by a pulsed jet. The particle resuspension strengths are evaluated in terms of the dust-removal zone shape on the particle-laden plates, total dust-removal mass, and the airborne particle numbers. The variation of the particle resuspension with the jet impingement heights, surface dust loads, and particle-laden plate roughness was examined. Based on the obtained results, the following conclusions are drawn.
After a jet impingement, the dust-removal zone on the particle-laden plate appears as a disk at a low jet height and an annular stripe at a high jet height. In general, the dust-removal mass and airborne particle numbers decrease with the jet height. However, for dusts deposited at a high surface dust load, an appropriate jet height might resuspend the maximum amount of the particles. The dusts with a high surface dust load are more likely to be deposited in multiple layers and to agglomerate, requiring smaller threshold disturbance forces for resuspension. A jet height that well balances the jet-impacted area and the jet-created resuspension force can resuspend the maximum amount of deposited dusts.
In indoor environments, the measurement data of both the dust-removal mass and the collected airborne particle numbers support that sparsely deposited dusts are more difficult to resuspend than are densely deposited dusts. The jet impingement to a surface whose roughness is comparable to the particle diameters may cause severer airborne particle exposure than to surfaces with extremely small or large roughness values, with the rest conditions remaining the same. Sophisticated mathematical modeling is required to scientifically quantify indoor particle resuspension by various jets.
UAST_1143084_Supplementary_Files.zip
Download Zip (4.3 MB)Funding
This investigation was supported by the National Natural Science Foundation of China (NSFC) through grant 51278077.
References
- Arlian, L. G., Neal, J. S., Morgan, M. S., Rapp, C. M., and Clobes, A. L. (2001). Distribution and Removal of Cat, Dog and Mite Allergens on Smooth Surfaces in Homes with and Without Pets. Ann. Allergy Asthma Immunol., 87:296–302.
- Beltaos, S., and Rajaratnam, N. (1974). Impinging Circular Turbulent Jets. J. Hydraul. Eng.- ASCE, 100(10):1313–1328.
- Bin, Y., and Sekhar, S. C. (2007). Three-Dimensional Numerical Simulation of a Hybrid Fresh Air and Recirculated air Diffuser for Decoupled Ventilation Strategy. Build. Environ., 42:1975–1982.
- Boor, B. E., Siegel, J. A., and Novoselac, A. (2013). Monolayer and Multilayer Particle Deposits on Hard Surfaces: Literature Review and Implications for Particle Resuspension in the Indoor Environment. Aerosol Sci. Technol., 47:831–847.
- Corn, M. (1961). The Adhesion of Solid Particles to Solid Surfaces. J. Air Pollut. Control Assoc. 11:566--575.
- Eames, I. S., and Dalziel, B. (2000). Dust Resuspension by the Flow Around an Impacting Sphere. J. Fluid Mech., 403:305–328.
- Ferro, A. R., Kopperud, R. J., and Hildemann, L. M. (2004). Source Strengths for Indoor Human Activities That Resuspend Particulate Matter. Environ. Sci. Technol., 38:1759–1764.
- Gomes, C., Freihaut, J., and Bahnfleth, W. (2007). Resuspension of Allergen-Containing Particles Under Mechanical and Aerodynamic Disturbances from Human Walking. Atmos. Environ., 41:5257–5270.
- Gotoh, K., Karube, K., Masuda, H., and Banba, Y. (1996). High-Efficiency Removal of Fine Particles Deposited on a Solid Surface. Adv. Powder Technol., 7:219–232.
- Gotoh, K., and Masuda, H. (1998). Enhancement of Removal Efficiency of Deposited Single Particles by a High Speed Air Jet. J. Aerosol Sci., 29:S1231--S1232.
- Gupta, J. K., Lin, C. H., and Chen, Q. (2009). Flow Dynamics and Characterization of a Cough. Indoor Air, 19:517–525.
- Khalifa, H. E., and Elhadidi, B. (2007). Particle Levitation Due to a Uniformly Descending Flat Object. Aerosol Sci. Technol., 41:33–42.
- Krauter, P., and Biermann, A. (2007). Reaerosolization of Fluidized Spores in Ventilation Systems. Appl. Environ. Microbiol., 73:2165–2172.
- Kubota, Y., Hall, J. W., and Higuchi, H. (2009). An Experimental Investigation of the Flow Field and Dust Resuspension Due to Idealized Human Walking. J. Fluids Eng., 131:081104.
- Liu, Y., Hirama, D., and Matsusaka, S. (2012). Particle Removal Process During Application of Impinging Dry Ice Jet. Powder Technol., 217:607–613.
- Masuda, H., Gotoh, K., Fukada, H., and Banba, Y. (1994). The Removal of Particles from Flat Surfaces Using a High-Speed Air Jet. Adv. Powder Technol., 5:205–217.
- Oberoi, R. C., Choi, J. I., and Edwards, J. R. (2010). Human-Induced Particle Re-Suspension in a Room. Aerosol Sci. Technol., 44:216–229.
- Otani, Y., Namiki, N., and Emi, H. (1995). Removal of Fine Particles from Smooth Flat Surfaces by Consecutive Pulse Air Jets. Aerosol Sci. Technol., 23:665–673.
- Qian, J., and Ferro, A. R. (2008). Resuspension of Dust Particles in a Chamber and Associated Environmental Factors. Aerosol Sci. Technol., 42:566–578.
- Rabinovich, Y. I., Adler, J. J., and Ata, A. (2000). Adhesion Between Nanoscale Rough Surfaces. I. Role of Asperity Geometry. J. Colloid Interface Sci., 232:10–16.
- Reeks, M. W., Reed, J., and Hall, D. (1988). On the Resuspension of Small Particles by a Turbulent Flow. J. Phys. D: Appl. Phys., 21:574–589.
- Rosati, J. A., Thornburg, J., and Rodes, C. (2008). Resuspension of Particulate Matter from Carpet Due to Human Activity. Aerosol Sci. Technol., 42:472–482.
- Shi, Z., Dai, S., Liu, W., Chen, J., and Chen, Q. (2015). Numerical Study of Gasper-Induced Jet Flow with Detailed Gasper Geometry. Proceedings of ISHVAC-COBEE, ID: T6-573, pp. 1–8, July 12–15, 2015, Tianjin, China.
- Smedley, G. T., Phares, D. J., and Flagan, R. C. (1999). Entrainment of Fine Particles from Surfaces by Gas Jets Impinging at Normal Incidence. Exp. Fluids, 26:324–334.
- Spilak, M. P., Boor, B. E., Novoselac, A., and Corsi, R. L. (2014). Impact of Bedding Arrangements, Pillows, and Blankets on Particle Resuspension in the Sleep Microenvironment. Build. Environ., 81:60–68.
- Tang, J. W., Nicolle, A. D., Klettner, C. A., Pantelic, J., and Wang, L. (2013). Airflow Dynamics of Human Jets: Sneezing and Breathing-Potential Sources of Infectious Aerosols. PLoS One, 8:e59970.
- Wang, H. C. (1990). Effects of Inceptive Motion on Particle Detachment from Surfaces. Aerosol Sci. Technol., 13:386–393.
- Wang, S., Zhao, B., Zhou, B., and Zhongchao, T. (2012). An Experimental Study on Short-Time Particle Resuspension from Inner Surfaces of Straight Ventilation Ducts. Build. Environ., 53:119–127.
- Wells, W. F. (1955). Airborne Contagion and Air Hygiene – An Ecological Study of Droplet Infection. Harvard University Press, Cambridge, MA.
- Yakovleva, E., Hopke, P. K., and Wallace, L. (1999). Receptor Modeling Assessment of PTEAM Data. Environ. Sci. Technol., 33:3645–3652.
- Zhang, F., Reeks, M. W., Kissane, M. P., and Perkins, R. J. (2013). Resuspension of Small Particles from Multilayer Deposits in Turbulent Boundary Layers. J. Aerosol Sci., 66:31–61.
- Zhang, X. W., Yao, Z. H., Hao, P. F., and Xu, H. Q. (2002). Study on Particle Removal Efficiency of an Impinging Jet by an Image-Processing Method. Exp. Fluids, 32: 376–380.
- Zhu, S. W., Kato, S., and Yang, J. H. (2006). Study on Transport Characteristics of Saliva Droplets Produced by Coughing in a Calm Indoor Environment. Build. Environ., 41:1691–1702.
- Ziskind, G., Fichman, M., and Gutfinger, C. (1995). Resuspension of Particulates from Surfaces to Turbulent Flows—Review and Analysis. J. Aerosol Sci., 26:613–644.
- Ziskind, G., Yarin, L. P., Peles, S., and Gutfinger, C. (2002). Experimental Investigation of Particle Removal from Surfaces by Pulsed Air Jets. Aerosol Sci. Technol., 36: 652–659.