ABSTRACT
Man-made vitreous fibers (MMVFs) are noncrystalline substances made of glass, rock or slag and are widely used as thermal or acoustic insulation materials. There is continued concern about their potential health impacts and thus, their dosimetry and behavior in the environment still require study using filters to collect fiber samples. After deposition or exposure measurements of MMVFs it is often necessary to analyze the filters with deposited fibers. This task is tedious, time-consuming, and requires skill. Therefore, many researchers have tried to simplify or automatize fiber detection and quantification. This article describes features of our in-house software, which automatically detects and counts fibers in images of filter samples. The image analysis is based on the use of a histogram equalization and an adaptive radial convolution filter that enhances fiber contrast and thus, improves the fiber identification. The accuracy of the software analysis was verified by comparison with manual counting using ordinary phase-contrast microscopy method. The correlation between the methods was very high (coefficient of determination was 0.977). However, there were some discrepancies caused by false identifications, which led to implementation of manual corrective functions.
Copyright © 2016 American Association for Aerosol Research
EDITOR:
1. Introduction
Man-made vitreous fibers (MMVFs) are fibers of various compositions that are widely used in buildings as a thermal or acoustic insulation material. MMVFs are noncrystalline substances made mainly of glass, rock, slag or other minerals. Health concerns from exposure to MMVFs come from their physical similarities to asbestos. They have similar aerodynamic characteristics, which causes their penetration into the human respiratory system. Oberdorster Citation(2000) described pathogenicity of fibers with three parameters, in particular fiber dose, dimension, and durability. Fiber dose is generally expressed as particle mass deposited in the lungs, but with respect to fibrous aerosols particle number is also accepted. Fiber dimensions, in particular fiber length and diameter, determine deposition hot spots and affect the retention time of fibers in human respiratory tract. Fiber durability or fiber biopersistence means the overall retention capability of fibers in the lungs, which is influenced, e.g., by resistance to mechanical breakdown or chemical dissolution (DeVuyst et al. Citation1995). It is well known that exposure to asbestos leads to malignancies such as mesothelioma or lung carcinoma (IARC Citation2012). However, such results were not confirmed for MMVFs. The International Agency for Research on Cancer classified MMVFs as noncarcinogenic, because there is inadequate evidence for carcinogenicity in humans (IARC Citation2002). This finding may result from their lower biopersistence compared to asbestos, e.g., the MMVFs are more soluble and they tend to decompose transversely compared to tangential breakage of asbestos (DeVuyst et al. Citation1995; Hesterberg et al. Citation1996). Despite the lower risk of MMVFs, there are recommendations for occupational exposure limits for MMVFs in the range of 1–3 fibers/ml depending on the fiber type (SCOEL Citation2012).
Thus, it remains important to obtain additional information from both lung deposition and exposure measurements. The outputs of such measurements are membrane filters onto which the fibers deposited. Each filter has to be inspected and the individual fibers have to be counted to obtain the fiber concentrations. Several analytical methods were established to determine airborne concentrations of fibers, including NIOSH 7400 methodology developed for asbestos and other fibers using phase-contrast microscopy (PCM method) (NIOSH Citation1994). Drawbacks of these methods are their poor consistency and reproducibility. Manual fiber counting is very time consuming and requires high skill in the analyst such as visual acuity, concentration while counting, care for adjusting a microscope, experience in counting fiber bundles etc. Aforementioned flaws can cause fiber counts for the same samples to vary greatly between different analysts and laboratories (Pang Citation2000).
Many groups have tried to simplify or automate counting practices and decrease the influence of human factor on the results largely focused on filters with asbestos fibers. Lundgren et al. Citation(1995) connected a microscope to a Macintosh computer with special video card and software. An analyst was able to mark fibers with a mouse on a screen and the software displayed total fiber counts. Other groups tried to automate the counting mostly using various image analysis methods (IAMs). One of the earliest works was proposed by Manchester University's Asbestos fiber-counting Program (MAP) (Kenny Citation1984). Their software called Magiscan gave reasonable agreement with manual counts, but it was not consistent for all types of samples. It produced precise results at lower counts, but undercounted fibers on heavily loaded filters. This bias was a result of the software development, which was done primarily on filters with low fiber numbers (Baron and Shulman Citation1987). The most frequent errors of Magiscan were missed fibers, broken fibers, and false identification of nonfibrous particles. Inoue et al. (Inoue et al. Citation1998) introduced Asbestos Fibers Automatic Counting System (AFACS), which was a home-made software written in C language. The AFACS was capable of post-processing, such as restoration of broken fibers according to their orientation and thickness. The accuracy of AFACS was verified and compared with counting facilities. The AFACS counts were similar to manual counts and were considered to be equivalent, although the AFACS counted some fibers that were missed by manual counters and vice versa.
Cho et al. Citation(2011) focused mainly on improvement of image acquisition part of their IAM. They described High Through-put Microscopy method for counting asbestos fibers, which employed a charge couple device (CCD) camera and a robotic stage to quickly scan the entire filter area processing up to 300 images in 5 min. In another study (Cho et al. Citation2013) they tagged fibers with a fluorescent protein and analyzed them with fluorescence microscopy (FM) to enhance the detection limit for small and thin fibers. The freeware image processing software ImageJ with appropriate plugins was used for image analysis. However, the counting rules were not implemented into the software so it was not possible to count overlapping or crossed fibers, fiber bundles or differentiate oval-shaped particles. Further use of FM was made by Alexandrov et al. Citation(2015). They used Asbester Counter Software for the image analysis. Although the application of FM should have eliminated nonfibrous particles with only asbestos fibers being visible in the FM images, some dust particles were still found. These particles caused discrepancies, especially for low concentration samples, because their edges were misidentified as fibers. Other IAMs for fiber counting were presented in Theodosiou et al. Citation(2010), Ishizu et al. Citation(2008), and Moriguchi et al. Citation(2009). However, they did not get further than to testing and preliminary results. One of the problems of these IAMs was the occurrence of air bubbles from sample preparation (Ishizu et al. Citation2010), which biased the total fiber counts. As it can be seen, development of fully automatic IAM for fiber counting with sufficient accuracy is a very difficult task not completely solved yet.
As an output of in vitro deposition experiments we obtained a set of several hundreds of filter samples with deposited fibers, which needed to be analyzed. Since manual inspection and counting of fibers is very time consuming, tedious and sensitive to subjective errors, it would be valuable to use an IAM for fiber counting. Because all the methods that have been reported to date are inaccurate, expensive or not freely available, we developed our own software. By doing so, it is possible to easily adjust its features for different types of particles in future experiments. This article describes the main features of our software and presents a comparison with manual PCM method results.
2. Experimental setup
2.1. The phase-contrast microscopy method
2.1.1. Sample preparation
Millipore AAWP02500 nitrocellulose membrane filters (Merck Millipore, Billerica, MA, USA) were used as part of an in vitro deposition measurements in the model of human respiratory tract (Belka et al. Citation2013). The model consisted of upper respiratory airways and several generations of the tracheobronchial tree (Lizal et al. Citation2012). The filters were situated as output filters from each branch of the bronchus to collect particles passing through the model. We used glass fibers, processed by crushing of glass wool. The glass fibers were classified according to their length causing the mean fiber length to be approximately 15 µm and the mean diameter to be 1 μm (Wang et al. Citation2005). After the filters were loaded with fibers an acetone-immersion method was applied to clear the filter (NIOSH Citation1994). The filters were mounted on clean glass slides and made transparent using a Quick fix acetone vaporizer (EMS Inc., Charleston, USA). The slides with filters were then kept in a desiccator for sufficient amount of time to dry. The samples featured generally low amount of dust and other nonfibrous particles. The fiber area density varied from 100 to 1300 fiber/mm2. Ten representative samples with various fiber loads were chosen from the set to optimize the software development and to validate its results.
2.1.2. Manual counting
The manual counting was conducted using PCM, which is fast and requires less skill than electron microscopy. Moreover, the speed of PCM was suitable for the software development, which required a lot of tests, such as taking images with various camera settings. Each glass slide with a filter from the 10 samples was manually placed on a stage of Nikon Eclipse E200 microscope (Nikon, Tokyo, Japan) equipped with a nominal 10× eyepiece and a nominal 40× phase contrast objective. The microscope was focused on the fibers and Walton-Beckett graticule was used for sizing the fibers. The graticule consists of a circle with projected diameter of 300 μm (area of about 0.07 mm2). Manual counting was conducted by four practiced analysts using NIOSH 7400 counting B rules, e.g., only fibers longer than 5 µm, with diameter less than 3 μm and with length to width ratio greater or equal to 5:1 were to be counted. The only significant modification of the methodology was that 20 fields were inspected on each filter rather than to fulfill a minimal fiber count rule. Moreover, the entire filter area was used for counting instead of cutting a wedge as recommended by the standard methodology. Because different parts of the filter were inspected by the analysts, it was necessary to compare property of the whole filter, such as total fiber number or fiber area density. Since the total fiber numbers were in the order of hundred thousands, fiber densities were calculated for their better readability. The fiber area density is calculated by dividing average fiber count per graticule field by the graticule field area. Fiber area density for every filter was calculated as:
[1] where Fi is total fiber count on the sample i, nf denotes the number of inspected fields per sample and Af is the graticule field area. Since four analysts performed manual counting, geometric averages of the fiber area densities with geometric standard deviations were calculated for every sample. These average densities were considered as the “right” densities and were used for optimization of the software.
2.2. The image analysis method
2.2.1. Image acquisition
An IR-UV light filter and a monochrome camera Atik 314E (Atik cameras, Norwich, UK) were attached to the microscope to acquire a set of filter images. The nonuniformity in fiber distribution on a filter could cause discrepancies in the results, because only a part of each filter was inspected. This problem was partly solved by changing a 40× phase contrast objective to a 10× objective. Because the glass fibers with diameter of 1 μm were used, it was possible to decrease the magnification and, thus increase the examined filter area while keeping the visibility of the fibers at sufficient level. Resolution of the camera was 1619 × 1219 pixels and image area was 0.34 mm2. The camera was connected to a computer with Artemis/ATK capture software. Sixteen images of each filter were taken and their analysis was executed afterward.
2.2.2. Image processing
The novel software uses several steps to correct and change the fiber contrast to improve their detection by thresholding (). Even though the camera was properly adjusted and enough illumination was used, the brightness of original images was not sufficient. Some of the fibers did not have sufficient contrast and their visibility was very poor (). To enhance the fiber contrast the Adaptive Contrast Control (ACC) method was applied. This method is based on method by Zhu et al. Citation(1999). It increases the contrast of an object with respect to its size, which can be used for brightness enhancement of poorly visible objects such as thin fibers. The ACC method calculates an equalization function using pixel brightness values from the respective neighborhood of each pixel. Application of this function creates a new calibrated image. Let Im×n = (P[i,j]) be the image brightness matrix of pixel P and its rectangular neighborhood NPw×h(i,j), where w and h are neighborhood dimensions. The equalization function φPwh can be calculated using following formulas for each l in , where Lmax is maximum pixel value in this field.
Figure 1. Image analysis process: (a) original image and its histogram; (b) image and histogram after ACC application; (c) image and histogram after adaptive radial convolution, T denotes threshold; (d) segmented image; (e) image with identified fibers.
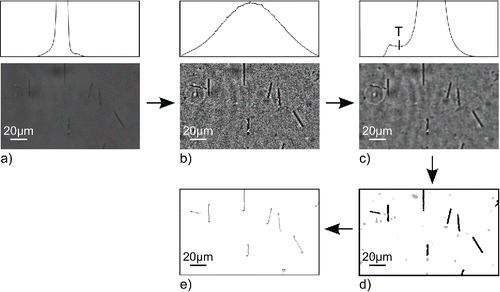
The ACC method increased contrast of the fibers in the image, but also of any additive noise. The additive noise was not separated in brightness from the fibers, which can be seen from the image histogram with unimodal distribution (). It is required to have bimodal distribution to correctly identify individual fibers by thresholding.
To do this, an adaptive radial convolution filter was applied. Detailed mathematical description and derivation can be found in Starha et al. Citation(2013). A classical Gaussian radial convolution filter used as a low-pass filter attenuates high spatial frequencies in a convolution function. The convolution function h(α,β) for the radial convolution filter is defined as
[5] where α0, β0, ςα and ςβ are constants. If this classical radial convolution filter was used, all of the additive noise, as well as fiber edges, would be suppressed and the fiber detection by thresholding would be still biased. This problem can be solved by addition of a weight function, which causes the radial filter to prefer certain directions more than others. This method recognizes directions of fiber edges by application of the stochastic approach. The fiber edge is defined as a change of the image from dark to bright, particularly the variance of image values is much higher in the direction of a fiber edge than in the absence of an edge. Because of this, the radial filter with its weight function recognizes fiber edges and adapts its properties to different parts of the image. Application of the adaptive radial filter caused suppression of noise while the fiber contrast was preserved. As it can be seen in , the image histogram presented a bimodal distribution and the image could be segmented by means of thresholding. The threshold T was set close to a minimum value between the two modes.
2.2.3. Object classification and fiber counting
Objects identified by thresholding were not only fibers, but also other objects, such as dust particles (). For this reason it was necessary to classify all the objects and choose only those that fulfilled certain rules, i.e., fibers. Fiber recognition was done by the moment method, which is based on the fact that shape of every object can be described by moment invariants (Ming-Kuei Citation1962). The fiber moments were described by this method and all particles, which did not fit into this group, were excluded from the selection.
It was also essential to know the fiber dimensions to correctly count all of the fibers, because only fibers longer than 5 μm were to be counted. Additionally, it allowed the verification of the proper functioning of the electrical diffusion-phoretic fiber classifier (Wang et al. Citation2005) that was employed to separate the fibers according to their length. Fiber lengths were obtained by an erosion method using digital line structuring. This method calculates fiber core-line, which is a line of one pixel width defined by starting and end points. The fiber length is then expressed from the calculated core-line and known size of the pixel. Since the core-line is only one pixel wide, its length depends on the distances between adjacent pixels. If the pixels are adjoined vertically or horizontally, the distance between them equals the size of a pixel. If the pixels are adjoined diagonally, the distance between them equals the pixel diagonal. The total fiber length is a sum of distances between all the pixels of the core-line. depicts final image after object classification and transformation of fibers into digital lines.
The identified fibers were counted afterward. A Walton-Beckett graticule is employed in PCM method to help size the fibers and better identify the fibers, which occur on the edge of counting area. Fibers with only one end point lying in the counting area are counted as ½ of a fiber. An elliptical field with area of 0.167 mm2 was created in the software in order to follow this feature of the PCM method (). This step was necessary for the determination of the actual size of all counted fibers. If the whole image was used for counting, only part of the fibers lying at the edge would be visible and the calculation of their actual sizes would be biased. The elliptical shape of the field has several advantages compared to rectangular field. There is lower probability that the fiber lies with both ends outside the field and its center inside the field, such as at the corners. Moreover, it is less likely that the fiber lies right on the edge of elliptical field compared to rectangular one. The software counted all the end points of fibers lying in the counting area and the number of end points was divided by two to get the final fiber count.
Figure 2. The use of elliptical field to correctly determine the actual size of all counted fibers; dimensions of semimajor and semiminor axis are 0.266 and 0.2 mm (area of about 0.167 mm2).
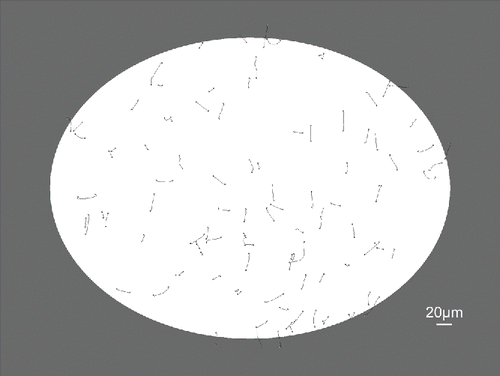
This procedure was applied to all filter images and respective fiber counts were acquired. Equation Equation1[1] was used for the calculation of fiber area densities for all samples, where Fi denotes total fiber count on the sample i calculated by the software, nf is number of images per sample and Af is counting area (area of the elliptical field). The results of the automatic method were validated by the PCM method afterward. The manual method contains several uncertainties caused by the methodology, such as the choice of inspected fields. By comparing the properties of entire filters, such as fiber area densities, it can be seen how the methods agree amongst themselves including all the limitations.
2.2.4. Manual corrections
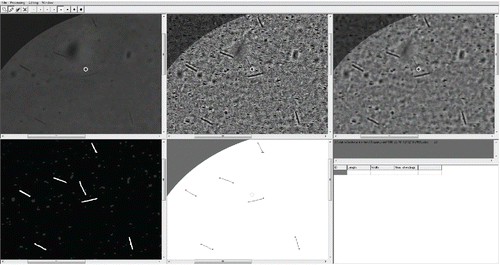
The software allows it to be used in “correction” mode to assist the analysts to reject false identifications or restore broken fibers during postprocessing. The software interface can be seen in with first five windows representing different steps of image analysis. The results of the analysis are displayed in the sixth window in the bottom right corner. The selected portion of the filter can be displayed by the analyst and compared across the various stages of the IAM process. This combination of different steps of IAM simplifies the corrections, because, e.g., the visibility of particles is the highest after ACC application, but the particle origins are best determined in the original image. In cases of filters with high fiber area densities, it is very complicated to orientate and localize a particle of interest in the different windows. Therefore, a yellow circle cursor was integrated to improve orientation by defining the current position in all the windows. All of the corrections and the identified particles are highlighted in the segmented image (left bottom corner). Object identification and fiber counting can be launched after the corrections are made and a corrected fiber count is displayed.
3. Results and discussion
3.1. The PCM method
The results from the four analysts were compared and are listed in . The fiber area densities of test samples varied from 100 to 800 fibers/mm2. The coefficient of variation (COV) among analysts ranged from 8 to 16%. The coefficient of variation is defined as the ratio of standard deviation to the average value and represents probability distribution. The differences between manual counts are generally caused by the sensitivity of the method to operator judgment, which can be influenced by not counting fibers with low contrast or counting one fiber twice in high area density samples. Moreover, fibers were not distributed uniformly on the filters with higher fiber area densities being found towards the filter center. Since every analyst inspected only 20 randomly chosen fields, the choice of the inspected fields could cause a slight difference in fiber counts even if fibers were counted properly.
Table 1. Fiber area densities given by analysts for ten samples; SD denotes standard deviation and COV is coefficient of variation.
3.2. Validation of the IAM
The collected images of the fibers had very low contrast and also contained nonfibrous particles. While the human eye is able to adapt to different background brightness, suppress additive noise and ignore dust particles, IAMs require various image modifications to successfully detect the particles. We found that the application of the ACC and the adaptive radial convolution filter enhanced the fiber contrast while the contrast of the background noise remained low. This process improved the detection limit of the IAM, and thus, very thin and low contrast fibers were detected. The moment method was then applied to restrict counting nonfibrous particles.
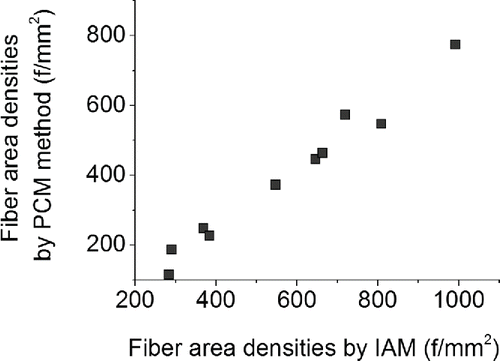
Results of the software were validated by comparison with the results of PCM method. Both methods were employed to acquire fiber area densities on ten filter samples. The correlation between the methods is depicted in . Although the coefficient of determination was very high (R2 = 97.7%), there were some discrepancies between the methods and the IAM appears to have overestimated the fiber area densities in all samples.
The main causes of this trend were false object identifications, particularly misidentified particles, and broken fibers. The moment method was applied to select fibers from all of the objects present in the image. This method is, just like NIOSH methodology, unable to distinguish between fibers and elongated particles. Therefore, dust particles resembling fibers are considered to be fibers. Moreover, our IAM falsely identified edges of large dust particles as elongated particles and counted them as fibers.
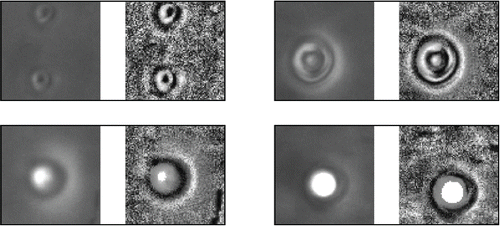
Another problem in object identification was caused by circular particles or so-called bubbles (). Ishizu et al. Citation(2010) indicated that these bubbles could be created during specimen preparation. The bubbles were located in a different plane than the fibers and were out of focus during image acquisition. This mismatch in focal plane produced halos around the bubbles. During the image processing the halo contrast was enhanced by the ACC and resembled large circular particles. In addition, the edges of these false particles were sometimes identified as objects during thresholding and could be selected as fibers. This problem was caused by the moment method settings. The moment method exclude nonfibrous particle from the final selection based on their geometric properties. The settings of the moment method were rather universal, but with the knowledge of the moment invariants of various nonfibrous particles, such as bubbles, microorganisms or membrane particles, it would be possible to adjust the method for specific cases.
Figure 6. Examples of false identification in three steps of IAM: Original image, application of ACC, fiber identification; (a) crossed fibers, (b) dust particle, (c) crossed fibers, (d) single fiber; particle image size is 24 × 40 μm.
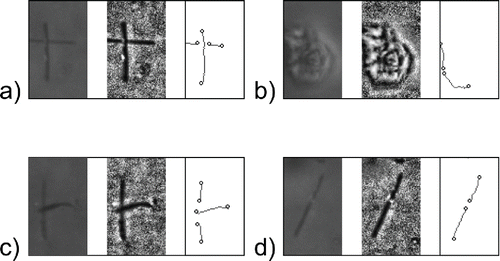
Apart from false object identification, fibers were sometimes split into shorter objects during thresholding () caused by the drop in contrast along the fiber, such as in the case of fiber crossing. The upper fiber was identified as one piece, but fiber underneath was split into two separate objects and misinterpreted as different fibers. This problem could be solved in postprocessing step using information from the moment method. The fibers could be restored based on their orientation, thickness and mutual distance. However, this feature will require further tests and optimization for high area density samples.
3.3. Corrected IAM
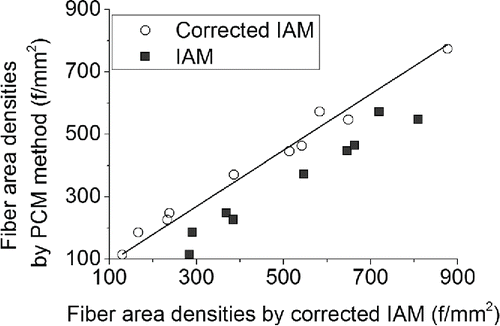
The software allows manual corrections of the false object identifications. To validate this approach the results of the IAM were corrected by an analyst using the software feature and the resulting fiber area densities were compared to the PCM method again. As can be seen in , the IAM accuracy was improved and differences between methods decreased. The coefficient of determination increased from 97.7 to 98.5%. Moreover, average coefficient of variation decreased from 56 to 10% after the corrections. These results show that the accuracy of the corrected IAM is as high as the accuracy of the PCM method. The discrepancies between the corrected IAM and the PCM method can be caused by the sensitivity of both methods to the choice of inspected fields. Although the lower magnification was used for the automatic method, the software algorithms compensated for this drawback and even thin and low contrast fibers were counted.
Even though the software is not yet ready to be used in the fully automatic mode, it can be reliably used with manual corrections. Since the corrected images are stored, they can be opened and examined repeatedly. This way the software can be used for educational purposes and analysts who are not skilled and experienced can learn to analyze fiber samples. Moreover, as stated by Lundgren et al. Citation(1995), fiber counting using a computer is more user-friendly and less exhausting than counting using a microscope. Apart from that, the errors in identification and counting of certain kinds of particles were observed and their future solution can bring more precise results and development of the fully automatic fiber counting instrument. Current version of the software can be found and downloaded at http://www.energetickeforum.cz/ext/2pf/software/.
4. Conclusions
This article presents an in-house software intended for automatic fiber counting using image analysis. The software was developed and optimized on filters with deposited glass fibers, which were obtained during in vitro deposition measurements. However, the software can be used for counting of various kinds of fibers. The analyzed images are saved on a hard-drive and can be checked or examined repeatedly. The software is able to identify fiber shape and determine its length, which is the most important parameter for fiber counting and determination of fiber pathogenicity. It is worth noting that the software was used to analyze images from PCM at total magnification of 100×. Although this magnification was sufficient for the analysis of MMVFs, the analysis of some kinds of asbestos fibers, such as chrysotile fibers, can be biased. However, this limitation could be overcome by the change of the magnification and adjustment of the software settings.
We found that the use of histogram equalization and adaptive radial convolution filter can enhance the fiber contrast while additive noise remained suppressed. This way the software is able to localize and identify even very thin and short fibers. Results of the software were validated by comparison with the manual PCM method indicating some shortcomings in the IAM. The software overestimated the fiber counts, which was mostly caused by broken fibers or misidentification of particle edges as fibers. Therefore, it is desirable to check every analyzed image and correct false identifications with software corrective functions. The time efficiency of the automatic method is reduced due to this step, however, it is still more convenient and less exhausting than the PCM method.
Despite these minor limitations, the software can be used for fiber counting analysis, because it can help the analyst with fiber localization and summation of all fibers. Moreover, the present errors of the counting were observed and analyzed. Future work should, therefore, concentrate on improvement of fiber identification and restoration of broken fibers using postprocessing functions. The program can be obtained by contacting the first author.
Funding
Authors greatly acknowledge support from the projects FCH/FSI-J-14–2479 and LO1202 NETME CENTRE PLUS funded by the Ministry of Education, Youth and Sports of the Czech Republic under the National Sustainability Programme I and projects no. 105/11/1339 and 16–23675S funded by the Czech Science Foundation.
References
- Alexandrov, M., Ichida, E., Nishimura, T., Aoki, K., Ishida, T., Hirota, R., Ikeda, T., Kawasaki, T., and Kuroda, A. (2015). Development of an Automated Asbestos Counting Software Based on Fluorescence Microscopy. Environ. Monit. Assess., 187:4166
- Baron, P. A., and Shulman, S. A. (1987). Evaluation of the Magiscan Image Analyzer for Asbestos Fiber Counting. Am. Ind. Hyg. Assoc. J., 48:39–46.
- Belka, M., Lizal, F., Jedelsky, J., and Jicha, M. (2013). Analysis of Fiber Deposition Using Automatic Image Processing Method. Epj. Web. Conf., 45. doi: 10.1051/epjconf/20134501011.
- DeVuyst, P., Dumortier, P., Swaen, G. M. H., Pairon, J. C., and Brochard, P. (1995). Respiratory Health Effects of Man-Made Vitreous (Mineral) Fibres. Eur. Respir. J., 8:2149–2173.
- Hesterberg, T. W., Miiller, W. C., Musselman, R. P., Kamstrup, O., Hamilton, R. D., and Thevenaz, P. (1996). Biopersistence of Man-Made Vitreous Fibers and Crocidolite Asbestos in the Rat Lung Following Inhalation. Fund. Appl. Toxicol., 29:267–279.
- Cho, M. O., Chang, H. M., Lee, D., Yu, Y. G., Han, H., and Kim, J. K. (2013). Selective Detection and Automated Counting of Fluorescently-Labeled Chrysotile Asbestos Using a Dual-Mode High-Throughput Microscopy (DM-HTM) Method. Sensors, 13:5686–5699.
- Cho, M. O., Yoon, S., Han, H., and Kim, J. K. (2011). Automated Counting of Airborne Asbestos Fibers by a High-Throughput Microscopy (HTM) Method. Sensors, 11:7231–7242.
- IARC. (2002). Monographs on the Evaluation of Carcinogenic Risks to Humans, in Man-Made Vitreous Fibers. International Agency for Research on Cancer, Lyon, France.
- IARC. (2012). Monographs on the Evaluation of Carcinogenic Risks to Humans, in Arsenic, Metals, Fibres, and Dusts. International Agency for Research on Cancer, Lyon, France, pp. 219-310.
- Inoue, Y., Kaga, A., Yamaguchi, K., and Kamoi, S. (1998). Development of an Automatic System for Counting Asbestos Fibers Using Image Processing. Part. Sci. Technol., 16:263–279.
- Ishizu, K., Takemura, H., and Kawabata, K. (2010). Automatic Counting Robot Development Supporting Qualitative Asbestos Analysis: Asbestos, Air Bubbles, and Particles Classification Using Machine Learning. J. Robot. Mechatron., 22: 506–513.
- Ishizu, K., Takemura, H., Kawabata, K., Asama, H., Mishima, T., and Mizoguchi, H. (2008). Image Processing of Particle Detection for Asbestos Qualitative Analysis Support Method—Particle Counting System Based on Classification of Background Area, in 10th International Conference on Control Automation Robotics & Vision: Icarv 2008, IEEE, New York, NY, pp. 868–873.
- Kenny, L. C. (1984). Asbestos Fiber Counting by Image-Analysis—The Performance of the Manchester Asbestos Program on Magiscan. Ann. Occup. Hyg., 28:401–415.
- Lizal, F., Elcner, J., Hopke, P. K., Jedelsky, J., and Jicha, M. (2012). Development of a Realistic Human Airway Model. Proc. Inst. Mech. Eng. H, 226:197–207.
- Lundgren, L., Lundstrom, S., Laszlo, I., and Westling, B. (1995). Modern Fiber Counting—A Technique with the Phase-Contrast Microscope Online to a Macintosh Computer. Ann. Occup. Hyg., 39:455–467.
- Ming-Kuei, H. (1962). Visual pattern recognition by moment invariants. Inf. Theory, IRE Trans., 8:179–187.
- Moriguchi, Y., Hotta, K., and Takahashi, H. (2009). Asbestos Detection from Microscope Images Using Support Vector Random Field of Local Color Features, in Advances in Neuro-Information Processing, Pt Ii, ed., Springer-Verlag, Berlin, Berlin, pp. 344–352.
- National Institute for Occupational Safety and Health (NIOSH). (1994). NIOSH Manual of Analytical Methods; ASBESTOS and OTHER FIBERS by PCM 7400, 4th ed., in DHHS (NIOSH) Publication No. 94-113, U.S. Department of Health and Human Services, Cincinnati, Ohio, USA.
- Oberdorster, G. (2000). Determinants of the Pathogenicity of Man-Made Vitreous Fibers (MMVF). Int. Arch. Occ. Env. Hea., 73:S60–S68.
- Pang, T. W. S. (2000). Precision and Accuracy of Asbestos Fiber Counting by Phase Contrast Microscopy. Aihaj., 61:529–538.
- Scientific Committee on Occupational Exposure Limits (SCOEL). (2012). Recommendation from the Scientific Committee on Occupational Exposure Limits for Man Made-Mineral Fibres (MMMF) in SCOEL/SUM/88, European Commission. Employment, Social Affairs and Inclusion.
- Starha, P., Druckmüllerová, H., Belka, M., Lizal, F., and Jedelsky, J. (2013). Application of Adaptive Radial Convolutional Filter, in 19th International Conference on Soft Computing, MENDEL 2013, Brno, pp. 357–362.
- Theodosiou, Z., Tsapatsoulis, N., Bujak-Pietrek, S., Szadkowska-Stanczyk, I., and Ieee (2010). Airborne Asbestos Fibers Detection in Microscope Images using re-initialization free Active Contours, in 32nd Annual International Conference of the IEEE Engineering-in-Medicine-and-Biology-Society (EMBC 10), Ieee, Buenos Aires, ARGENTINA, pp. 4785–4788.
- Wang, Z., Hopke, P. K., Baron, P. A., Ahmadi, G., Cheng, Y.-S., Deye, G., and Su, W.-C. (2005). Fiber Classification and the Influence of Average Air Humidity. Aerosol Sci. Technol., 39:1056–1063.
- Zhu, H., Chan, F. H. Y., and Lam, F. K. (1999). Image Contrast Enhancement by Constrained Local Histogram Equalization. Comput. Vis. Image Und., 73:281–290.

