
ABSTRACT
Occupational exposure to nanomaterial aerosols poses potential health risks to workers at nanotechnology workplaces. Understanding the mechanical stability of airborne nanoparticle agglomerates under varied mechanical forces and environmental conditions is important for estimating their emission potential and the released particle size distributions, which in consequence alters their transport and human uptake probability. In this study, two aerosolization and deagglomeration systems were used to investigate the potential for deagglomeration of nanopowder aerosols with different surface hydrophilicity under a range of shear forces and relative humidity conditions. Critical orifices were employed to subject airborne agglomerates to the shear forces induced by a pressure drop. Increasing applied pressure drop was found to be associated with decreased mean particle size and increased particle number concentrations. Rising humidity decreased the deagglomeration tendency as expressed by larger modal particle sizes and lower number concentrations compared to dry conditions. Hydrophilic aerosols exhibited higher sensitivities to changes in humidity than hydrophobic particles. However, the test systems themselves also differed in generated particle number concentrations and size distributions, which in turn altered the responses of created aerosols to humidity changes. The results of the present study clearly demonstrate that (a) humidity control is essential for dustiness and deagglomeration testing, (b) that (industrial) deagglomeration, for example, for preparation of aerosol suspensions, can be manipulated by subjecting airborne particles to external energies, and (c) that the humidity of workplace air may be relevant when assessing occupational exposure to nanomaterial aerosols.
Copyright © 2016 American Association for Aerosol Research
Editor:
1. Introduction
Engineered nanomaterials (ENMs) are widely used in various industrial sectors (Schmid et al. Citation2010). Human exposure to aerosols of ENM powders has been shown to occur in a variety of workplaces dealing with nanotechnologies. These included laboratory activities as well as industrial processes, such as synthesis, handling, and cleaning (Brouwer Citation2010; Kuhlbusch et al. Citation2011). Studies identified the distinct properties of the airborne ENMs released in these occupational situations (e.g., number concentration and size distribution). These properties may be associated with process characteristics, such as the energy input level. The different characteristics of aerosol particles influence their airborne transport, transformation, and deposition including deposition in the lungs (Oberdorster et al. Citation2005). Once inhaled, ENMs can pose various adverse effects on human bodies, such as inflammation (Cho et al. Citation2012), the generation of oxidative stress (Fukui et al. Citation2012), DNA damage (Sandra et al. Citation2015), and translocation to secondary organs, thus potentially altering their functionalities (Kreyling et al. Citation2009; Petitot et al. Citation2013). The biological effects of ENM aerosols are closely related to their physicochemical characteristics, such as particle number, size and surface area, and functionality (Castranova Citation2011; Schaeublin et al. Citation2011; Xiong et al. Citation2013). Thus, occupational health risks associated with airborne ENMs do exist and it is important to understand their properties once they have been released into work environments in order to assess potential risks and to develop efficient methods for release and exposure prevention.
Understanding the mechanical stability of airborne particle agglomerates is very important for correctly estimating the size profile of aerosols. Aerosol particles often exist as agglomerates and can be held together by different types of interparticle forces (Schneider and Jensen Citation2009). It is probable that agglomerated particles break up into smaller agglomerates, or even primary particles, when subjected to larger dispersion forces during release, transport along exposure routes, and during inhalation (Li and Edwards Citation1997; Li et al. Citation1996). Deagglomeration modifies the size distribution of aerosol particles, which in turn can lead to altered biological interactions. Therefore, we studied the deagglomeration potential of airborne ENMs by subjecting them to a range of energy inputs and relative humidity (RH) conditions.
Aerodynamic deagglomeration processes have been studied using a variety of systems, such as a critical orifice or a nozzle, capillary tubes, a stationary plate, a mixer-disperser, or a fluidized bed (Calvert et al. Citation2009). Aerosol particles are accelerated through a critical orifice, creating shear flow. This in turn induces turbulence and shear forces on the particles, promoting collisions between them (Fonda et al. Citation1999; Stahlmecke et al. Citation2009; Sosnowski et al. Citation2014; Ding and Riediker Citation2015). Capillary tubes deagglomerate airborne particles by velocity gradient from sheath flow and by impaction at the tube inlet. Particle agglomerates deform due to the acceleration process through a nozzle and break against stationary plates by impaction (Kousaka et al. Citation1979; Froeschke et al. Citation2003; Ihalainen et al. Citation2012; Ihalainen et al. Citation2013). Mixer-dispersers and fluidized beds induce similar turbulent conditions to the above processes (van Ommen et al. Citation2012; Henry et al. Citation2013; Parveen et al. Citation2013). These methods feature a range of energy inputs and have been used to achieve different aerosol dispersion levels.
RH is known to have an influence on aerosol properties. Increased RH facilitates condensation of moisture onto particle surfaces, leading consequently to an increase in adhesion forces, e.g., simply by enlarging the contact area and increasing the capillary force (Butt and Kappl Citation2009). This process modifies the size distribution of aerosols directly (particle growth due to condensation) and indirectly by their lower probability to deagglomerate. Numerous studies have investigated the effects of RH on the dispersion of microsized pharmaceutical powder particles (Bérard et al. Citation2002; Price et al. Citation2002; Zhu et al. Citation2008). However, few studies have looked at deagglomeration behavior of ENM, especially in aerosols created from industrial powders that are associated with occupational risks. Due to the enlarged surface area of nanoscale particles, they can be more sensitive to changes in humidity than their macroscopic counterparts (Pakarinen et al. Citation2005; Butt and Kappl Citation2009).
In the present work, we used two aerosolization and deagglomeration systems based on the critical orifice method to study the potential deagglomeration of nanopowder aerosols subjected to a range of RH conditions. Two identically sized titanium dioxide (TiO2) nanopowders of different surface hydrophilicity were tested to study the effects of humidity. A broad range of energy inputs was applied to the airborne particles in order to qualitatively assess the interparticle bonding strength.
2. Materials and methods
2.1. Materials
The ENMs tested came from the repository at the European Commission Joint Research Center (JRC–IHCP in Ispra). They were hydrophobic (NM-103) and hydrophilic (NM-104) nanoscale TiO2 particles. Both types of nanoparticles are coated with a layer of aluminum oxide (Al2O3), and for NM-103 an additional polysiloxane polymer layer is included. The primary particle size is 20 nm (determined by x-ray diffraction), with a specific surface area of 60 m2/g and rutile crystal structure (producer information, for more detailed characterization results for NM-series materials, see also Rasmussen et al. Citation2014).
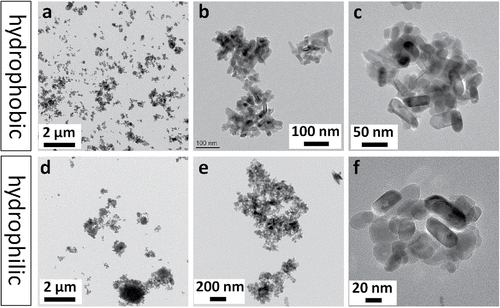
A morphological analysis of the airborne samples is shown in . The samples were collected at the flow rate of 0.3 L/min, for the duration of 3 min, by a Mini-Particle Sampler (MPS, ECOMESURE, France). The images are presented at low magnification for the overall distribution of particles on a filter, as well as at high magnification to show the morphologies of individual agglomerates and primary particles. Comparing the two materials, agglomerates of the NM-104 hydrophilic TiO2 reached sizes of up to several microns, whereas those of the NM-103 hydrophobic TiO2 were generally smaller than 1 µm. The primary particles typically had spherical or rod-like shapes. The hydrophobic coatings were not visible.
Figure 1. Transmission electron microscopy analysis of particle morphology for the hydrophobic (NM-103) and hydrophilic (NM-104) TiO2 aerosols.
2.2. Test systems
The setups used in this study have both been described previously in detail (Stahlmecke et al. Citation2009; Ding and Riediker Citation2015; Ding et al. Citation2015). Both methods use critical orifices to apply shear forces to aerosol particles, but they differed in their approach to creating the aerosol from the powder. As the aerosolization mechanisms and the energy levels associated with them are different (Ding et al. Citation2015), the two systems generate aerosol particles in distinct size distributions as well as number concentrations. These different profiles of aerosol may lead to varied results even under the same testing conditions. Detailed schematic diagrams of the two systems are available in the supplemental information (SI, Figure S1).
The funnel-based aerosol generator (Ding and Riediker Citation2015) uses the concept of a fluidized-bed system. A steady airflow passes through the bottom opening of a funnel filled with dry powder and thereby continuously activates it. Aerosol generation can be maintained for long periods (>30 min) at stable particle number concentrations and size distributions. The dry aerosol flow (∼2% RH) enters a mixing chamber and is brought to its target humidity by mixing it with humid air (RH > 90%). The humid aerosol then passes through a critical orifice (400 µm in diameter) into a larger volume collection chamber from which several sampling lines collect particles for characterization. The devices used to characterize the aerosol in this study included a scanning mobility particle sizer (SMPS; GRIMM, Germany; particle number size distribution (PSD) and total count in the 11.1–1083.3 nm range), an optical particle counter (GRIMM, Germany; number size distribution and counts in the 0.25–32 µm range), and a MPS that collects airborne particles by impaction directly onto transmission electron microscopy grids (200 mesh, copper, Formvar/Carbon).
The second system is based on aerosolization using a magnetic stirrer in a pressurized beaker (Stahlmecke et al. Citation2009). The aerosol generated is mixed with humidity controlled air and then introduced into a cyclone to remove particles bigger than approximately 1.5 µm. The aerosol then passes through a circular opening of 508 µm in diameter into a homogenization chamber and is subsequently measured by online and offline equipment. Make-up air is added to the sampling flow to satisfy the total flow rate needed for characterizations. An SMPS (TSI, Model 3936; 34–1000 nm, electrical mobility) and a Palas WELAS aerosol spectrometer (Model 2100; 0.4–17 µm optical diameter) were used to measure particle number and size distributions. The airborne particles were collected on flat, single-crystalline, silicon substrates with an area of 1 × 1 cm, using a Nano Aerosol Sampler (TSI, Model 3089) with a laboratory-made unipolar charger unit in the aerosol sampling line. Samples obtained at the different conditions tested were subsequently analyzed using a high-resolution scanning electron microscope (JEOL, model 7500F, Japan).
The test conditions included 0–150 kPa in 50 kPa increments for the pressure drop and 0–75% in 20% or 25% increments for the RH. The 0-kPa pressure drop represents the reference condition under atmospheric pressure, where the critical orifices were not used. One test was conducted under each condition. The reproducibility of these two systems to investigate aerosolization and deagglomeration was tested previously (Stahlmecke et al. Citation2009; Ding and Riediker Citation2015; Ding et al. Citation2015). The levels of RH (±5%) and the pressure drops (±2%) were well maintained throughout the experiments. The pressure-drop level is proportional to the total volume of airflow passing the critical orifice. During the test, the aerosolization flow was kept constant in order to avoid changes in the aerosol profiles due to different powder activation levels. Modifying the total flow was done uniquely by tuning the dilution flow rate. The aerosol particles were accelerated in the orifice, and the total volumetric flow rate determined the air speed (and thus particle velocity). Air velocity increases with flow rate until a critical condition (in the choked orifice) is reached when the upstream pressure is approximately twice the downstream pressure. In the present study, critical conditions are reached at approximately 100-kPa pressure drop (since the downstream atmosphere was at ambient pressure). The particles experience shear stress in the orifice due to acceleration and subsequent drag force when ejected from the orifice. These flow conditions create high turbulences, which are viewed as mainly responsible for deagglomeration. The drag force is proportional to the relative velocity between the particle and the medium, and to the particle's diameter (Hinds Citation1982). Thus, larger pressure drops apply higher energies to the particles, potentially leading to more significant deagglomeration.
2.3. Data analysis
PSDs, geometric mean sizes (measured directly by the instruments taking into account the particle numbers in the entire size ranges covered), and the total number of particles measured using different pressure drop and humidity conditions were compared in order to demonstrate the influence of these two parameters. The size spectra were normalized with respect to total particle number concentrations to facilitate the assessment of PSD differences or similarities. Furthermore, particle fractions in three size ranges (10/34–100, 100–350, and 350–1000 nm) were compared with regard to the different conditions. Particle number concentrations in individual size channels were summed into the three respective size ranges, and divided by the total particle number. The <100 nm fraction represents nanoscale particles. The 100–350 nm range represents particles including agglomerates which are outside the nanoscale but exhibit aerodynamic behavior that is still significantly influenced by Brownian motion. The particle fraction >350 nm is dominated mostly by inertia.
Statistical analyses were performed—whenever sufficient numbers of experimental replicates were available—on particle numbers and mean sizes obtained at different pressure drop and humidity conditions. Spearman's rank correlation (coefficient rs) was used to analyze the correlations of the mean particle size to the two test parameters, using Stata (Stata CorpLP, TX, USA). A p value below 0.05 was considered significant. In addition, a regression analysis was performed on the changes in particle numbers in the individual size channels subject to the various humidity and pressure drop conditions.
3. Results
3.1. Comparison of systems and powders under standard test conditions (no critical orifice)
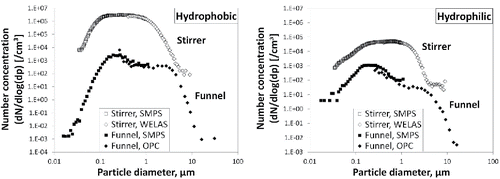
A comparison of the particle size distributions of aerosols generated using the two test setups under standard conditions (without critical orifices, 0% RH) is shown in . In general, the size spectra from the stirrer system were broader than those of the funnel system with generally elevated numbers for particles above 100 nm. The total particle number was up to three orders of magnitude higher for the stirrer system compared to the funnel. The hydrophobic powder generated higher aerosol concentrations than the hydrophilic powder, and also had a smaller mode diameter. The data measured using the SMPS and optical counters were generally consistent with one another (as demonstrated by the smooth transition between the curves).
Figure 2. Particle number size distributions of the aerosols generated using two types of nanopowder: left, hydrophobic TiO2; right, hydrophilic TiO2 (no critical orifice, RH = 0%).
3.2. Influence of a pressure drop and humidity on particle size and number concentration
The changes in mean diameter and total particle concentration under varied pressure drop and humidity conditions are shown in . Pressure drop affected both materials. In general, particle sizes decreased as the pressure drop increased, but the number concentration was less consistently associated with pressure drop. The particle number concentration was much higher—up to 15-fold—in almost all the experiments in comparison to the standard test conditions (), with larger variations when using the stirrer system. Note that the mean particle diameters obtained from the two systems are not directly comparable, as the lower and upper limits of their size spectra were slightly different. Elevated humidity increased mean particle diameter and greatly decreased particle number. Humid conditions had more influence on hydrophilic aerosol particles than for their hydrophobic counterparts (). It was notable that at atmospheric pressure the level of RH did not significantly modify the particle size of the hydrophobic aerosols created using the funnel system (). The size changes exhibited in the funnel system were not as obvious as those in the stirrer system; thus, statistical analyses were performed for the data in . All the correlations of the size change to the two variables were statistically significant, except for one condition (hydrophobic TiO2 in the funnel at 0 kPa, ). The complete set of results is available in the SI (Table S1).
Figure 3. Effects of a pressure drop and relative humidity on the mean particle diameter and total number concentration of hydrophobic (NM-103) and hydrophilic (NM-104) TiO2 aerosols. Total particle number concentrations are shown using relative scales, compared to the standard test conditions (0% RH and 0 kPa).
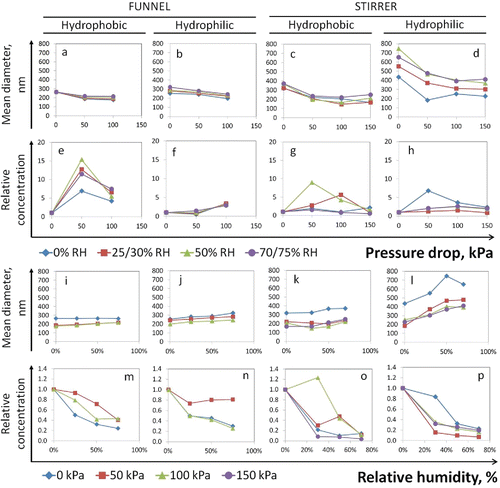
When RH was increased, the effect of pressure drop on aerosol properties was changed (). For hydrophobic particles, the effects of humidity and pressure were more evident than for hydrophilic particles (see also Figures S2a–h). For the hydrophobic aerosols, the decrease in particle size by the pressure drop became smaller at higher RH (Figure S2a). For the hydrophilic aerosols, the reduction in particle size after the pressure drop seemed to be independent of humidity (Figure S2b). The stirrer system induced more significant reductions in particle size than the funnel system (Figures S2c and d). For the hydrophobic aerosols in the funnel system, humidity had no effects on mean particle size until the pressure drops were applied (Figure S2e). The overall humidity effects became stronger as the pressure drop was increased. For the hydrophilic aerosol, the effects of humidity remained similar across the different pressure drops (Figure S2f). In the stirrer system, the hydrophilic particles experienced significantly larger changes in mean particle size due to humidity than the hydrophobic particles (Figures S2g and h). A more detailed analysis, also using the values within the above ranges (such as a 0–50 kPa pressure drop, or a change in RH from 50% to 75%), is available in Figure S3 (SI).
Quantitative comparisons of particle number fraction in different size ranges are presented in . The particle number fraction below 100 nm increased significantly with the pressure drop but decreased with the RH (graphs a–d, red dashed lines). In contrast, the particle number fraction in the > 350 nm size range responded inversely to the increased pressure drop and RH (graphs i–l, red dashed lines). The particle fractions between these two size ranges registered minor increases with greater pressure drops and decreases with increasing RH (graphs e–h). It is noteworthy that pressure-induced increases in <100 nm particles were more significant at lower RHs, such as 0% or 30%. In , the tilted surface indicates decreased pressure effect under increased RH, as well as enhanced RH effect under increased pressure drop. Comparing the two materials, hydrophobic aerosols consisted of up to 40% nanoscale particles (<100 nm) (graphs a and c), whereas their hydrophilic counterparts had only 10%–25% in this range (graphs b and d). In comparison, the hydrophilic aerosols had much higher fractions in the >350 nm range (maximum 80%). In general, the stirrer system generated higher fractions for large particles and lower for nanoparticles than the funnel did. This may be the main reason for the different responses to the test variables. These results were in line with the observations on the changes in the mean particle size.
Figure 4. Effects of pressure drops on particle number fractions in three different size ranges (<100 nm, 100–350 nm, and >350 nm) for hydrophobic (NM-103) and hydrophilic (NM-104) TiO2 aerosols.
Particles with different size profiles may respond differently to changes in RH. The influences of a pressure drop and RH on particle numbers in each of the size channels were analyzed using regression analysis. This showed which size ranges were the most sensitive to the two variables. The results presented in are for hydrophobic particles at 100-kPa pressure drop and 0% RH. As humidity increased, the biggest reduction in particle numbers (the relative change with respect to the total) was in the <100 nm range, peaking around 40–80 nm (, left). The responses decreased for larger particles. For the effect of a 0–100 kPa pressure drop, particle numbers in the size range below 270 nm increased (positive values), while particle numbers above this size decreased (negative values) (). The numbers of particles below 100 nm and those near 1 µm size were affected the most. Moreover, when subjected to a pressure drop, the most sensitive particle size became larger as humidity grew (Figure S4, see the SI). The results suggested that more humid conditions tended to reduce the number of nanoscale hydrophobic particles, whereas humidity's effect was less significant on larger particles. The pressure drop seemed to facilitate the generation of particles around or below 100 nm. However, the moisture content somehow prevented this process by strengthening interparticulate forces, as discussed previously, even for these hydrophobic particles.
Figure 5. Changes in particle numbers (%) in individual size channels (measured by SMPS) by increasing 1% relative humidity (left) and by increasing 1 kPa pressure drop (right). The relative changes (%) were obtained by dividing absolute changes by total particle numbers in each size channel. Particle size distributions at 0% RH/100 kPa (open circles) are also presented for the purpose of comparison. Only statistically significant values are plotted (p < 0.05). Error bars represent 95% confidence intervals. Data are from the funnel system using hydrophobic TiO2.
3.3. Morphological analysis of airborne particle samples
The modifications of particle morphology at varied humidity and pressure drop conditions were analyzed using a scanning electronic microscope (JEOL 7500F). shows the SEM images of collected NM-103 airborne samples generated using different test parameters with the stirrer system. Particle sizes seemed to be smaller when they were treated using a larger pressure drop, whether humidity was low or high (, comparing a to b and c to d). In contrast, higher humidity seemed to result in larger particle sizes at atmospheric pressure (, comparing a to c). Very large agglomerates and chain-like structures were sometimes observed when no pressure drop was applied (), whereas the highest pressure drop mostly resulted in spherical particles (). The microscopy observations on the effects of the two variables were generally in line with the online measurement results.
Figure 6. Scanning electron microscopy images to show particle morphology (NM-103).
4. Discussion
The increased particle number concentration and decreased mean size, in addition to the changes in the fractions of large and nanoscale particles, suggest that the rapid transfer through the orifice induced by the pressure drop caused a significant deagglomeration process by the present external forces. When no orifice was used, powder particles were only deagglomerated during aerosolization, and aerosolized particles were carried along in laminar flows into the measurement chamber without a further deagglomeration. This process resulted in relatively large particle sizes and low number concentrations, as seen under 0-kPa pressure drop condition. When the orifice was installed and initial pressure drops applied, additional shear forces and flow turbulences were added both in and after the orifice, causing further particle deagglomeration that reduced their sizes and increased total number. When the shear force was increased by a higher-pressure drop, more deagglomeration events occurred, which led to a further size reduction and increase in number. When the pressure drop reached the critical condition (which is approximately 100 kPa in our case), the flow velocity through the orifice does not increase anymore, but only the flow-particle interaction level goes up due to a higher upstream pressure. This may be responsible for the decreased effects of the pressure drop observed at 150 kPa. The results are consistent with the findings from previous studies using critical orifices to break nanoparticle agglomerates. Ding and Riediker tested pressure drops of up to 300 kPa with six different types of materials and found that deagglomeration mostly occurred below 100 kPa (Ding and Riediker Citation2015). Significant deagglomeration already took place when there were minor increases in the upstream pressure (as low as 20 kPa) and the number concentration as a function of applied pressure suggested that deagglomeration had a nonlinear dependency on the applied pressure. This behavior was also seen for the hydrophobic aerosols in our study (, reduced effect from 0–50 to 50–100 kPa). Stahlmecke et al. (Stahlmecke et al. Citation2009) also observed significant correlations between a pressure drop (up to 140 kPa) and the mean particle sizes in nanoaerosols. Sosnowski et al. demonstrated the deagglomeration of microsized pharmaceutical powder particles using a converging nozzle (Sosnowski et al. Citation2014). However, all these studies were conducted in relatively dry environments (RH < 15%).
Deagglomeration can occur when the dispersion force is comparable to the interparticle binding force. In a simulation study, researchers found that nanoparticle agglomerates started to deform even when the dispersion force under shear flow reached 0.1% of the interparticle force (Nishiyama et al. Citation2013). Calculation of the shear stress in the orifice requires sophisticated computational tools, which was beyond the scope of this study. However, it is possible to estimate the air drag force after the orifice. It is calculated using the following equation (Hinds Citation1982):[1] where: η, air viscosity; v, relative velocity; D, particle diameter; C, slip correction factor; assuming a dynamic shape factor of 1.
In the present study, the flow speed through the critical orifice was approx. 173 m/s at 50-kPa pressure. This leads to a maximal drag force range of 1–25 nN for 0.1–1 µm particles (the actual drag force can be lower depending on flow conditions).
For the inter-particulate forces, the common mechanisms were van der Waals (VDW) force and capillary force. The VDW interaction is normally much less significant than the capillary attraction and would be partly screened if moisture content is present (Pakarinen et al. Citation2005). The exact range of capillary forces in our study would be complex to calculate because of the many undefined parameters. However, for an approximation one could refer to the values given in other studies for similar conditions, such as: 10–30 nN for 30 nm spheres at a 0° contact angle; 90–180 nN between a nanoscopic atomic force microscopy tip and a silicon wafer (Butt and Kappl Citation2009); and 0–80 nN between a 100 nm spherical particle and a flat surface at 0%–100% RH (Pakarinen et al. Citation2005).
As a result, the drag force alone can act as a dispersion force that is comparable with estimated capillary interaction. This suggests that with the energy input range applied in our experiments, deagglomeration could not only take place with dry particles, but also under humid conditions. This would support our finding that although humidity helped to facilitate agglomerate stability, the pressure drop still played a discernible role in reducing the mean particle size at high RH. Moreover, the drag force is proportional to the particle diameter, and this may explain its more significant effects on the aerosols with a larger mean particle size, such as those generated from the hydrophilic TiO2 powder (NM-104) and from the stirrer system. Also, a low-pressure drop might still be able to exert significant effects if the particle size is sufficiently large.
RH showed an opposite effect in preventing particle deagglomeration. This suggests that the moisture content promoted agglomerate stability. Two mechanisms can be considered in this process. Firstly, the particles absorb more water molecules on their surfaces as humidity increases, and upon subsequent collision, they are bond by the adhesion force created from the moisture content, creating new agglomerates. Secondly, moisture condenses directly in the capillaries inside the particles (capillary condensation), thus strengthening the original agglomerate. Thus, high levels of RH may explain the continuous increase in particle size, the reduction in particle numbers, and the less-significant effects of the pressure drop. The hydrophilic TiO2 surfaces facilitate faster water absorption because of their smaller contact angles at the particle-liquid interface, resulting in an increase of capillary force; this may be responsible for the different responses that the two tested materials exhibit to humidity changes. At high RH, even when exposed to the largest pressure drop, the hydrophilic aerosol particles still retained much larger sizes than their hydrophobic counterparts. Capillary force has been shown to vary with RH. It can exhibit monotonic increase or decrease, peak at certain RHs, show step-wise increases, or be independent of RH; the variations depend on particle properties such diameter, shape, surface hydrophilicity, and roughness (Butt and Kappl Citation2009; Harrison et al. Citation2015).
The two systems featured different aerosolization mechanisms, different quantities of raw materials (250 mg for the funnel vs. 5–8 g for the stirrer) and different airflow rates, and these may be responsible for the variety of PSD profiles created. Different means of aerosolization have been shown to result in distinct aerosol properties (Bach and Schmidt Citation2008), which may in turn influence the deagglomeration behaviors exhibited by the aerosol particles when subject them to additional shear forces.
Different responses from the aerosol particles created by the two systems to the test parameters were observed, although the general patterns were consistent. The more significant changes in particle size and in number concentration seen with the stirrer system may be caused by the originally larger sizes and higher numbers created compared to the funnel system. Larger particle sizes induce higher drag forces from the surrounding air onto the particles, leading to higher degrees of deagglomeration thus larger size reductions. This aspect is also discussed in a previously published article comparing four different aerosolization systems (Ding et al. Citation2015). On the other hand, higher number concentrations created may facilitate particle agglomeration in the air upon collision by surface moisture under elevated RH, which explains the more dramatic increases in particle size and decreases in number seen with the stirrer system.
The enhanced effects of humidity under higher turbulence level may be due to more collision events, which may promote agglomeration by moisture (even though the water absorption may be weak depending on how hygroscopic the surface is). Another possible explanation is that the smaller particles generated under higher pressure drops were more sensitive to changes in RH (Pakarinen et al. Citation2005). For hydrophilic particles, agglomerate stabilization by capillary force may already have taken place due to the moisture content in the raw powders (resulting in different aerosol properties for both materials, even when tested in a completely dry environment, as shown in ). This could explain their weaker responses to the increasing humidity when subjected to a pressure drop (Figure S2b).
Comparing to the significant changes in particle size, the less correlated particle number concentration could be due to different powder pretreatments, such as powder storage (Levin et al. Citation2015) or filling the powders into the aerosolizers. The absolute particle numbers generated in these two systems varied several fold but usually stayed well within the same order of magnitude. Thus, most of the changes seen in the present study were attributable to the modifications of pressure and RH.
5. Conclusions
In this study, we observed significant effects of the applied external forces and RH on the properties of aerosol particles. The applied forces decreased mean particle sizes and increased total particle numbers. Elevating RH led to less decreased mean particle sizes and less increased total particle numbers. The influence of RH on the hydrophilic TiO2 aerosols (NM-104) was very evident in both test setups. In contrast, the two systems differed when testing the hydrophobic TiO2 aerosols (NM-103): the effects were prominent in the funnel system (though weaker for NM-104), whereas they were less clear in the stirrer system. This might be due to the different particle size spectra generated by the two systems (normally a smaller mode diameter is observed for the funnel system). Humid conditions may affect small particles more than big particles. For particle number counts, the effects of a pressure drop and humidity together were not very clear—this could be attributed to the intertest variability of absolute particle number concentrations in the aerosolization tests (which were up to an order of magnitude). The increased number and decreased size of the particles was suggestive of improved agglomerate stability under humid conditions and deagglomeration under external energy inputs. The external forces induced by a pressure drop across the critical orifices were responsible for particle deagglomeration. The bridging effect of absorbed surface water content and the resulting capillary forces somehow prevented deagglomeration. Mean particle size was larger by increasing humidity, for both the materials tested, which indicates that deagglomeration levels were lower despite the pressure drops. However, the applied external forces played a role in how aerosols responded to humidity changes, possibly because they modified the particle size profiles.
The presented results suggest that aerosol properties, including particle size and surface hydrophilicity, play significant roles in the potential for particle deagglomeration under varied RH. In situations of occupational exposure, it is possible that aerosolized nanopowder particles could be further deagglomerated when energy inputs reach a certain level. Particle deagglomeration started to take place at low shear force levels that might occur during common nanomaterial handling activities in occupational settings.
UAST_1216072_Supplemental_File.zip
Download Zip (1.1 MB)Acknowledgments
The authors gratefully thank Dr. Guillaume Suarez (IST) and Mr. Gregory Plateel (IST) for their excellent support in the laboratory. The authors also wish to thank Dr. Pascal Wild for his assistance with the statistical analysis.
Funding
The research leading to these results has received funding from the European Research Council under the European Union's Seventh Framework Programme (FP/2007-2013)/ERC Grant Agreement n. 263215.
Related Research Data
References
- Bach, S., and Schmidt, E. (2008). Determining the Dustiness of Powders—A Comparison of Three Measuring Devices. Ann. Occup. Hyg., 52(8):717–725.
- Bérard, V., Lesniewska, E., Andrès, C., Pertuy, D., Laroche, C., and Pourcelot, Y. (2002). Dry Powder Inhaler: Influence of Humidity on Topology and Adhesion Studied by AFM. Int. J. Pharm., 232(1–2):213–224.
- Brouwer, D. (2010). Exposure to Manufactured Nanoparticles in Different Workplaces. Toxicology, 269(2–3):120–127.
- Butt, H.-J., and Kappl, M. (2009). Normal Capillary Forces. Adv. Colloid Interface Sci., 146(1–2):48–60.
- Calvert, G., Ghadiri, M., and Tweedie, R. (2009). Aerodynamic Dispersion of Cohesive Powders: A Review of Understanding and Technology. Adv. Powder Technol., 20(1):4–16.
- Castranova, V. (2011). Overview of Current Toxicological Knowledge of Engineered Nanoparticles. J. Occup. Environ. Med., 53(6 Suppl):S14–17.
- Cho, W. S., Duffin, R., Thielbeer, F., Bradley, M., Megson, I. L., Macnee, W., Poland, C. A., Tran, C. L., and Donaldson, K. (2012). Zeta Potential and Solubility to Toxic Ions as Mechanisms of Lung Inflammation Caused by Metal/Metal Oxide Nanoparticles. Toxicol. Sci., 126(2):469–477.
- Ding, Y., and Riediker, M. (2015). A System to Assess the Stability of Airborne Nanoparticle Agglomerates Under Aerodynamic Shear. J. Aerosol Sci., 88(0):98–108.
- Ding, Y., Stahlmecke, B., Jiménez, A. S., Tuinman, I. L., Kaminski, H., Kuhlbusch, T. A. J., van Tongeren, M., and Riediker, M. (2015). Dustiness and Deagglomeration Testing: Interlaboratory Comparison of Systems for Nanoparticle Powders. Aerosol Sci. Technol., 49(12):1222–1231.
- Fonda, M., Petach, M., Rogers, C. F., Huntington, J., Stratton, D., Nishioka, K., and Tipo, M. (1999). Resuspension of Particles by Aerodynamic Deagglomeration. Aerosol Sci. Technol., 30(6):509–529.
- Froeschke, S., Kohler, S., Weber, A. P., and Kasper, G. (2003). Impact Fragmentation of Nanoparticle Agglomerates. J. Aerosol Sci., 34(3):275–287.
- Fukui, H., Horie, M., Endoh, S., Kato, H., Fujita, K., Nishio, K., Komaba, L.K., Maru, J., Miyauhi, A., Nakamura, A., Kinugasa, S., Yoshida, Y., Hagihara, Y., and Iwahashi, H. (2012). Association of Zinc Ion Release and Oxidative Stress Induced by Intratracheal Instillation of ZnO Nanoparticles to Rat Lung. Chemico-Biol. Interact., 198(1–3):29–37.
- Harrison, A. J., Corti, D. S., and Beaudoin, S. P. (2015). Capillary Forces in Nanoparticle Adhesion: A Review of AFM Methods. Part. Sci. Technol., 1–13.
- Henry, F., Bouillard, J., Marchal, P., Vignes, A., Dufaud, O., and Perrin, L. (2013). Exploring a New Method to Study the Agglomeration of Powders: Application to Nanopowders. Powder Technol., 250(0):13–20.
- Hinds, W. (1982). Aerosol Technology - Properties, Behaviour, and Measurement of Airborne Particles (2nd ed.). John Wiley & Sons, New York.
- Ihalainen, M., Lind, T., Arffman, A., Torvela, T., and Jokiniemi, J. (2013). Break-Up and Bounce of TiO2 Agglomerates by Impaction. Aerosol Sci. Technol., 48(1):31–41.
- Ihalainen, M., Lind, T., Torvela, T., Lehtinen, K. E. J., and Jokiniemi, J. (2012). A Method to Study Agglomerate Breakup and Bounce During Impaction. Aerosol Sci. Technol., 46(9):990–1001.
- Kousaka, Y., Okuyama, K., Shimizu, A., and Yoshida, T. (1979). Dispersion Mechanism of Aggregate Particles in Air. J. Chem. Eng. Jpn, 12(2):152–159.
- Kreyling, W., Semmler-Behnke, M., Seitz, J., Scymczak, W., Wenk, A., Mayer, P., Takenaka, S., and Oberdorster, G. (2009). Size and Material Dependency of Translocation of Inhaled Iridium or Carbon Nanoparticles from the Lungs of Rats to Blood. Inhal. Toxicol., 21(S1):55–60.
- Kuhlbusch, T., Asbach, C., Fissan, H., Gohler, D., and Stintz, M. (2011). Nanoparticle Exposure at Nanotechnology Workplaces: A Review. Part. Fibre Toxicol., 8(1):22.
- Levin, M., Rojas, E., Vanhala, E., Vippola, M., Liguori, B., Kling, K., Koponen, I. K., Mølhave, K., Tuomi, T., Gregurec, D., Moya, S., and Jensen, K. (2015). Influence of Relative Humidity and Physical Load During Storage on Dustiness of Inorganic Nanomaterials: Implications for Testing and Risk Assessment. J. Nanopart. Res., 17(8):1–13.
- Li, W.-I., and Edwards, D. A. (1997). Aerosol Particle Transport and Deaggregation Phenomena in the Mouth and Throat. Adv. Drug Del. Rev., 26(1):41–49.
- Li, W.-I., Perzl, M., Heyder, J., Langer, R., Brain, J. D., Englmeier, K. H., Niven, R. W., and Edwards, D. A. (1996). Aerodynamics and Aerosol Particle Deaggregation Phenomena in Model Oral-Pharyngeal Cavities. J. Aerosol Sci., 27(8):1269–1286.
- Nishiyama, T., Inamuro, T., and Yasuda, S. (2013). Numerical Simulation of the Dispersion of Aggregated Brownian Particles Under Shear Flows. Comput. Fluids, 86(0):395–404.
- Oberdorster, G., Oberdorster, E., and Oberdorster, J. (2005). Nanotoxicology: An Emerging Discipline Evolving from Studies of Ultrafine Particles. Environ Health Perspect, 113(7):823–839.
- Pakarinen, O. H., Foster, A. S., Paajanen, M., Kalinainen, T., Katainen, J., Makkonen, I., and Nieminen, R. M. (2005). Towards an Accurate Description of the Capillary Force in Nanoparticle-Surface Interactions. Model. Simul. Mater. Sci. Eng., 13(7):1175.
- Parveen, F., Berruti, F., Briens, C., and McMillan, J. (2013). Effect of Fluidized Bed Particle Properties and Agglomerate Shape on the Stability of Agglomerates in a Fluidized Bed. Powder Technol., 237(0):46–52.
- Petitot, F., Lestaevel, P., Tourlonias, E., Mazzucco, C., Jacquinot, S., Dhieux, B., Delissen, O., Tournier, B. B., Gensdarmes, F., Beaunier, P., and Dublineau, I. (2013). Inhalation of Uranium Nanoparticles: Respiratory Tract Deposition and Translocation to Secondary Target Organs in Rats. Toxicol. Lett., 217(3):217–225.
- Pirela, S. V., Miousse, I. R., Lu, X., Castranova, V., Thomas, T., Qian, Y., Bello, D., Kobzik, L., Koturbash, I., and Demokritou, P. (2016). Effects of Laser Printer-Emitted Engineered Nanoparticles on Cytotoxicity, Chemokine Expression, Reactive Oxygen Species, DNA Methylation, and DNA Damage: A Comprehensive in Vitro Analysis in Human Small Airway Epithelial Cells, Macrophages, and Lymphoblasts. Environ. Health Perspect.,124(2):210–219.
- Price, R., Young, P. M., Edge, S., and Staniforth, J. N. (2002). The Influence of Relative Humidity on Particulate Interactions in Carrier-Based Dry Powder Inhaler Formulations. Int. J. Pharm., 246(1–2):47–59.
- Rasmussen, K., Mast, J., De Temmerman, P.-J., Verleysen, E., Waegeneers, N., Van Steen, F., Pizzolon, J. C., De Temmerman, L., Van Doren, E., Jensen, K. A., Birkedal, R., Levin, M., Nielsen, S. H., Koponen, I. K., Clausen, P. A., Kofoed-Sørensen, V., Kembouche, Y., Thieriet, N., Spalla, O., Giuot, C., Rousset, D., Witschger, O., Bau, S., Bianchi, B., Motzkus, C., Shivachev, B., Dimowa, L., Nikolova, R., Nihtianova, D., Tarassov, M., Petrov, O., Bakardjieva, S., Gilliland, D., Pianella, F., Ceccone, G., Spampinato, V., Cotogno, G., Gibson, P., Gaillard, C., and Mech, A. (2014). Titanium Dioxide, NM-100, NM-101, NM-102, NM-103, NM-104, NM-105: Characterisation and Physico-Chemical Properties. JRC Science and Policy Report, Luxembourg: Publications Office of the European Union, ISBN: 978-92-79-38188-1. DOI: 10.2788/79554.
- Schaeublin, N. M., Braydich-Stolle, L. K., Schrand, A. M., Miller, J. M., Hutchison, J., Schlager, J. J., and Hussain, S. M. (2011). Surface Charge of Gold Nanoparticles Mediates Mechanism of Toxicity. Nanoscale, 3(2):410–420.
- Schmid, K., Danuser, B., and Riediker, M. (2010). Nanoparticle Usage and Protection Measures in the Manufacturing Industry–A Representative Survey. J. Occup. Environ. Hyg., 7(4):224–232.
- Schneider, T., and Jensen, K. A. (2009). Relevance of Aerosol Dynamics and Dustiness for Personal Exposure to Manufactured Nanoparticles. J. Nanopart. Res., 11(7):1637–1650.
- Sosnowski, T. R., Giżyńska, K., and Żywczyk, Ł. (2014). Fluidization and Break-up of Powder Particle Aggregates During Constant and Pulsating Flow in Converging Nozzles. Colloid. Surf. A: Physicochem. Eng. Aspects, 441(0):905–911.
- Stahlmecke, B., Wagener, S., Asbach, C., Kaminski, H., Fissan, H., and Kuhlbusch, T. (2009). Investigation of Airborne Nanopowder Agglomerate Stability in an Orifice Under Various Differential Pressure Conditions. J. Nanopart. Res., 11(7):1625–1635.
- van Ommen, J. R., Valverde, J., and Pfeffer, R. (2012). Fluidization of Nanopowders: A Review. J. Nanopart. Res., 14(3):1–29.
- Zhu, K., Tan, R. B. H., Kiong Ng, W., Shen, S., Zhou, Q., and Heng, P. W. S. (2008). Analysis of the Influence of Relative Humidity on the Moisture Sorption of Particles and the Aerosolization Process in a Dry Powder Inhaler. J. Aerosol Sci., 39(6):510–524.
- Xiong, S., Tang, Y., Ng, H. S., Zhao, X., Jiang, Z., Chen, Z., Ng, K. W., and Loo, S. C. J. (2013). Specific Surface Area of Titanium Dioxide (TiO2) Particles Influences Cyto- and Photo-Toxicity. Toxicology, 304(0):132–140.