
ABSTRACT
A sensitive, field-portable microplasma spectroscopy method has been developed for real-time measurement of carbon nanomaterials. The method involves microconcentration of aerosol on a microelectrode tip for subsequent analysis for atomic carbon using spark emission spectroscopy (SES). The spark-induced microplasma was characterized by measuring the excitation temperature (15,000–35,000 K), electron density (1.0 × 10¹⁷–2.2 × 1017 cm−3), and spectral responses as functions of time and interelectrode distance. The system was calibrated and detection limits were determined for total atomic carbon (TAC) using a carbon emission line at 247.856 nm (C I) for various carbonaceous materials including sucrose, EDTA, caffeine, sodium carbonate, carbon black, and carbon nanotubes. The limit of detection for total atomic carbon was 1.61 ng, equivalent to 238 ng m−3 when sampling at 1.5 L min−1 for 5 min. To improve the selectivity for carbon nanomaterials, which mainly consist of elemental carbon (EC), the cathode was heated to 300°C to reduce the contribution of organic carbon to the total atomic carbon. Measurements of carbon nanotube aerosol at elevated electrode temperature showed improved selectivity to elemental carbon and compared well with the measurements from the thermal optical method (NIOSH Method 5040). The study shows the SES method to be an excellent candidate for development of low-cost, hand-portable, real-time instrument for measurement of carbonaceous aerosols and nanomaterials.
EDITOR:
1. Introduction
Carbon nanomaterials, such as carbon nanotubes (CNT) and carbon nanofibers (CNF) have promising technological applications. However, the increasing production and widespread application of nanomaterials could have adverse health effects on workers who are routinely exposed to these materials (NIOSH Citation2013). Measurement of airborne nanomaterial concentration and composition is of great significance for the prevention of exposure and protection of workers' health. Most existing methods for measurement of carbonaceous particles involve filter collection over several hours, followed by off-line analysis (Chow et al. Citation1993; Birch and Cary Citation1996). Although filter-based methods are in common use for routine monitoring in both occupational and environmental settings, they have several drawbacks. In particular, they are time-integrated methods that are labor and time-intensive, with typical analysis turnaround times of several days to weeks. Field-portable, near real-time instruments can meaningfully augment filter-based methods to provide more timely as well as accurate characterization of aerosols to which workers may be exposed.
There are several real-time atomic and molecular spectrometric methods for carbonaceous aerosol analysis. Mass spectrometry-based, real-time instruments have been widely used for both elemental and molecular analyses in atmospheric chemistry studies (Gross et al. Citation2006; DeCarlo et al. Citation2006), but they have not been practical for workplace aerosol measurements due to their high cost and lack of portability. Optical spectroscopies, particularly microplasma-based emission spectroscopies, are attractive alternatives for elemental speciation measurements (Broekaert Citation2002). These techniques involve identifying and quantifying elements based on their characteristic atomic emission, which occurs at particular wavelengths when the sample is placed in a high-temperature excitation medium such as a flame, plasma, arc, or spark (You et al. Citation1996; Martin et al. Citation1999; Hunter et al. Citation2000; Broekaert Citation2002; Diwakar and Kulkarni Citation2012). These plasma spectroscopy techniques have been applied to measure the carbon content of some solid samples, such as soil, coal, and fly ash (Glumac et al. Citation2010; Dong et al. Citation2012; Yao et al. Citation2012). Vors and Salmon (Citation2006) reported a limit of detection (LOD) of 60 µg m−3 of carbon using test aerosols of glucose and NaHCO3 for their laboratory benchtop laser-induced breakdown spectroscopy (LIBS) system. Lee and Yoh (Citation2012) reported an LOD of 150.4 µg m−3 at a low flow rate and 240.4 µg m−3 at a high sample flow rate in their LIBS system. They used 15 µm test particles and analyzed them in situ in the aerosol stream flowing past the LIBS microplasma. Though these and other studies have successfully measured airborne carbon, the detection limits achieved were not adequate for practical aerosol measurement applications, especially for workplace monitoring of CNT aerosol. NIOSH has proposed a recommended exposure limit (REL) for CNT/CNF of 1 µg m−3, as a respirable elemental carbon (EC), 8-h time weighted average (NIOSH Citation2013). Sensitive near real-time techniques that can provide accurate measurements with much lower detection limits are needed. The objective of this study was to investigate the effectiveness of LIBS and spark emission spectroscopy (SES) for near real-time measurement of carbonaceous aerosol using preconcentration techniques developed earlier (Diwakar et al. Citation2012; Diwakar and Kulkarni Citation2012).
Current methods for measurement of carbonaceous aerosols typically measure total carbon (using various techniques) and attempt to distinguish between EC and organic carbon (OC) by heating a filter sample in inert and oxidizing atmospheres (Birch and Cary Citation1996; Birch Citation1998). The thermal-optical analyzer on which Method 5040 is based has been successfully applied to workplace monitoring of diesel particulate matter (Birch and Cary Citation1996) and carbon nanomaterials (Birch et al. Citation2011; Dahm et al. Citation2012; NIOSH Citation2013). The semi-continuous OC-EC analyzer (Sunset Laboratory Inc., Tigard, OR) is widely used to measure time-resolved particulate organic and elemental carbon concentrations in ambient air quality studies (Polidori et al. Citation2006; Batmunkh et al. Citation2011). Normally, this semi-continuous instrument is operated with a 1–2 h sample collection period, depending on the EC concentration, followed by a 20 min sample analysis period (Bae et al. Citation2004).
In this article, we describe a near real-time, plasma-based method for analysis of submicrometer airborne carbonaceous particles. The method collects particles on an electrode tip using electrostatic principles (Diwakar et al. Citation2012; Diwakar and Kulkarni Citation2012), following which emission spectrometric analysis is conducted. Various carbonaceous materials including organic and inorganic carbon (carbonates and carbon allotropes) were used to calibrate the instrument and establish the LODs. LODs, uncertainty, accuracy, and applications to nanomaterial measurements in air are presented and discussed.
2. Experimental methods
2.1. Experimental setup
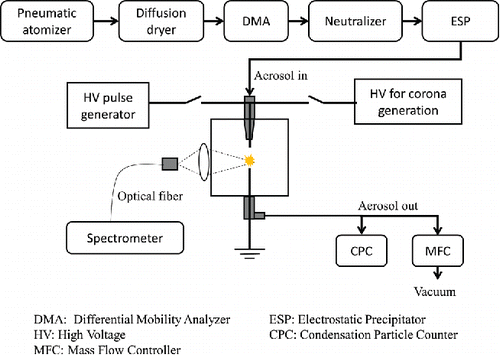
A schematic diagram of the experimental setup is shown in . The major components include: (i) an aerosol generation system, (ii) an aerosol collection system, and (iii) an SES system.
Figure 1. Schematic diagram of the experimental setup used in this work.
2.1.1. Aerosol generation
Test aerosols were generated using a pneumatic atomizer (model 3076, TSI Inc., Shoreview, MN, USA) to aerosolize solutions or suspensions prepared by mixing carbon-containing materials in ultra-filtered DI water (Fisher Scientific, Pittsburgh, PA, USA). The aerosol was passed through a diffusion dryer to remove associated water, and the resulting dry aerosol was passed through a differential mobility analyzer (DMA; model 3080, TSI Inc., Shoreview, MN, USA) to obtain a near-monodisperse test aerosol (with geometric standard deviation less than about 1.1 nm) in the size range of 10–300 nm. An uncharged and near-monodisperse test aerosol was then produced by passing the aerosol through a neutralizer (a Po-210 source) and an electrostatic precipitator (ESP). Typical number concentrations of the test aerosols generated in this study were in the range of 1×10³–2×104 cm−3, depending on the carbon materials and concentrations of the solutions or suspensions.
Various carbon materials are used for calibration in this study, including sucrose, EDTA, caffeine, sodium carbonate (Na2CO3), carbon black, and CNT. Detailed description of these materials is given in Table S1 in the online supplementary information (SI). Powder samples of 99.9% pure sucrose, EDTA, caffeine, and Na2CO3 (Fisher Chemical, Pittsburgh, PA; Sigma-Aldrich, St. Louis, MO, USA) were dissolved in ultra-filtered DI water to obtain solutions for aerosol generation. A carbon black suspension was prepared by adding carbon black (REGAL® 400R, Cabot Corporation, Billerica, MA, USA; >99% elemental carbon) to ultra-filtered DI water, and a CNT suspension was obtained by mixing hydrophilic single-walled carbon nanotubes (P7-SWNT, Carbon Solutions, Inc., Riverside, CA, USA) into ultra-filtered DI water. The P7-SWNT nanotubes are surface functionalized with polyethyleneglycol and possess carbonaceous purity greater than 90%.
A constant flow rate of 1.5 L min−1 was maintained through the aerosol collection system and was driven by the native pump in the condensation particle counter (CPC; model 3022A, TSI Inc.). The overall flow scheme was controlled using a mass flow controller (MFC; model 247 C, MKS Instruments, Inc., Andover, MA, USA).
2.1.2. Aerosol collection
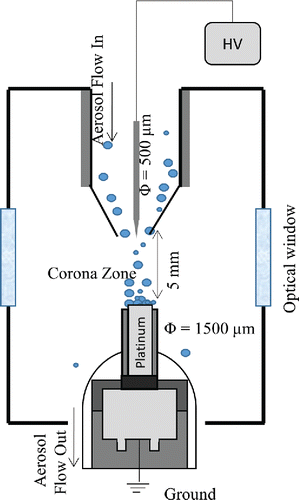
An electrostatic aerosol collection system designed in an earlier study (Diwakar and Kulkarni Citation2012) was used, with some modifications needed for monitoring atomic emission from carbon. As shown in , the system consisted of two coaxial electrodes with a separation distance of 5 mm. A high positive potential (∼5 kV) was applied on the corona electrode through a DC power supply (Bertran S-230, Spellman Corp., Hauppauge, NY, USA). The sidewalls of the electrodes were covered with a high dielectric strength sheath (polyether ether ketone [PEEK]; McMaster-Carr, Princeton, NJ, USA) to avoid particle deposition on the sidewalls. The corona electrode, made of tungsten, was 500 µm in diameter. The electrode has a sharp tip, with an approximate radius of 100 μm, and was used to create a corona around its tip. The ground electrode was 1500 µm in diameter and had a relatively flat tip to provide a planar surface for particle deposition. Platinum ground electrodes were used to minimize spectral interference in carbon detection at 247.856 nm. The ground electrode was attached to a miniature resistive heating element to allow heating of the ground electrode up to 300°C. The ground electrode used for particle deposition was also used as the cathode for producing spark discharge.
Figure 2. Schematic diagram of the aerosol preconcentration system (not to scale).
2.1.3. SES setup
In the SES system, a high voltage pulse generator (Cascodium Inc., Andover, MA, USA), was used to produce a spark microplasma in the interelectrode gap to ablate the particulate matter collected on the cathode. The pulse generator was designed for spark spectroscopy, with an output pulse energy up to 800 mJ. The size of the microplasma was measured to be about 500 µm in diameter. This diameter was measured by ablating a thin film of ink coated on the ground electrode surface and subsequently measuring the diameter of ablated spot using an optical microscope. The atomic emission signals from the microplasma were collected using a fiber optic cable connected to a broadband spectrometer with a wavelength range of 200–980 nm and a resolution of about 0.1 nm (LIBS2500 Plus, Ocean Optics Inc., Dunedin, FL, USA). Data acquisition and triggering of the spectrometers and laser and high voltage pulse generator were accomplished through OOILIBS software (Version 4.5.07, Ocean Optics Inc., Dunedin, FL, USA). A delay time of 5 µs was used in the SES system (Diwakar and Kulkarni Citation2012). A summary for the experimental parameters used in the SES systems is shown in Table S2a in the SI. To probe the evolution of the carbon plasma generated by spark discharge, the temporal profiles of the C I transition (2s22p2 1S to 2s22p3s 1P°) at 247.856 nm were recorded using an intensified charge coupled device (ICCD; iStar 334T, Andor Technology, South Windsor, CT, USA) at different distances from the collection electrode (cathode) surface and at different delay times.
2.2. Calibration method
Six different carbon materials were used to obtain calibration curves in this work: sucrose, EDTA, caffeine, sodium carbonate (Na2CO3), carbon black, and single-walled carbon nanotubes (SWCNT). A solution or suspension for each material was prepared for aerosol generation. The aerosol was collected on the platinum collection electrode (ground) for a predetermined time period ranging from a few seconds to a few minutes. The particle mass deposited on the electrode for a given particle diameter is given by (DeCarlo et al. Citation2004):[1] where
is the capture efficiency of particles,
is the particle concentration flowing into the chamber,
is the aerosol volumetric flow rate,
is the particle collection time,
is the particle material density,
is the volume equivalent diameter of particle,
is the electrical mobility diameter,
is slip correction factor for the volume equivalent diameter,
is slip correction factor for the electrical mobility diameter, and
is the dynamic shape factor (DSF) in the transition regime. DSF is defined as the ratio of the drag force on a nonspherical particle to the drag force on a spherical particle, which has the same volume equivalent diameter and travels at the same relative velocity (Kulkarni et al. Citation2011). The DSF is 1 for spherical particles. For nonspherical particles, DSF is greater than 1 and needs to be determined experimentally for each particle type. For particles with
> 100 nm and
< 2.3,
is less than 1.1. By assuming
= 1, Equation (Equation1
[1] ) can be simplified as follows:
[2]
Particle capture efficiency was calculated by measuring the particle number concentration downstream of the collection unit using a CPC, with and without the presence of the electric field across the electrodes ( and
):
[3]
Mass loading on the collection electrode was changed by varying the collection time or the particle concentration at the inlet. For a given aerosol generated, and for a given mass, three samples were collected over the same collection time. The final calibration curve was constructed by averaging over these three replicate measurements for each mass level.
The carbon material deposited on the electrode was then ablated by high voltage pulsed spark (in the SES setup). Usually, a single pulse was sufficient to ablate the entire particulate mass; higher loadings required an additional one or two pulses. The atomic emission from each ablation was collected using the spectrometer. The signal intensity was subsequently converted to a peak area, defined as the integrated atomic emission line intensity below the peak after subtracting the baseline area. The baseline spectrum was obtained using an identical measurement, except with the absence of analyte on the electrode. For those measurements that required multiple pulses, the total signal intensity was calculated as the sum of the carbon signal intensity from each pulse. The calibration curve was constructed by plotting signal intensity as a function of mass of atomic carbon in the particulate matter deposited on the collection electrode. The LOD was estimated using 3- criteria defined by the International Union of Pure and Applied Chemistry (IUPAC; Boumans Citation1994).
3. Results and discussions
3.1. Sensitivity of different carbon emission lines
shows the spectra obtained from spark discharge excitation of sucrose particles collected in the preconcentrator. Six carbon emission lines, including neutral emission line C I and ionic emission line C II, were identified using the National Institute of Standards and Technology (NIST) atomic spectra database.
Figure 3. Carbon emission lines identified in this work using spark emission spectroscopy. The spectra correspond to different particulate carbon mass loadings on the collection electrode.
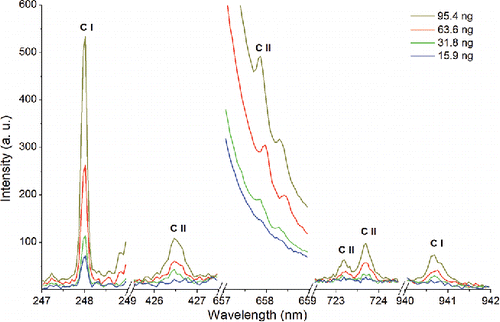
As shown in , atomic emission peaks for carbon appear at wavelengths of 247.856 nm, 426.726 nm, 657.805 nm, 723.132 nm, 723.642 nm, and 940.573 nm when analyzing sucrose by SES. For a given carbon mass loading, the strongest signal was observed at 247.856 nm. Comparing the four spectra obtained from sucrose particles at different carbon loadings (), we found that only the 247.856 nm emission line was detected at loadings below 15.9 ng. All carbon emission peaks appeared when the carbon loadings were above 31.8 ng. These measurements show that the sensitivity (S) for carbon measurement is different for different emission lines, with the 247.856 nm line exhibiting the highest sensitivity. This finding is consistent with other studies on emission lines for atomic carbon (Vors and Salmon Citation2006; Glumac et al. Citation2010; Bricklemyer et al. Citation2011; Dong et al. Citation2012). Figure S1 in the SI shows the intensity of all the carbon emission lines from sucrose plotted as a function of carbon mass. Based on the sucrose data, we assumed that sensitivity will be highest at 247.856 nm for the other carbonaceous aerosols, without consideration of effects of allotrope or molecular structure on carbon signal. Therefore, this emission line was used for all materials studied in this work.
3.2. Plasma characteristics
shows the contour map of the spatial and temporal variation of the carbon emission signal (the spatial resolution is 0.4 mm and time resolution is 1 µs). After initiation of the plasma, carbon emission only appeared in the region close to the cathode surface, at 1 µs, and the carbon emission signal was weak. With further evolution of the spark plasma, the carbon plume expands toward the anode. At 11 µs, the emission signal was highest at 1.4 mm away from the cathode surface (), and the carbon plume extended upward toward the anode surface. After 11 µs, the carbon emission signal intensity decreased rapidly with time. The lifetime of the plasma was estimated to be about 15 µs. The spatial and temporal trend in spark plasma emission observed in our system was consistent with those described in earlier studies on spark discharge formation and evolution (Walters Citation1972; Walters and Goldstein Citation1984). As Walters (Citation1977) noted, when a high voltage pulse is applied between the electrodes, a conducting ion channel is first established to induce dielectric breakdown of air and is directed toward the cathode. This conducting channel further spatially expands due to energy deposition in the interelectrode space, leading to a pulsed spark discharge. After the energy deposition initiates, the plasma plume at the cathode surface expands rapidly due to space-charge effects, while the central conducting channel rapidly shrinks as the energy deposition in the interelectrode gap ceases. Our measurements are consistent with these mechanisms of spark discharge formation and propagation. From these measurements (), we estimated the transport time of the carbon species between the cathode and anode to be about 8 µs. The axial velocity of carbon species, defined as the ratio of inter-electrode distance to transport time between the cathode and anode, was estimated to be 0.6 mm µs−1. Axial velocity reported by Walters and Goldstein (Citation1984) was approximately 1.0 mm µs−1 for copper species and 0.8 mm µs−1 for silver in a similar pulsed spark plasma. The variations in the axial velocity of emission fronts are perhaps due to differences in spark characteristics, electrode characteristics, electrode configuration, and the chemical species.
Figure 4. (a) Spatial and temporal signal intensity of carbon emission line at 247.856 nm from the spark plasma. (b) Variation of carbon signal intensity as a function of interelectrode distance along the electrode axis.
Using a Boltzmann plot, the estimated plasma excitation temperature in our system, based on C II emission, varied in the range of 15,000–35,000 K depending on the interelectrode distance and delay time. The electron density was estimated by examining Stark broadening of the Hα line (656.28 nm) and was found to be in the range 1.0 × 10¹⁷–2.2 × 1017 cm−3. The laser-induced plasma in our system was not characterized in this study; however, Harilal et al. (Citation1997) have reported the excitation temperature in a similar LIBS carbon plasma to be in the range of 1.6–2.4 eV (equivalent to 18,500–27,800 K), and an electron density in the range of 1.1 × 10¹⁷–2.1 × 1017 cm−3. Both plasma types, i.e., laser and spark-induced, exhibited similar ranges for excitation temperature and electron density.
3.3. System calibration
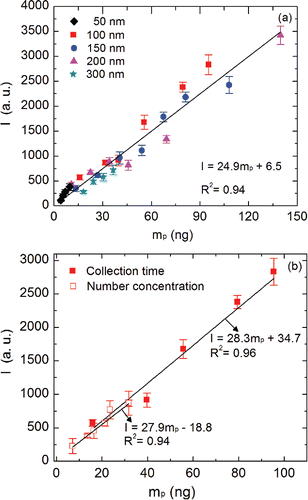
The effect of particle size on the carbon signal was probed before constructing calibration curves for polydisperse carbonaceous aerosol. Calibration curves for sucrose particles of diameter 50 nm, 100 nm, 150 nm, 200 nm, and 300 nm were obtained and compared using the SES system. shows calibration curves for various particle diameters over the particulate mass range of 4–140 ng. To construct these calibration curves, the mass of particles collected on the electrodes was varied and the corresponding emission signal was recorded for each mass loading. Three methods were used to vary the particulate mass loading on the electrode. First, the mass loading was changed by changing the particle diameter of the DMA-classified aerosol (). The second approach involved changing the mass loading by changing the collection time over which particles accumulate on the electrode, for a given particle size (100 nm) and aerosol number concentration (, filled symbols). The third method involved changing the inlet concentration of the aerosol to change the particulate mass loading (while keeping the size and collection times the same). show that within the range of experimental uncertainty, the sucrose calibration curves agree well. The method sensitivity (S), based on the calibration curves, agreed within 15% for these three methods. The data in also imply that the emission signal was independent, within the range of experimental uncertainty, of the particle size deposited on the collection electrode. This ensures that calibration curves constructed using monodisperse particles were applicable when analyzing polydisperse aerosol in the submicrometer size range investigated.
Figure 5. (a) Calibration curves for near-monodisperse sucrose aerosol with different particle diameters: 50 nm, 100 nm, 150 nm, 200 nm, and 300 nm. (b) Calibration curves for sucrose constructed by changing the collection time and aerosol number concentration.
Calibration curves for organic and inorganic materials, including EDTA, caffeine, Na2CO3, carbon black, and CNT were also obtained using the SES setup. The slope of each linear calibration curve for different carbon materials and the correlation coefficients are shown in . The sensitivity (S) for carbon measurement was highest for CNT, followed by sucrose, carbon black, caffeine, Na2CO3, and EDTA. The reasons for difference in sensitivity across the different materials are unknown, but part of the variability could relate to varying particle morphology (across different carbon materials), which indirectly affects the mass loading estimation (which assumed spherical particle shape). For nonspherical particles with χ > 1, particulate mass calculated using spherical mobility diameter would lead to an overestimation of calculated mass (Kulkarni et al. Citation2011), which can range from approximately 33% at χ = 1.1 to 237% at nonspherical shapes with χ = 1.5. This error in mass estimation may partially explain the difference in sensitivity across particle types, especially for carbon black and CNT, which were relatively more nonspherical in shape. Dynamic shape factors of carbon black and CNT particles were not measured in this study. However, DSFs of approximately 1.5 for diesel exhaust particles (Park et al. Citation2004) and soot particles ( = 100 nm; Slowik et al. Citation2004) have been reported for aerosols generated by the combustion of diesel or gaseous fuel, of which elemental or black carbon was the main component. Ku and Kulkarni (Citation2015) reported a DSF of 1.8 for CNT particles (
= 100 nm) generated by pneumatically atomizing CNT suspension (using the same system used in this work). Based on these values, a DSF of 1.5 was assumed for carbon black particles and 1.8 for CNT particles in this study. Since sucrose, EDTA, caffeine, and Na2CO3 aerosol were obtained from dissolved solids, their DSF was assumed to be 1.
Table 1. LODs in terms of mass and air concentration obtained by SES.
shows a calibration curve for the pooled data from all carbonaceous materials used in this study. A single calibration curve was obtained for the entire data set. The sensitivity of the “ensemble” calibration curve was 27.9 a.u. ng−1, which was about 23% higher than the lowest sensitivity measured (for EDTA) and 20% lower than the highest sensitivity measured (for CNT) in this study. The ensemble calibration curve in is useful for measurement of carbonaceous aerosol where the nature or structure of the carbonaceous matter is not known a priori. The pooled, ensemble calibration curve in captures uncertainties in atomic emission signal due to different molecular forms of carbon allotropes, different non-carbon matrices (i.e., matrix effect), and uncertainties associated with the particle collection (i.e., deposited particulate mass on electrodes).
Figure 6. Calibration curves for sucrose, EDTA, caffeine, sodium carbonate, carbon black, and CNT constructed by SES.
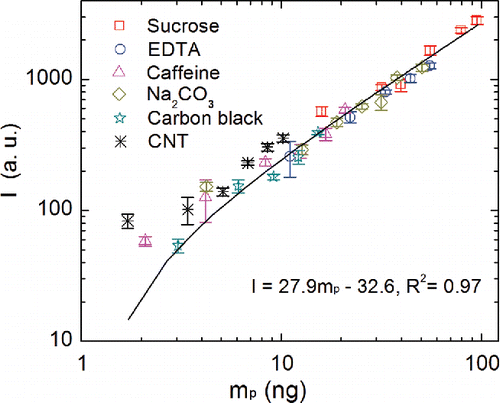
Using the ensemble calibration curve may lead to an increased error ranging from 1.4% for sucrose to 23% for EDTA. The magnitude of this error is comparable to the uncertainty involved in the measurement of the calibration curves. The relative standard deviation (RSD) calculated by three replicate measurements varied in a range of 2%–14%, as shown in , representing the reproducibility of a spectral response when measuring airborne particles using SES.
We also studied the applicability of LIBS for carbonaceous aerosol measurement using the same aerosol collection system. Comparison of calibration curves obtained from both SES and LIBS methods for carbon black particles is shown in Figure S2 in the SI. Sensitivity of both microplasma methods was comparable.
3.4. Limits of detection
As listed in , the mass LODs range from 1.26 ng to 1.94 ng. By assuming a collection time of 5 min and a flow rate of 1.5 L min−1, the LOD in terms of air concentration is in the range 186–287 ng m−3. Much lower LODs can be achieved by increasing the collection time and/or flow rate. Obviously, there is a conflict between LOD and time resolution. However, thermal analysis methods have higher EC LODs (e.g., typically about 1 µg m−3) and require filter sampling over relatively long periods, and/or collection at high flow rates (air volumes), to achieve comparable LODs (Turpin et al. Citation1990; Rupprecht et al. Citation1995; Birch and Cary Citation1996; Schauer et al. Citation2003; Bae et al. Citation2004). Other studies on measurement of carbonaceous particulate matter by plasma spectroscopy have reported carbon LODs of 60 µg m−3 or higher (Vors and Salmon Citation2006; Lee and Yoh Citation2012), which were significantly higher than the LODs found in our study.
3.5. CNT measurement comparison
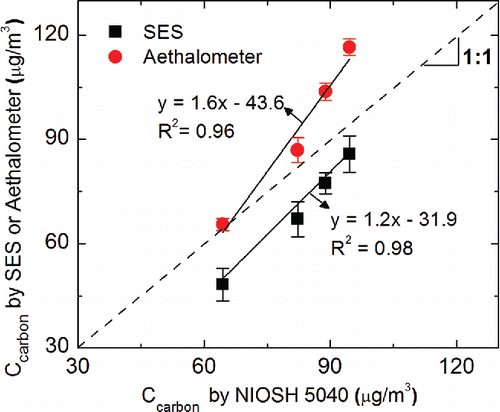
SES measurements of unknown CNT aerosol samples were compared with those from the other commonly used methods for measurement of carbonaceous aerosol. Four suspensions with different CNT concentrations were prepared and used to generate the test aerosols. The airborne concentration of carbon in the test aerosol was determined using our SES system. The ensemble calibration curve () was used to obtain the carbon particulate mass deposited on the electrode, which was then inverted to an air concentration. Parallel and independent measurements of the test aerosol were obtained using two separate methods: (i) NIOSH Method 5040, and (ii) a portable aethalometer (microAeth®Model AE51, AethLabs, San Francisco, CA, USA) for “black carbon” (BC).
As discussed, NIOSH Method 5040 is a thermal-optical technique that measures elemental and organic carbon. In addition to diesel particulate matter (as EC), Method 5040 has been applied to workplace monitoring of CNT/CNF (Birch et al. Citation2011). Because CNT/CNF are composed of EC, EC is a quantitative measure of airborne CNT/CNF (Birch et al. Citation2011). A manual OC-EC split is assigned in the 5040 analysis of CNT/CNF as the relatively large particle size (μm-scale as opposed to nanoscale DPM) and agglomerate structure make the auto-split unreliable (NIOSH Citation2013). The portable aethalometer measures optical absorption of BC (i.e., light absorbing) aerosol collected on a filter, at 880 nm wavelength. However, aethalometer measurements can result in large bias if the size distribution and refractive index of the aerosol are vastly different from those of the aerosol used for instrument calibration. All three methods (SES, NIOSH Method 5040, and aethalometer) use different measurement principles. As such, the agreement between them will depend on the aerosol properties, including particle size distribution, refractive index, relative abundance of organic and inorganic carbon, sample matrix components, particle morphology, and structure. shows a comparison of CNT aerosol measurements by SES and the aethalometer, with EC determined by NIOSH Method 5040. SES measurements were, on an average, 13.8% lower than the EC results determined by NIOSH Method 5040 (with manual split), while the average aethalometer measurements were higher by 12.0%. We note that the three methods used in this study measure different physical or chemical properties of the aerosol, which, in turn serve as a surrogate measure of specific carbonaceous component of the particulate matter of interest. All three methods should agree closely, if: (i) the same aerosol is used in calibration of all methods, (ii) all methods are calibrated with respect to the same reference measurement method, and (iii) particle size/shape and sample matrix of the unknown sample and the calibration aerosol are the same. In this study, default calibrations for both aethalometer and the NIOSH methods were used. As a result, there was a large difference in the size distribution and chemical composition of the calibration aerosol as well as the calibration approaches used for the three methods. These factors may explain the difference in carbon measurements reported in .
Figure 7. Comparison of carbon nanotube concentrations measured from SES, aethalometer, and NIOSH Method 5040.
3.6. SES measurements at elevated electrode temperature
Our SES method measures total atomic carbon (TAC), including the EC and OC fractions in the particulate sample. To reduce the potential interference of OC (if present), we examined the effectiveness of SES measurements at elevated electrode temperature. Specifically, the particle collection electrode was heated to a temperature of up to 300°C (higher temperatures could not be maintained in this study, though they could possibly be achieved with redesign of the heating elements). The OC fraction can vary, but it will likely be reduced with increasing temperature, through various processes such as evaporation, oxidation, and thermal decomposition. The degree of OC interference depends on the nature of the organic matter. Under the thermal conditions of the electrode surface in our SES system, held at or below 300°C, vaporization is the most likely mechanism for removing organic compounds from the particulate matrix on the electrode (Lapuerta et al. Citation2007). However, some nonvolatile organic compounds (e.g., sucrose) could decompose to form volatile components (Šimkovic et al. Citation2003), and any residue or other nonvolatile organic components could preferentially be oxidized from the electrode. In our system, carbonization of carbonaceous particulate matter in an inert atmosphere does not occur as oxygen is present continuously during the analysis.
In our tests, particles were first collected at room temperature over a predetermined period, following which the heater was activated to increase the electrode temperature, which was then held at a set value for 2 min. Subsequently, the spark microplasma was introduced and the atomic emission signal was recorded using the procedure described earlier. During the particulate sample heating, a constant air flow rate of 1.5 L min−1 was maintained through the chamber, which ensured quick removal of products of evaporation away from the interelectrode space. shows the atomic emission signals for a given initial mass, as a function of electrode temperature, for the organic (a) and inorganic (b) materials examined in this study. All organic materials, with the exception of humic acid sodium salt, show a clear reduction in signal with increasing temperatures, above approximately 200°C (). There was no detectable particulate carbon on the electrode beyond 300°C (except for humic acid sodium salt). This behavior is consistent with the fact that these organic materials have boiling point or decomposition temperatures below 300°C (Wendlandt Citation1960; Šimkovic et al. Citation2003). However, the signal from humic acid sodium salt was unchanged, even when the electrode was heated to 300°C, likely due to the higher temperature required to remove this material (manufacturer specifies a melting point greater than 300°C). We conducted thermal optical analysis of humic acid sodium salt using the Sunset Laboratory EC/OC analyzer. The thermal program was modified to conduct the analysis in the oxidative mode (5% O2/He mixture) to approximately mimic the oxidative conditions in SES analysis. No peak was observed below 300°C, implying that very little mass would be lost from the electrode below 300°C.
Figure 8. Change in carbon signal intensity as a function of electrode temperature for various organic (a) and inorganic (b) carbonaceous materials.
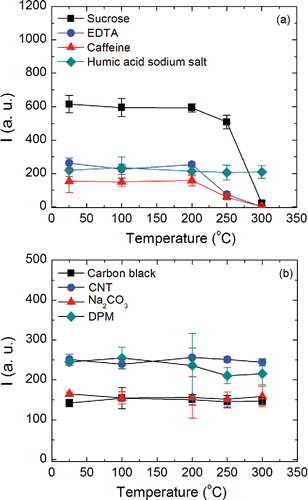
None of the inorganic carbon materials tested showed a change in the emission signal with increasing electrode temperature (), but electrode temperatures higher than 300°C could not be achieved due to design constraints. indicates that the OC contribution to the TAC could be further reduced if SES measurements are conducted after heating the electrode beyond 300°C.
It is well known that OC-EC measurement by thermal analysis techniques is method dependent. Among other factors, speciation depends on the sample composition, particle morphology, atmosphere surrounding the sample, sample substrate and matrix, thermal program, instrument design (including char correction method, if used), and nature of the thermal decomposition process (pyrolysis/combustion/volatilization). Thermal techniques used for OC-EC speciation in airborne particulate matter have mainly included thermal-optical transmittance (TOT; Birch and Cary Citation1996; Birch Citation1998; Peterson and Richards Citation2002; Chow et al. Citation2005; Bauer et al. Citation2009; Pavlovic et al. Citation2014), thermal/optical reflectance (TOR; Chow et al. Citation2007; Han et al. Citation2007; Pavlovic et al. Citation2014), thermogravimetric analysis (TGA; Iwatsuki et al. Citation1998; Stratakis and Stamatelos Citation2003; Lapuerta et al. Citation2007); and thermal manganese dioxide oxidation (TOM; Fung Citation1990; Park et al. Citation2005). Current methods are mainly based on NIOSH Method 5040 and similar protocols, which use a Sunset Laboratory analyzer, or the IMPROVE protocol, based on a different analyzer design (Desert Research Institute [DRI], Reno, NV, USA). Some of the OC-EC methods that have been applied, including direct-reading methods, and their operating parameters are summarized in Table S3 in the SI. Different sample types can exhibit varying degrees of carbonization. A major cause of disagreement between the samples is the extent of carbonization and correction for it, which, in turn, depends on the thermal program and instrument design (Birch Citation1998). In inert atmosphere, a maximum of 550°C (used in the IMPROVE protocol) gives higher EC results than the Speciation Trends Network (STN) and NIOSH-based protocols, which typically use 850°C or higher (Birch and Cary Citation1996; Birch Citation1998).
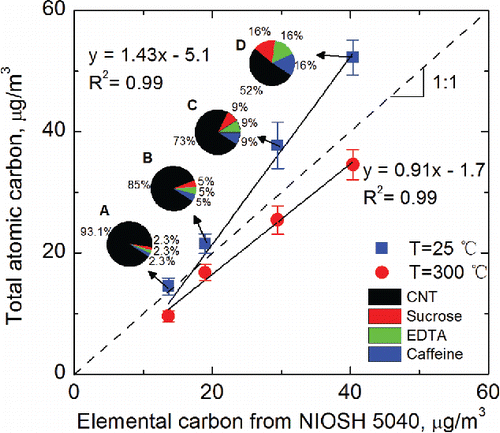
To further probe the degree of selectivity for EC, measurements were conducted on four test aerosols, which were atomized from four liquid solutions (A–D) of organic and elemental/inorganic materials mixed in varying proportions. Composition and liquid concentration of each component in these solutions are shown in Table S4 in the SI. As the focus was on measurement of EC, only one source of EC (i.e., CNT) and three sources of OC (sucrose, EDTA, and caffeine) were used. These mixtures resulted in EC/OC ratios in the range 1–13 as shown in Table S4. The carbon particulate mass deposited on the electrode was obtained based on the ensemble calibration curve (), and then inverted to an air concentration. Total atomic carbon results from SES measurements of the test aerosols generated from these four samples (A–D) were compared with the corresponding EC measurements by NIOSH Method 5040. Results of the comparison are shown in , at electrode temperatures of 25°C and 300°C. The pie charts in show the composition of the mixtures as relative fractions of CNT, sucrose, EDTA, and caffeine in each sample: A, B, C, and D. The ensemble calibration curve was used to obtain TAC in SES measurements. The lowest EC concentration was limited to 12 µg m−3 in these tests. At this air concentration, the detection limits of NIOSH Method 5040 required a minimum of 2 h of sample collection. The test aerosol was relatively stable during this 2 h period. SES measurements (with collection time of 2 min) were obtained every 30 min during this 2 h period (for each sample mixture). Each data point in is the average of four SES measurements. shows linear fits to data obtained at two electrode temperatures of 25°C and 300°C. A slope of 1 for these linear fits would indicate excellent agreement between TAC and EC. The figure shows that, for the carbon concentration range studied, SES measurements overestimate EC by 6%, 14%, 28%, and 29% for sample A, B, C, and D, respectively, at 25°C; whereas they underestimate the EC about 13% at an electrode temperature of 300°C. The TAC at 25°C was obtained before the separation of OC and EC, such that it was higher than the EC results from NIOSH Method 5040. In contrast, the TAC at 300°C agreed well with EC results determined by NIOSH Method 5040, being within the range of measurement uncertainty. Thus, our study indicates that TAC measurement at elevated electrode temperature can improve the selectivity for EC.
Figure 9. Comparison of TAC obtained in this work with EC from NIOSH Method 5040. The pie charts show relative compositions of liquid solutions used to generate the test aerosol. The actual liquid concentrations of individual components in these solutions are shown in Table S4 in the SI.
The time resolution of our SES carbon measurement will depend on aerosol sampling flow rate, aerosol concentration, and the limits of quantification (LOQ) of the method. Assuming a flow rate of 2 L min−1, the calculated particle collection time (corresponding to measured mass LOD) was in the range of 1–15 min at an air concentration of carbonaceous aerosol in the range 0.2–3 µg m−3. Each carbon measurement cycle consists of the following steps: (i) particle collection (∼ minutes), (ii) wait time (<30 s), and (iii) repeated ablations of the particulate sample and atomic emission measurement (<30 s). The apparent time resolution (i.e., duty cycle), corresponding to the above particle collection times, therefore would be in the range of approximately 2–16 min. The commercially available, semi continuous OC-EC aerosol analyzer from Sunset Laboratory Inc. has a time resolution of 30 min to 8 h, and the R&P 5400 Ambient Particulate Carbon Monitor has a time resolution of 1 h (Lim et al. Citation2003). The SES method is capable of providing more sensitive detection at higher time resolution.
4. Conclusions
Microelectrode-based preconcentration was successfully coupled with microplasma emission spectroscopy, using spark plasmas as excitation source, for near real-time measurement of carbonaceous aerosols. Calibration curves were obtained for various pure organic and inorganic materials including, sucrose, EDTA, caffeine, Na2CO3, carbon black, and CNT. The measurement sensitivity was found to vary across types of carbonaceous material for a given excitation source; the difference between the lowest and the highest measured sensitivity was about 54%. A single calibration curve could be obtained by pooling together the calibration data for all the organic and inorganic carbonaceous materials. The method intrinsically measures total atomic carbon. It was shown that selectivity to inorganic carbon can be improved by conducting measurements at elevated electrode temperatures of up to 300°C. Measurements at electrode temperatures beyond 300°C should allow further improvement in measurement selectivity to engineered carbonaceous nanomaterials. LOD (in terms of TAC) was found to be in the range of 1.26–1.94 ng, which corresponds to 187–287 ng m−3, in terms of air concentration at a sample flow rate of 1.5 L min−1 and a sampling time of 5 min. The reproducibility of spectral response for laboratory generated aerosol was in the range of 2%–14%. Measurement of carbon concentration of test aerosols, generated by using complex mixtures of organic, inorganic, and CNT material, using our SES method agreed well with those from the NIOSH method 5040. The SES method presented here has superior sensitivity and time resolution compared to current commercial methods. In addition to carbon, the method is also capable of measuring several metals of interest to workplace exposure, which makes it suitable for measurement of engineered nanomaterials containing metals and carbon. The method is particularly well-suited for development of low-cost portable hand-held instruments for personal or mobile aerosol measurement applications.
UAST_1224804_Supplemental_file.zip
Download Zip (262.1 KB)Acknowledgments
The authors would like to thank Patrick Cobler of Cascodium Inc. for assistance with the high voltage spark generator, and Quinn Birch for thermal optical analysis of humic acid samples. Thanks to Drs. Kevin Ashley and Jack Lynch of NIOSH for helpful comments and discussion. The findings and conclusions in this report are those of the authors and do not necessarily represent the views of the National Institute for Occupational Safety and Health. Mention of product or company name does not constitute endorsement by the Centers for Disease Control and Prevention.
Related Research Data
References
- Bae, M.-S., Schauer, J. J., DeMinter, J. T., Turner, , and Smith, D. (2004). Validation of a Semi-Continuous Instrument for Elemental Carbon and Organic Carbon Using a Thermal-Optical Method. Atmos Environ., 38:2885–2893.
- Batmunkh, T., Kim, Y. J., Lee, K. Y., Cayetano, M. G., Jung, J. S., Kim, S. Y., Kim, K. C., Lee, S. J., Kim, J. S., Chang, L. S., and An, J. Y. (2011). Time-Resolved Measurements of PM2.5 Carbonaceous Aerosols at Gosan, Korea. J. Air Waste Manage., 61:1174–1182.
- Bauer, J. J., Yu, X.-Y., Cary, R., Laulainen, N., and Berkowitz, C. (2009). Characterization of the Sunset Semi-Continuous Carbon Aerosol Analyzer. J. Air Waste Manage., 59:826–833.
- Birch, M. E. (1998). Analysis of Carbonaceous Aerosols: Interlaboratory Comparison. Analyst, 123:851–857.
- Birch, M. E., and Cary, R. A. (1996). Elemental Carbon-Based Method for Monitoring Occupational Exposures to Particulate Diesel Exhaust. Aerosol Sci. Technol., 25:221–241.
- Birch, M. E., Ku, B.-K., Evans, D. E., and Ruda-Eberenz, T. A. (2011). Exposure and Emissions Monitoring During Carbon Nanofiber Production-Part I: Elemental Carbon and Iron-Soot Aerosols. Ann. Occup. Hyg., 55:1016–1036.
- Boumans, P. (1994). Detection Limits and Spectral Interferences in Atomic Emission Spectrometry. Anal. Chem., 66:459A–467A.
- Bricklemyer, R. S., Brown, D. J., Barefield, J. E., and Clegg, S. M. (2011). Intact Soil Core Total, Inorganic, and Organic Carbon Measurement Using Laser-Induced Breakdown Spectroscopy. Soil Sci. Soc. Am. J., 75:1006–1018.
- Broekaert, J. A. C. (2002). The Development of Microplasmas for Spectrochemical Analysis. Anal. Bioanal. Chem., 374:182–187.
- Chow, J., Watson, J., Chen, L.-W., Paredes-Miranda, G., Chang, M.-C., Trimble, D., Fung, K., Zhang, H., and Zhen Yu, J. (2005). Refining Temperature Measures in Thermal/Optical Carbon Analysis. Atmos. Chem. Phys., 5:2961–2972.
- Chow, J. C., Watson, J. G., Chen, L.-W. A., Chang, M. O., Robinson, N. F., Trimble, D., and Kohl, S. (2007). The IMPROVE_A Temperature Protocol for Thermal/Optical Carbon Analysis: Maintaining Consistency with a Long-Term Database. J. Air Waste Manage., 57:1014–1023.
- Chow, J. C., Watson, J. G., Pritchett, L. C., Pierson, W. R., Frazier, C. A., and Purcell, R. G. (1993). The DRI Thermal/Optical Reflectance Carbon Analysis System: Description, Evaluation and Applications in US Air Quality Studies. Atmos. Environ. Part A., 27:1185–1201.
- Dahm, M. M., Evans, D. E., Schubauer-Berigan, M. K., Birch, M. E., and Deddens, J. A. (2012). Occupational Exposure Assessment in Carbon Nanotube and Nanofiber Primary and Secondary Manufacturers: Mobile Direct-Reading Sampling. Ann. Occup. Hyg., 57(3):328–344.
- DeCarlo, P. F., Kimmel, J. R., Trimborn, A., Northway, M. J., Jayne, J. T., Aiken, A. C., Gonin, M., Fuhrer, K., Horvath, T., and Docherty, K. S. (2006). Field-Deployable, High-Resolution, Time-of-Flight Aerosol Mass Spectrometer. Anal. Chem., 78:8281–8289.
- DeCarlo, P. F., Slowik, J. G., Worsnop, D. R., Davidovits, P., and Jimenez, J. L. (2004). Particle Morphology and Density Characterization by Combined Mobility and Aerodynamic Diameter Measurements. Part 1: Theory. Aerosol Sci. Technol., 38:1185–1205.
- Diwakar, P., Kulkarni, P., and Birch, M. E. (2012). New Approach for Near Real-Time Measurement of Elemental Composition of Aerosol Using Laser-Induced Breakdown Spectroscopy. Aerosol Sci. Technol., 46:316–332.
- Diwakar, P. K., and Kulkarni, P. (2012). Measurement of Elemental Concentration of Aerosols Using Spark Emission Spectroscopy. J. Anal. Atmos. Spectrom., 27:1101–1109.
- Dong, M., Mao, X., Gonzalez, J. J., Lu, J., and Russo, R. E. (2012). Time-Resolved LIBS of Atomic and Molecular Carbon From Coal in Air, Argon and Helium. J. Anal. Atmos. Spectrom., 27:2066–2075.
- Fung, K. (1990). Particulate Carbon Speciation by MnO2 Oxidation. Aerosol Sci. Technol., 12:122–127.
- Glumac, N. G., Dong, W. K., and Jarrell, W. M. (2010). Quantitative Analysis of Soil Organic Carbon Using Laser-Induced Breakdown Spectroscopy: an Improved Method. Soil Sci. Soc. Am. J., 74:1922–1928.
- Gross, D. S., Gälli, M. E., Kalberer, M., Prevot, A. S., Dommen, J., Alfarra, M. R., Duplissy, J., Gaeggeler, K., Gascho, A., and Metzger, A. (2006). Real-Time Measurement of Oligomeric Species in Secondary Organic Aerosol with the Aerosol Time-of-Flight Mass Spectrometer. Anal. Chem., 78:2130–2137.
- Han, Y., Cao, J., Chow, J. C., Watson, J. G., An, Z., Jin, Z., Fung, K., and Liu, S. (2007). Evaluation of the Thermal/Optical Reflectance Method for Discrimination between Char-and Soot-EC. Chemosphere, 69:569–574.
- Harilal, S. S., Bindhu, C. V., Issac, R. C., Nampoori, V. P. N., and Vallabhan, C. P. G. (1997). Electron Density and Temperature Measurements in a Laser Produced Carbon Plasma. J. Appl. Phys., 82:2140–2146.
- Hunter, A. J. R., Morency, J. R., Senior, C. L., Davis, S. J., and Fraser, M. E. (2000). Continuous Emissions Monitoring Using Spark-Induced Breakdown Spectroscopy. J. Air Waste Manage., 50:111–117.
- Iwatsuki, M., Kyotani, T., and Matsubara, K. (1998). Fractional Determination of Elemental Carbon and Total Soluble and Insoluble Organic Compounds in Airborne Particulate Matter by Thermal Analysis Combined with Extraction and Heavy Liquid Separation. Anal. Sci., 14:321–326.
- Ku, B. K., and Kulkarni, P. (2015). Measurement of Transport Properties of Aaerosolized Nanomaterials. J. Aerosol Sci., 90:169–181.
- Kulkarni, P., Baron, P. A., and Willeke, K. (2011). Nonspherical Particle Measurement: Shape Factor, Fractals, and Fibers. John Wiley & Sons, Inc., New York, pp. 507–547.
- Lapuerta, M., Ballesteros, R., and Rodríguez-Fernández, J. (2007). Thermogravimetric Analysis of Diesel Particulate Matter. Meas. Sci. Technol., 18:650–658.
- Lee, S. H., and Yoh, J. J. (2012). Spectroscopic Detection of Carbon Particulates from a High Speed Jet Stream with Extended Plasma Visualization. Spectrochim. Acta. B-Atmos. Spectrosc., 74–75:144–150.
- Lim, H. J., Turpin, B. J., Edgerton, E., Hering, S. V., Allen, G., Maring, H., and Solomon, P. (2003). Semicontinuous Aerosol Carbon Measurements: Comparison of Atlanta Supersite Measurements. J. Geophys. Res. Atmos., 108(D7):8419.
- Martin, M. Z., Cheng, M. D., and Martin, R. C. (1999). Aerosol Measurement by Laser-Induced Plasma Technique: A review. Aerosol Sci. Technol., 31:409–421.
- NIOSH. (2013). Current Intelligence Bulletin 65: Occupational Exposure to Carbon Nanotubes and Nanofibers. DHHS NIOSH Publication No. 2013–145, U.S. Departmnet of Health and Human Services, Washington DC.
- Park, K., Kittelson, D. B., and McMurry, P. H. (2004). Structural Properties of Diesel Exhaust Particles Measured by Transmission Electron Microscopy (TEM): Relationships to Particle Mass and Mobility. Aerosol Sci. Technol., 38:881–889.
- Park, S. S., Bae, M. S., Schauer, J. J., Ryu, S. Y., Kim, Y. J., Cho, S. Y., and Kim, S. J. (2005). Evaluation of the TMO and TOT Methods for OC and EC Measurements and Their Characteristics in PM 2.5 at an Urban Site of Korea During ACE-Asia. Atmos. Environ., 39:5101–5112.
- Pavlovic, J., Kinsey, J., and Hays, M. (2014). The Influence of Temperature Calibration on the OC–EC Results from a Dual-Optics Thermal Carbon Analyzer. Atmos. Meas. Tech., 7:2829–2838.
- Peterson, M. R. and Richards, M. H. (2002). Thermal-Optical-Transmittance Analysis for Organic, Elemental, Carbonate, Total Carbon, and OCX2 in PM2.5 by the EPA/NIOSH Method, in Proceedings, Symposium on Air Quality Measurement Methods and Technology, Air & Waste Management Association, Pittsburgh, PA, pp. 83–81.
- Polidori, A., Turpin, B. J., Lim, H.-J., Cabada, J. C., Subramanian, R., Pandis, S. N., and Robinson, A. L. (2006). Local and Regional Secondary Organic Aerosol: Insights from a Year of Semi-Continuous Carbon Measurements at Pittsburgh. Aerosol Sci. Technol., 40:861–872.
- Rupprecht, G., Patashnick, H., Beeson, D., Green, R., and Meyer, M. (1995). A New Automated Monitor for the Measurement of Particulate Carbon in the Atmosphere, in Proceedings, Particulate Matter: Health and Regulatory Issues, pp. 262–267.
- Schauer, J. J., Mader, B., Deminter, J., Heidemann, G., Bae, M., Seinfeld, J. H., Flagan, R., Cary, R., Smith, D., and Huebert, B. (2003). ACE-Asia Intercomparison of a Thermal-Optical Method for the Determination of Particle-Phase Organic and Elemental Carbon. Environ. Sci. Technol., 37:993–1001.
- Šimkovic, I., Šurina, I., and Vričan, M. (2003). Primary Reactions of Sucrose Thermal Degradation. J. Anal. Appl. Pyrolysis, 70:493–504.
- Slowik, J. G., Stainken, K., Davidovits, P., Williams, L., Jayne, J., Kolb, C., Worsnop, D. R., Rudich, Y., DeCarlo, P. F., and Jimenez, J. L. (2004). Particle Morphology and Density Characterization by Combined Mobility and Aerodynamic Diameter Measurements. Part 2: Application to Combustion-Generated Soot Aerosols as a Function of Fuel Equivalence Ratio. Aerosol Sci. Technol., 38:1206–1222.
- Stratakis, G., and Stamatelos, A. (2003). Thermogravimetric Analysis of Soot Emitted by a Modern Diesel Engine Run on Catalyst-Doped Fuel. Combust. Flame, 132:157–169.
- Turpin, B. J., Cary, R. A., and Huntzicker, J. J. (1990). An In situ, Time-Resolved Analyzer for Aerosol Organic and Elemental Carbon. Aerosol Sci. Technol., 12:161–171.
- Vors, E., and Salmon, L. (2006). Laser-Induced Breakdown Spectroscopy (LIBS) for Carbon Single Shot Analysis of Micrometer-Sized Particles. Anal. Bioanal. Chem., 385:281–286.
- Walters, J. P. (1972). Formation and Growth of a Stabilized Spark Discharge. Appl. Spectrosc., 26:323–353.
- Walters, J. P. (1977). Spark Discharge - Application to Multielement Spectrochemical Analysis. Science, 198:787–797.
- Walters, J. P. and Goldstein, S. A. (1984). Emission Topography of a Stable Spark Discharge Train. Spectrochim. Acta. B-Atmos. Spectrosc., 39:693–728.
- Wendlandt, W. (1960). Thermogravimetric and Differential Thermal Analysis of (Ethylenedinitrilo) tetraacetic Acid and Its Derivatives. Anal. Chem., 32:848–849.
- Yao, S., Lu, J., Zheng, J., and Dong, M. (2012). Analyzing Unburned Carbon in Fly Ash Using Laser-Induced Breakdown Spectroscopy with Multivariate Calibration Method. J. Anal. Atmos. Spectrom., 27:473–478.
- You, J., Depalma, P. A., and Marcus, R. K. (1996). Nebulization and Analysis Characteristics of a Particle Beam-Hollow Cathode Glow Discharge Atomic Emission Spectrometry System. J. Anal. Atmos. Spectrom., 11:483–490.