
ABSTRACT
Glycerol and propylene glycol mixtures are common carrier solutions in electronic cigarettes. Aerosols produced from these mixtures will evaporate quickly in a dry environment due to their high volatility. In a humid environment, such as the lungs, the kinetics of evaporation and hygroscopic growth determine the evolution of aerosol plume glycerol. Here, we apply a temperature and relative humidity-controlled hygroscopicity/volatility tandem differential mobility analyzer system to study the growth and evaporation kinetics of glycerol aerosol over a wide range of temperature, relative humidity, and residence times. Results show that at dry conditions glycerol aerosols evaporate within seconds at temperatures warmer than 20°C and that the accommodation coefficient of glycerol vapor on dry glycerol particles is 0.8. Under humidified conditions, the mutual depression of vapor pressures of the aqueous glycerol/water solution slows the glycerol evaporation rate consistent with thermodynamic and kinetic model predictions. Model calculations show that water vapor aided condensation of glycerol can occur at high relative humidity for glycerol vapor concentrations that result in glycerol particle evaporation under dry conditions. The combined results will help with constraining computational modules that model the evolution of glycerol-containing aerosols along a prescribed thermodynamic trajectory.
Copyright © 2016 American Association for Aerosol Research
EDITOR:
Introduction
Glycerol (propane-1,2,3-triol) is a colorless, odorless, viscous liquid that is used in a variety of industries including pharmaceuticals (Lewis et al. Citation2014), biodiesel (Hemings et al. Citation2012), and more recently, electronic cigarettes. Electronic cigarettes produce an aerosol through vaporization of a liquid in a reservoir via electrical heating of a metal filament (Trtchounian et al. Citation2010). The liquid normally consists of glycerol (GLY), propylene glycol (PG), nicotine, water, and flavor additives with GLY and PG constituting the majority of the mass (Pellegrino et al. Citation2012; Kosmider et al. Citation2014). The relative fractions of PG and GLY within the fluid vary from source to source, ranging from ∼15% to nearly 100% GLY (AIHA 2014).
After the aerosol has formed, significant levels of PG are measured in the gas phase (Schripp et al. Citation2013) suggesting that the aerosol contains lower levels of PG then the forming solution. The aerosol will gain or lose water until it reaches equilibrium with the moisture content in the surrounding atmosphere. The equilibrium water content within the aerosol depends on the saturation ratio with respect to water (SH2O) and the particle chemical composition. Electronic cigarette aerosol is volatile and evaporation interferes with aerosol measurements especially in diluted and subsaturated with respect to GLY/PG environments (Ingebrethsen et al. Citation2012).
As a starting point for studying e-cigarette plumes, characterization of GLY aerosol is essential. Due to its relatively high saturation vapor pressure, GLY aerosol in a subsaturated environment is expected to have a short lifetime at standard conditions (Bertholon et al. Citation2013). Davies et al. (Citation2012) used an electrodynamic balance (EDB) to observe the evaporation rate of single supermicron aqueous GLY droplets at 10 ms time resolution and room temperature. The EDB measurements matched their kinetic model assuming that the mass accommodation coefficient of water is unity. Their model used activity coefficients from UNIFAC and Davies et al. (Citation2012) did not make any inferences about the volatility of GLY. The volatility of the aerosol constituents combined with the high number concentration has led to uncertainty in the nature of the e-cigarette plume number and size distributions. Electronic cigarettes produce aerosol number concentrations on the order of ∼109 cm−3 particles with a mean diameter ranging from ∼100 to 600 nm (Ingebrethsen et al. Citation2012; Fuoco et al. Citation2014; Alderman et al. Citation2015). The short particle lifetime, variability between devices from different manufacturers, and different measurement methods are possible explanations for the differing size distributions (Ingebrethsen et al. Citation2012). Optical (Ingebrethsen et al. Citation2012), gravimetric (Alderman et al. Citation2015), and electrical mobility (Fuoco et al. Citation2014) measurement techniques have been employed to measure electronic cigarette aerosol size distributions. However, these measurements did not account for particle evaporation.
Precise knowledge about the evolution of the electronic cigarette aerosol in the mouth and bronchial tract are needed to understand the deposition of this aerosol in the lung (Neilson et al. Citation2015). Warming of the aerosol to body temperature is expected to accelerate evaporation. In contrast, humidification to SH2O approaching 1 is expected to result in hygroscopic growth. Understanding the dynamic re-partitioning of water and electronic cigarette aerosol components and the evolution of particle size is important to model the location and composition of depositing compounds along the bronchial tract. A better understanding of deposition is needed to assess potential harmful effects on health (Pisinger and Døssing Citation2014) and indoor air quality (Schripp et al. Citation2013; Schober et al. Citation2014).
Tandem differential mobility analysis (TDMA, Rader et al. Citation1987) has been widely used to measure particle evaporation rates (Tao and McMurry Citation1989; Zhang et al. Citation1993; Bilde et al. Citation2003) and equilibrium hygroscopic growth over a wide range of SH2O for non-volatile sub-micron aerosols (Liu et al. Citation1978; McMurry and Stolzenburg Citation1989; Berg et al. Citation1998; Dick et al. Citation2000; Swietlicki et al. Citation2008; Suda and Petters 2013; Nguyen et al. Citation2014, and references therein). Tandem DMA instruments first size-select the aerosol in a differential mobility analyzer (DMA), maintain the monodisperse aerosol in a processing section for some time, and then measure the change in the size distribution using a second DMA operated in spectrometer mode (Wiedensohler et al. Citation2012). Bilde et al. (Citation2003) used a volatility TDMA to measure evaporation of compounds with saturation vapor pressures , using processing time scales ranging between 10 and 30 s. In comparison, GLY and PG are significantly more volatile, having
(CHERIC Citation2015) and
at 20ºC (Stull Citation1947). The high volatility increases the difficulty for measurements of the evaporation rate of electronic cigarette aerosol using the TDMA method. However, the high precision of mobility measurements and the ability to measure the combined effects of evaporation and hygroscopic growth makes adoption of this technique desirable.
Here, we demonstrate a methodology to measure the evaporation kinetics and hygroscopic growth of aerosol generated from GLY utilizing a temperature-controlled hygroscopicity/volatility TDMA system. In brief, the first DMA size selects particles at sufficiently cold temperature to prevent evaporation on the time scale of transit through the instrument. Transit time between the two DMAs is minimized, and a second temperature-controlled DMA is used as a combined sizing and evaporation section. A coupled mass transfer and DMA transfer model is used to determine the mass accommodation coefficient and humidity-dependent hygroscopicity parameter of GLY aerosol.
Methods
Experimental design
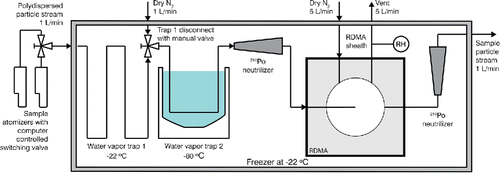
shows the size selection section of the TDMA system. Particles are generated using a Collison-type atomizer (TSI Model 3076; Liu and Lee Citation1975). The sample flow is immediately routed into a freezer that is maintained at a nominal temperature T = −22°C. Particles are dried by directing the sample through a two-stage water vapor trap. The first stage consisted of ∼1 m of electrically conductive tubing that is held at the freezer temperature. This removed the majority of the water vapor from the sample flow. The second trap consisted of a coil of tubing immersed in a dry ice/propanol bath (T ∼ −80°C). On passage through the −80ºC cold trap the GLY aerosol is expected to solidify. The freezing point for pure GLY is T = 17.8ºC (Lane Citation1925) and even highly concentrated metastable liquid haze drops are expected to freeze at T < −60°C (Koop et al. Citation2000). The two water vapor traps could be separated by switching the aerosol flow to a dry nitrogen flow using a manual three-way valve, which allowed for the fast replacement of the first vapor trap when it froze shut. After exiting the trap, the sample flow temperature was allowed to re-equilibrate with the freezer environment. A humidity sensor confirmed that the dew point was below the sensor's detectable limit of −70°C corresponding to SH2O < 0.05 at −22ºC. It is assumed that any potential residual particle bound water/ice sublimated. The dried aerosol was charge neutralized using two 210Po sources having nominal activity of 1 mCi and size selected using a radial differential mobility analyzer (RDMA; Zhang et al. Citation1995), operated at 5:1 Lpm sheath to sample flow ratio inside the freezer. The sheath flow consisted of N2 drawn from a liquid nitrogen source, ensuring that the effective SH2O inside the RDMA was maintained at << 0.01 while at the freezer temperature. The calculated residence time inside the RDMA was ∼2 s. The subcooled vapor pressure of GLY at T = −22ºC is Pa. For comparison, this vapor pressure is on the same order of magnitude as non-volatile solid phase succinic acid at room temperature (Soonsin et al. Citation2010). The vapor pressure is low enough that evaporation of GLY at the time scale of transit through the RDMA is expected to be negligible. A second 210Po neutralizer, also placed in the freezer, reinstated equilibrium charge distribution of the monodisperse aerosol after being size selected by the RDMA.
Figure 1. Schematic of the size selection portion of the TDMA system.
shows a schematic of the humidification and second DMA system. Experiments were performed with and without the humidifiers. Humidification was achieved using two liquid sheathed semi-permeable Nafion membrane humidifiers (Perma Pure MH-110-12S-4). Humidity could be varied by controlling the temperature of the water passing along the outside of the Nafion membrane. Sample flow humidification was achieved by mixing 3 Lpm of humidified air with 1 Lpm dry sample air inside a ¼” Swagelok cross fitting. The mixing volume was ∼1 cm3 and resided at room temperature between the freezer and the temperature-controlled second DMA. The second humidification system was placed in line with the sheath loop of the size scanning DMA. Sample and sheath flow RH were monitored using RH sensors. Manual control of the water temperature in the humidifiers was used to set the desired RH in the DMA.
Figure 2. Schematic of the humidification and temperature control of the second DMA.
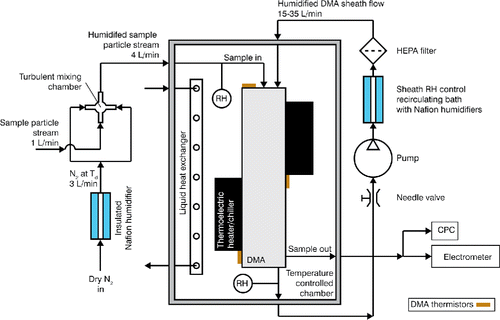
The second DMA consisted of a high flow DMA column (HF-DMA, Stolzenburg et al. Citation1998) that used a two-stage thermal stabilization system (Suda and Petters Citation2013). The DMA was placed inside an insulated box. A heat exchanger interfaced with a chilled bath circulator was used to control and maintain constant temperature between 4 and 35°C inside the box. To reduce thermal gradients along the HF-DMA column, two thermoelectric modules were used to minimize the streamwise column gradient. Temperature was monitored at three locations alongside the column and the standard deviation of the three thermistors evaluated at 1 Hz is ≤ ±0.02°C. For humidification experiments, the second DMA was allowed to thermally equilibrate to the box temperature overnight to ensure that the thermally more isolated inner column (electrode) is at the same temperature than the outer column.
Particle transit time between the exit of the freezer and the inlet of HF-DMA was less than 0.5 s. The HF-DMA was operated at sample flow rates varying between 15 and 35 Lpm, corresponding to average residence time of ∼2.8 to 6.4 s within the instrument. The HF-DMA was operated in scanning mobility mode (Wang and Flagan Citation1990) using an exponential down-scan from 5000 V to 10 V over 120 s. Particles were detected using a condensation particle counter (CPC, TSI Model 3772), which counts particles with diameter D > ∼10 nm, and an aerosol electrometer (TSI Model 3068), which measures total aerosol charge. Accurate mapping between sheath flow rate, time varying electric field, plumb time, and selected mobility diameter corresponding to +1 charges was verified using polystyrene latex spheres having nominal diameter D = 102 nm (Suda and Petters Citation2013).
An example of the size distributions derived from the CPC and the aerosol electrometer is shown in . A rolling average filter (window size = 7; Trauth Citation2007) was applied to the electrometer data to smooth it. The raw electrometer current was zero corrected and converted to number concentration by assuming that each particle carried a single charge and that the electrometer output current is proportional to the number of charged particles captured on the filter (Liu and Pui Citation1977). There are three apparent peaks, consistent with the expected size distribution for charge equilibrated output from a DMA operated at constant voltage (Wiedensohler Citation1988; McMurry Citation2000). The peaks at ∼180 and 300 nm correspond to +1 and +2 charged particles having equal mobility that were transmitted by the RDMA. The peak at ∼100 nm corresponds to the mobility dimeter of 180 nm particles having +2 charges. Agreement between the electrometer and CPC for the 180 nm and 300 nm peaks and a factor of two offset between electrometer and CPC at 100 nm experimentally confirm the theoretical expectation. In practice, the ∼180 nm and ∼300 nm peaks map to the physical diameters and are used in subsequent analysis. The second neutralizer was necessary to separate the two physical sizes. Evaporation rates are dependent on D2, and thus the two sizes evaporate at a different rate, which would cause error in attributing mobility changes to evaporation, had the sizes not been separated. Mode diameters were determined using log-normal fits to the CPC data. The electrometer provides no additional quantitative information for analysis and remained integrated for all experiments for system validation purposes. Errors in size selection, system wide deviations in temperature/flow rates, and particle detection cumulate in an estimated ±3 nm uncertainty in peak diameter.
Figure 3. Particle size distributions as measured with a CPC (black) and an aerosol electrometer (gray [red]). The two larger peaks are used for analysis.
![Figure 3. Particle size distributions as measured with a CPC (black) and an aerosol electrometer (gray [red]). The two larger peaks are used for analysis.](/cms/asset/26b07266-3e6b-49f4-b246-fc071f00f3e7/uast_a_1245405_f0003_oc.gif)
Particle trajectory model
The particle trajectory of an evaporating or growing particle through a DMA (Snider et al. Citation2006) is governed by a set of differential equations of the form (Knutson and Whitby Citation1975; Wilkes Citation2005; Xue et al. Citation2005):[1a]
[1b]
[1c] where
and
denote the radial and axial coordinates,
is the component number,
is the particle diameter,
is the particle mobility,
is the radial electric field for the selected potential,
is the streamwise velocity,
is the system temperature,
subsumes the material-dependent parameters of the ith species,
is the Fuchs mass flux correction term, and
and
are the partial pressure of the ith component in the sheath flow and over the particle. It is assumed that there is no streamwise electric field and no radial fluid velocity.
Functional forms for ,
,
,
, and
for the used DMA geometry and the binary GLY/H2O system are provided in the online supplementary information (SI). Briefly,
,
are taken from Knutson and Whitby (Citation1975) transfer function,
is the near-parabolic flow profile obtained for viscous, incompressible, laminar flow through a round pipe annulus (Wilkes Citation2005),
is taken from Xue et al. (Citation2005), applying modeled binary diffusion coefficients (Bird et al. Citation2002; see the SI) and accounting for the mass accommodation effect (Fuchs and Sutugin Citation1971). Saturation vapor pressure for pure GLY was taken from literature (CHERIC Citation2015; see the SI). During transit through the particle generation system the GLY aerosol passes through the dry ice bath (∼−80°C) and the freezer (−22°C). The aerosol is warmed in the measurement section of the system where the temperature of the particle can range from 4 to 35°C, which straddles the melting temperature of pure GLY. The glass transition temperature for GLY is <—80°C (Chang and Baust Citation1991) and it is likely that the particles form an amorphous solid as even sucrose aerosol is difficult to crystallize when dried at temperatures colder than the glass transition temperature (Rothfuss and Petters Citation2016). Assuming the particle is an amorphous solid at the cooler experimental temperatures allows for the extension of parameterized saturation vapor pressure below the melting temperature of pure GLY (Bilde et al. Citation2015). Crystalline versus amorphous solid vapor pressure approximately differ by one to two orders of magnitude (Booth et al. Citation2010). Ultimately, we neither know the phase state of the dried GLY aerosol nor the extent to which the vapor pressure formula can be extrapolated below the melting point, which increases the experimental uncertainty for T < 17°C. Rational activity coefficients for the GLY/H2O system were taken from the literature (Glycerine Producers Association Citation1963; ASTM Citation1990; Forney and Brandl Citation1992; additional details included in the SI). A table with parameters to repeat GLY/H2O and PG/H2O calculations is provided in the SI. Equations (1) were solved numerically to find the position and particle diameter as it transits through the DMA.
The minimum model time step for binary solutions containing water is 1 μs. The model is initialized with a particle diameter, the fractions of the i components (including water) comprising the particle, the gas-phase saturation ratios of the i components (including water), mass accommodation coefficients, DMA sheath flow rate, and temperature. The model solves for the particle trajectory for an assumed applied electrical potential. The assumed potential is iteratively varied until the particle trajectory terminates at the exit slit. Numerical mapping between and
was confirmed to be identical to the analytical solution of Knutson and Whitby (Citation1975) for particles that do not undergo changes in size during DMA transit. For a particle that evaporates or grows, the model provides a physical final particle diameter and the voltage resulting in transmission. The voltage resulting in transmission is expressed as apparent diameter using the Knutson and Whitby (Citation1975) analytical expression.
shows the modeled evolution of an initially dry GLY particle assuming four different hypothetical thermodynamic conditions. In the first 100 μs in the humidified environments, the particle gains a small amount of mass from hygroscopic growth. By 100 μs the particle stabilizes until ∼100 ms at which all four conditions show significant decreases in particle diameter with the fastest evaporation occurring at the non-humidified, warm condition. During evaporation, the GLY and water evaporate at similar rates. This is because the diffusivity of water is ∼1 order of magnitude greater than that of GLY. Consequently, the water content associated with GLY is well approximated by the equilibrium water content at the time scale of GLY evaporation.
Figure 4. Modeled evolution of a GLY particle with initial Dp = 150 nm in various temperature and SH2O environments. Each line corresponds to a T and SH2O indicated in the legend. The gray lines indicate the mass fraction of GLY within the particle for the two humidified conditions and utilize the right-hand axis.
shows the transit trajectory of each of the model particles through the DMA. The voltages necessary to steer the particle to the DMA sample outlet under the same environmental conditions as shown in are (ordered from top to bottom): (1) red—973.2 V; (2) blue—781 V; (3) green—823.3 V; (4) black—382.3 V, corresponding to apparent diameters 182.5, 158.6, 164, and 103 nm, respectively. In contrast, the actual final diameters are 152.4, 128.1, 122.7, and 66.7 nm. In practice, apparent diameters are determined experimentally () for a given sheath flow rate, and
and column temperature. The model is then tasked to reproduce the measurements by adjusting the mass accommodation coefficient
under the assumption that the mass accommodation coefficient of water is unity. Davies et al. (Citation2012) found that a kinetic model assuming
= 1 reproduced evaporation of water from water–GLY mixtures. The experimental time scale in the study presented here is much longer than the model time scale for water evaporation and model calculations are not sensitive to the assumed
.
Figure 5. Modeled particle trajectory within an HF-DMA with dimensions of 60 cm length and Δr between the outer wall and inner electrode of 0.8 cm. Arrows indicate forces acting on the particle. Numbers (colors) match the temperature and SH2O as indicated in .
Experimental scan strategies
Experiments were conducted in one of two methods. The first method consisted of dry temperature scans. To perform these experiments, the Nafion humidification systems were bypassed and the temperature in the second DMA chamber was swept from 5 to 35°C over 2–3 h. As the temperature increases, the evaporation rate of GLY particles increases and the apparent peak diameter for both the ∼180 and 300 nm particles () shrink. In addition to the shifting mode diameter, the peaks broaden. Broadening increases the uncertainty in determining the mode, which eventually leads to loss in the ability to track evaporation. Calculations presented in the SI show that the radial velocity of the particle through the DMA is slightly faster than the diffusion velocity of evaporated GLY vapor. The evaporating GLY particle is therefore always assumed to be surrounded by clean sheath flow. Consequently, these experiments correspond to thermodynamic conditions of SGLY and SH2O ∼0. The resulting experimental data are apparent evaporation vs. temperature at some DMA residence time that is determined by the sheath-flow rate.
The second method consisted of isothermal humidity scans. All components of the system were thermally equilibrated at the prescribed temperatures overnight. The SH2O in the sheath and sample lines of the second DMA was then varied from ∼0.7 to 0.95 over 2 to 3 h. During the run, alternating scans of glucose and GLY were performed. Measured growth factors from non-volatile glucose were used in conjunction with the Rotronic humidity sensors to infer the actual SH2O inside the DMA (Suda and Petters Citation2013). A computer-controlled actuated ball valve was placed between the atomizers and the water vapor traps () and switched between two atomizers that were outputting glucose or GLY aerosol. No observable change in the particle flow temperature or humidity was measured after valve switching actions. Glucose was chosen as a reference compound because it is non-volatile at the time scale of DMA transit, its water activity vs. water content relationship is precisely known from isopiestic measurements (Miyajima et al. Citation1983), the water activity vs. water content relationship is essentially independent of temperature (Zamora et al. Citation2011; Christensen and Petters Citation2012), the variation of glucose growth factors with SH2O is similar to that of GLY allowing measurements to stay within a narrower overall DMA sizing range, and the dried dynamic particle shape factor approaches unity (Suda and Petters Citation2013; Petters and Petters Citation2016). The resulting humidigrams reflect the combined hygroscopic growth and evaporation at a fixed temperature vs. SH2O.
Particle sizes are referenced against dry equivalent diameters that are assumed to be spherical. Many materials (e.g., the glucose and ammonium sulfate reference materials) will restructure into non-spherical shapes when dried (Biskos et al. Citation2006; Mikhailov et al. Citation2009). The difference between the mobility equivalent and the particle volume diameter can lead to a significant bias in hygroscopic growth results (Suda and Petters Citation2013). To account for irregular shapes, a dynamic shape factor of 1.03 was assigned for glucose and GLY. The shape factor was determined as described previously (Suda and Petters Citation2013). In brief, after the system is validated with the polystyrene latex spheres, dry glucose and ammonium sulfate were introduced into the system. The resulting size distributions were then modified by a shape factor to align the dry particle size with the predicted hygroscopically grown size distribution. This alignment is performed at moderate RH values (∼60–70%) where RH uncertainty is minimal. The same shape factor is then applied to data for all RH values throughout the experiment.
Results
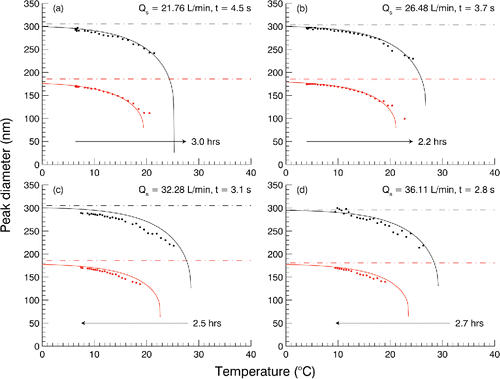
shows results for dry temperature scans at several sheath flow rates. Increasing particle shrinkage is observed for the two resolved initial 's, 180 nm and 300 nm. As expected longer residence times result in more evaporation; the highest detectable temperature is shifted from 21 to 28°C for 300 nm and 20 to 22°C for 180 nm particles when changing residence time from 4.5 to 2.8 s. Model calculations were performed in the 0.1 gridded space of
in the range of 0.6 to 1. A GLY mass accommodation coefficient of 0.8 was found to produce, on average, the minimum sum of least squares between the model and the data. Increasing or decreasing
would shift the curves toward colder or warmer temperature, respectively (not shown). As αm decreases the rate of evaporation/condensation is reduced. Particles therefore would survive longer at warmer temperatures. A sensitivity analysis on the dry GLY results shows that a 10% increase of the parameterized GLY vapor pressure yields model results that cannot be corrected by adjusting the mass accommodation coefficient (i.e., requires
> 1 to model results). A 10% decrease in the vapor pressure necessitates adjusting
to 0.9 to achieve model/data agreement for the three longer residence times and no change in
for the shortest residence time.
Figure 6. Experimental (dots) and model (solid line) results for dry GLY temperature scans at four different sheath flow (Qs) rates. The corresponding DMA residence time is shown in the upper right of each panel. Scan duration and direction is indicated by the arrow. Dashed line is the selected in the RDMA. Black/upper and gray(red)/lower data are for the two separate peaks shown in .
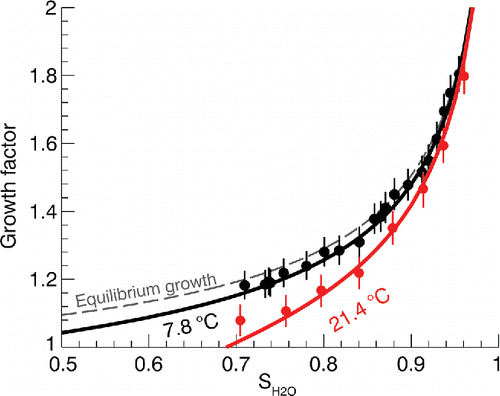
shows example humidigrams at system = 7.8 and 21.4°C. Data are shown as apparent growth factors, defined as the ratio of apparent diameter and selected dry diameter Dpd = 178 nm. At 7.8°C, evaporation is minimal and the experiment is expected to approximate the equilibrium hygroscopic growth of GLY aerosol. This was confirmed by comparing measured growth factors with predictions assuming no evaporation, which is equivalent to what is predicted from the parameterized bulk water activity vs. composition parameterization (see the SI) that is underlying the kinetic model. Close agreement between the thermodynamic prediction and observation indicates that kinetic limitations of water uptake due to GLY viscosity (
Pa s at T = 8°C; Glycerine Producers Association Citation1963) do not appear to play a role at the time scales of the measurements. At 21.4°C a combination of hygroscopic growth and evaporation is observed. This is in contrast to the strong evaporation observed at the same temperature and SH2O ∼ 0 (). Mutual vapor pressure reduction by GLY and H2O reduce the driving force for evaporation. Consequently, the GLY/H2O system is an illustrative example of an aqueous condensed phase to attract and maintain water soluble semi-volatile organic compounds (Topping et al. Citation2013; Nguyen et al. Citation2014). The stabilization effect of water on GLY is enhanced at higher SH2O since it leads to a stronger reduction in GLY vapor pressure over the solution. At SH2O ∼0.95 and T = 21.4°C, the GLY particle behaves as essentially non-volatile at the time scale of the measurement.
Figure 7. Example humidigrams at two different system temperatures. Dots are measured growth factor points and solid lines are the modeled result. Error bars on each measurement indicate ±3 nm uncertainty in the peak diameter measurements.
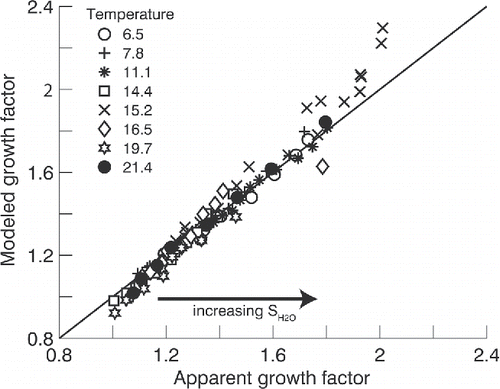
Additional humidigrams were generated for six temperatures spanning ∼6.5 to 21.4°C and each data point compared to the model predictions (results for these humidigrams are included in the SI). Results of this comparison are shown in . Satisfactory agreement between observed and modeled apparent growth factors in and is obtained over a wide range of SH2O and , assuming αm,GLY = 0.8 derived from dry evaporation experiments and αm,H2O = 1. This suggests that the measurements are repeatable and that the kinetic model based on known vapor pressure and activity coefficients is consistent with the experimental data. Model results were performed assuming a 10% error in the parameterized GLY saturation vapor pressure. At cold temperatures, there is minimal change in modeled growth factor. At warmer temperatures (> ∼19°C) the growth factor error approaches 5%.
Figure 8. Data and model comparison. Each point represents a single scan at a given temperature and SH2O. Different symbols indicate different isothermal experiments.
Discussion
Comparison between measured apparent diameters and the coupled evaporation/DMA transfer model over a wide range of conditions suggests that both the thermodynamic component (activity coefficients and equilibrium growth factors) and kinetic component (resistance to mass transfer and accommodation coefficient) are well understood. Therefore, the model can be used to extrapolate the measurement results to estimate the kinetics of hypothetical GLY systems. For example, the time required to evaporate a GLY particle (Dpd = 350 nm) to half its mass at room temperature and SGLY = 0 and SH2O = 0 and 0.995 is ∼3 and 200 s, respectively. At human body temperature (37°C), these times decrease to 0.5 and 33 s, respectively. Contrasting the lifetimes under dry and humidified conditions highlights the importance for understanding the suppression of the evaporation of GLY due to hygroscopic growth in the bronchial tract.
Propylene glycol aerosol was generated in the same manner as GLY aerosol and measured using the TDMA system. No particles were detected due to total particle evaporation either at the particle generation source or within the size selection subsystems. The saturation vapor pressure for PG is approximately four orders of magnitude higher than that of GLY (see the SI). In order to ensure that there is not significant loss of PG prior to size selection, the vapor pressure would need to be reduced to that of GLY's vapor pressure at ∼10°C, which would necessitate a particle generation source operating at ∼−60°C. The high saturation vapor pressure of PG highlights the limitations of the experimental method, specifically in aerosol generation.
Nevertheless, the model framework can be applied to estimate the evaporation kinetics of hypothetical PG/H2O systems if an accommodation coefficient of is assumed (see the SI). This is likely a reasonable assumption based on the GLY experiments and the
for other organic compounds (Julin et al. Citation2014). For example, the time required to evaporate a PG particle (Dpd = 350 nm) to half its mass at room temperature and SPG = 0 and SH2O = 0 and 0.995 is ∼1.5 and 800 ms at room temperature and 0.5 and 45 ms at human body temperature.
In actual evolving electronic cigarette smoke plumes the GLY and/or PG saturation ratio will initially exceed zero. First, the aerosol must have initially condensed from supersaturated GLY/PG vapor. As it is diluted with ambient air, evaporation of the cloud will supply additional vapor, thus maintaining 0 < SPG and SGLY < 1. At SH2O = 0, the aerosol will continue to evaporate at a rate governed by SPG and SGLY. If that plume is then humidified, the vapor pressure of GLY and PG are reduced and condensation of SPG and/or SGLY may occur. shows the water and GLY saturation ratios that lead to condensational growth due to GLY vapor deposition. Increasing the SH2O of the system decreases the GLY saturation ratio where growth is observed. The combination of SH2O and SGLY leading to growth is strongly temperature dependent.
Figure 9. Modeled lines for growth factor equal unity at different saturation ratios. At a given temperature, condensational growth occurs when the saturation ratios of both water and GLY are above the designated line. Unlabeled intermediate lines are for 10, 20, and 30°C.
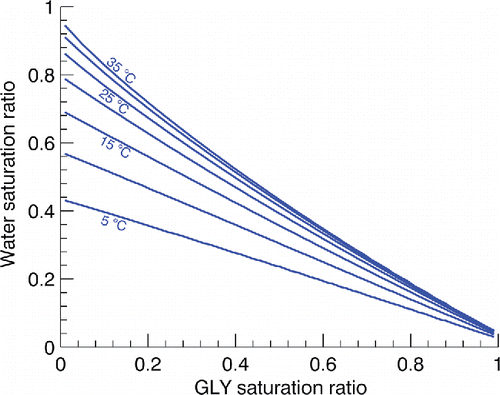
illustrates how condensational growth may occur in a plume that is sub-saturated with respect to all pure components in the vapor phase and how that effect depends on temperature. The co-condensation effect may help explain how extremely volatile vapors, such as PG, are sufficiently stable to be used in electronic cigarettes. also highlights the complex evaporation/condensation dynamics that may ensue between the electronic cigarette condenser, the smoke evolution in the bronchial tract and lung, and the evaporation and dispersion of the exhalant plume. Along this thermodynamic trajectory the aerosol is expected to undergo alternating condensational growth and evaporation while chemical composition and water content continuously adjust. Although the experimental and modeling work presented here suggests that the fundamental kinetics and thermodynamic equilibrium states of GLY aerosol are well understood, an e-cigarette plume will consist of not only GLY, but PG, water, and other constituents (e.g., nicotine), which can alter the dynamics of the aerosol. Complete understanding the e-cigarette plume dynamics and compositional changes of the aerosol will require a detailed understanding of GLY and/or PG and H2O vapor fields at high spatial and temporal resolution.
Conclusion
The model presented in Equations (1) and parameters in Table S1 accurately describes the evaporation and hygroscopic growth of submicron GLY particles at various water saturation ratios and temperature conditions. The model was validated against experiments using a TDMA experimental setup by accounting for particle evaporation solely within the scanning DMA. Evaporation and hygroscopic growth measurements were produced for moderately volatile GLY aerosol. Key findings are that the mass accommodation coefficient of GLY vapor on GLY aerosol is ∼0.8 and modeling demonstrated that, at the conditions measured, the particle should be able to reach equilibrium with H2O vapor with the surrounding environment in 100 μs or less. The modeled times required to evaporate a 350 nm diameter GLY particle to half its mass for SGLY = 0 and SH2O = 0 and 0.995 are ∼3 and 200 s at room temperature and 0.5 and 33 s at body temperature. Similarly, modeled times required to evaporate a 350 nm PG particle to half its mass for SPG = 0 and SH2O = 0 and 0.995 are ∼1.5 and 800 ms at room temperature and 0.5 and 45 ms at body temperature. Coupled hygroscopic growth/evaporation measurements demonstrated that the presence of water vapor significantly suppresses evaporation rates. This behavior occurs due to the mutual depression of vapor pressure of binary mixtures. One consequence of the mutual vapor pressure depression is that condensation may occur under conditions where GLY/PG and H2O are subsaturated with respect to the pure component. Detailed understanding of GLY and/or PG and H2O vapor fields at high spatial and temporal resolution will be required to model the plume dynamics and compositional changes of the electronic cigarette aerosol as it evolves during transport from the condenser through the bronchial tract and along the exhalant plume.
UAST_1245405_Supplementary_File.zip
Download Zip (388.3 KB)Acknowledgments
We thank Darrel Baumgardner and Patrick Chuang for use of the RDMA and HF-DMA, respectively.
Funding
This work was funded by R. J. Reynolds Tobacco Company.
Related Research Data
References
- AIHA (2014). White Paper: Electronic Cigarettes in the Indoor Environment. AIHA: American Industrial Hygene Association, Falls Church, VA.
- Alderman, S. L., Song, C., Moldoveanu, S. C., and Cole, S. K. (2015). Particle Size Distribution of E-Cigarette Aerosols and the Relationship to Cambridge Filter Pad Collection Efficiency. Beiträge zur Tab. / Contrib. to Tob. Res., 26(4):183–190.
- ASTM International. (1990). Standard Practice for Maintaining Constant Relative Humidity by Means of Aqueous Glycerin Solutions. ASTM Standard D5032. doi:10.1520/D5032-11.
- Berg, O. H., Swietlicki, E., and Krejci, R. (1998). Hygroscopic Growth of Aerosol Particles in the Marine Boundary Layer Over the Pacific and Southern Oceans During the First Aerosol Characterization Experiment (ACE 1). J. Geophys. Res. Atmos., 103(D13):16535–16545, doi:10.1029/97JD02851.
- Bertholon, J.-F., Becquemin, M. H., Roy, M., Roy, F., Ledur, D., Annesi Maesano, I., and Dautzenberg, B. (2013). Comparaison de L’aérosol de la Cigarette Électronique à Celui des Cigarettes Ordinaires et de la Chicha [Comparison of the Aerosol Produced by Electronic Cigarettes with Conventional Cigarettes and the Shisha]. Rev. Mal. Respir., 30(9):752–757, doi:10.1016/j.rmr.2013.03.003.
- Bilde, M., Svenningsson, B., Mønster, J., and Rosenørn, T. (2003). Even−Odd Alternation of Evaporation Rates and Vapor Pressures of C3−C9 Dicarboxylic Acid Aerosols. Environ. Sci. Technol., 37(7):1371–1378, doi:10.1021/es0201810.
- Bilde, M., Barsanti, K., Booth, M., Cappa, C. D., Donahue, N. M., Emanuelsson, E. U., McFiggans, G., Krieger, U. K., Marcolli, C., Topping, D., Ziemann, P., Barley, M., Clegg, S., Dennis-Smither, B., Hallquist, M., Hallquist, Å. M., Khlystov, A., Kulmala, M., Mogensen, D., Percival, C. J., Pope, F., Reid, J. P., Ribeiro Da Silva, M., Rosenoern, T., Salo, K., Soonsin, V. P., Yli-Juuti, T., Prisle, N. L., Pagels, J., Rarey, J., Zardini, A. A., and Riipinen, I. (2015). Saturation Vapor Pressures and Transition Enthalpies of Low-Volatility Organic Molecules of Atmospheric Relevance: From Dicarboxylic Acids to Complex Mixtures. Chem. Rev., 115(10):4115–4156, doi:10.1021/cr5005502.
- Bird, R. B., Stewart, W. E., and Lightfoot, E. N. (2002). Transport Phenomena. 2nd ed. John Wiley & Sons, Inc., New York.
- Biskos, G., Paulsen, D., Russell, L. M., Buseck, P. R., and Martin, S. T. (2006). Prompt Deliquescence and Efflorescence of Aerosol Nanoparticles. Atmos. Chem. Phys., 6(12):4633–4642, doi:10.5194/acp-6-4633-2006.
- Booth, A. M., Barley, M. H., Topping, D. O., McFiggans, G., Garforth, A., and Percival, C. J. (2010). Solid State and Sub-Cooled Liquid Vapour Pressures of Substituted Dicarboxylic Acids using KNUDSEN EFFUSION Mass Spectrometry (KEMS) and Differential Scanning Calorimetry. Atmos. Chem. Phys., 10(10):4879–4892, doi:10.5194/acp-10-4879-2010.
- Chang, Z. H., and Baust, J. G. (1991). Physical Aging of Glassy State: DSC Study of Vitrified Glycerol Systems. Cryobiology, 28(1):87–95, doi:10.1016/0011-2240(91)90010-L.
- Chemical Engineering and Materials Research Information Center (CHERIC) (2015). Queriable Database. Available at http://www.cheric.org/.
- Christensen, S. I., and Petters, M. D. (2012). The Role of Temperature in Cloud Droplet Activation. J. Phys. Chem. A., 116(39):9706–9717, doi:10.1021/jp3064454.
- Davies, J. F., Haddrell, A. E., and Reid, J. P. (2012). Time-Resolved Measurements of the Evaporation of Volatile Components from Single Aerosol Droplets. Aerosol Sci. Technol., 46(6):666–677, doi:10.1080/02786826.2011.652750.
- Dick, W. D., Saxena, P., and McMurry, P. H. (2000). Estimation of Water Uptake by Organic Compounds in Submicron Aerosols Measured During the Southeastern Aerosol and Visibility Study. J. Geophys. Res. Atmos., 105(D1):1471–1479, doi:10.1029/1999JD901001.
- Forney, C. F., and Brandl, D. G. (1992). Control of humidity in small controlled environment chambers using glycerol-water solutions. Horttechnology, 2(1):52–54.
- Fuchs, N. A., and Sutugin, A. G. (1971). High-Dispersed Aerosols, Topics in Current Aerosol Research Vol. 2, G. N. Hidy and J. R. Brock, ed., Pergamon Press, New York.
- Fuoco, F. C., Buonanno, G., Stabile, L., and Vigo, P. (2014). Influential Parameters on Particle Concentration and Size Distribution in the Mainstream of E-Cigarettes. Environ. Pollut., 184:523–529, doi:10.1016/j.envpol.2013.10.010.
- Glycerine Producers Association (1963). Physical Properties of Glycerine and its Solutions. Glycerine Producers’ Association, New York, NY.
- Hemings, E. B., Cavallotti, C., Cuoci, A., Faravelli, T., and Ranzi, E. (2012). A Detailed Kinetic Study of Pyrolysis and Oxidation of Glycerol (Propane-1,2,3-triol). Combust. Sci. Technol., 184(7-8):1164–1178, doi:10.1080/00102202.2012.664006.
- Ingebrethsen, B. J., Cole, S. K., and Alderman, S. L. (2012). Electronic Cigarette Aerosol Particle Size Distribution Measurements. Inhal. Toxicol., 24(14):976–984, doi:10.3109/08958378.2012.744781.
- Julin, J., Winkler, P. M., Donahue, N. M., Wagner, P. E., and Riipinen, I. (2014). Near-Unity Mass Accommodation Coefficient of Organic Molecules of Varying Structure. Environ. Sci. Technol., 48(20):12083–12089, doi:10.1021/es501816h.
- Knutson, E. O., and Whitby, K. T. (1975). Aerosol Classification by Electric Mobility: Apparatus, Theory, and Applications, J. Aerosol Sci., 6(6):443–451, doi:10.1016/0021-8502(75)90060-9.
- Koop, T., Luo, B., Tsias, A., and Peter, T. (2000). Water Activity as the Determinant for Homogeneous Ice Nucleation in Aqueous Solutions. Nature, 406(6796):611–614, doi:10.1038/35020537.
- Kosmider, L., Sobczak, A., Fik, M., Knysak, J., Zaciera, M., Kurek, J., and Goniewicz, M. L. (2014). Carbonyl Compounds in Electronic Cigarette Vapors: Effects of Nicotine Solvent and Battery Output Voltage. Nicotine Tob. Res., 16(10):1319–1326, doi:10.1093/ntr/ntu078.
- Lane, L. B. (1925). Freezing Points of Glycerol and Its Aqueous Solutions. Ind. Eng. Chem., 17(9):924–924, doi:10.1021/ie50189a017.
- Lewis, Da., Young, P. M., Buttini, F., Church, T., Colombo, P., Forbes, B., Haghi, M., Johnson, R., O'Shea, H., Salama, R., and Traini, D. (2014). Towards the Bioequivalence of Pressurised Metered Dose Inhalers 1: Design and Characterisation of Aerodynamically Equivalent Beclomethasone Dipropionate Inhalers with and Without Glycerol as a Non-Volatile Excipient. Eur. J. Pharm. Biopharm., 86(1):31–37, doi:10.1016/j.ejpb.2013.02.014.
- Liu, B., and Pui, D. (1977). On Unipolar Diffusion Charging of Aerosols in the Continuum Regime. J. Colloid. Interf. Sci., 58:142–149.
- Liu, B. Y. H., Pui, D. Y. H., Whitby, K. T., Kittelson, D. B., Kousaka, Y., and McKenzie, R. L. (1978). The aerosol mobility chromatograph: A new detector for sulfuric acid aerosols. Atmos. Environ., 12(1–3):99–104.
- Liu, B. Y., and Lee, K. W. (1975). An Aerosol Generator of High Stability. Am. Ind. Hyg. Assoc. J., 36(12):861–865, doi:10.1080/0002889758507357.
- McMurry, P. (2000). A Review of Atmospheric Aerosol Measurements. Atmos. Environ., 34(12–14):1959–1999, doi:10.1016/S1352-2310(99)00455-0.
- McMurry, P. H., and Stolzenburg, M. R. (1989). On the Sensitivity of Particle Size to Relative Humidity for Los Angeles Aerosols. Atmos. Environ., 23(2):497–507, doi:10.1016/0004-6981(89)90593-3.
- Mikhailov, E., Vlasenko, S., Martin, S. T., Koop, T., and Pöschl, U. (2009). Amorphous and Crystalline Aerosol Particles Interacting with Water Vapor: Conceptual Framework and Experimental Evidence for Restructuring, Phase Transitions and Kinetic Limitations. Atmos. Chem. Phys., 9(24):9491–9522, doi:10.5194/acp-9-9491-2009.
- Miyajima, K., Sawada, M., and Nakagaki, M. (1983). Free Energy, Enthalpy, and Entropy Changes of Mixing of Aqueous Solutions of D-Glucose and Tetraalkylammonium Bromide at 25.DEG.C. Bull. Chem. Soc. Jpn., 56(10):2905–2911, doi:10.1246/bcsj.56.2905.
- Neilson, L., Mankus, C., Thorne, D., Jackson, G., Debay, J., and Meredith, C. (2015). Development of an in Vitro Cytotoxicity Model for Aerosol Exposure Using 3D Reconstructed Human Airway Tissue ; Application for Assessment of E-Cigarette Aerosol. Toxicol. Vitr., 29(7):1952–1962, doi:10.1016/j.tiv.2015.05.018.
- Nguyen, T. K. V., Petters, M. D., Suda, S. R., and Carlton, A. G. (2014). Trends in Particle Phase Liquid Water During the Southern Oxidant and Aerosol Study. Atmos. Chem. Phys. Discuss., 14(6):7469–7516, doi:10.5194/acpd-14-7469-2014.
- Pellegrino, R. M., Tinghino, B., Mangiaracina, G., Marani, A., Vitali, M., Protano, C., Osborn, J. F., and Cattaruzza, M. S. (2012). Electronic Cigarettes: An Evaluation of Exposure to Chemicals and Fine Particulate Matter (PM). Ann. Ig., 24(4):279–288.
- Petters, S. S., and Petters, M. D. (2016). Surfactant Effect on Cloud Condensation Nuclei for Two-Component Internally Mixed Aerosols. J. Geophys. Res. Atmos., 121(4):1878–1895, doi:10.1002/2015JD024090.
- Pisinger, C., and Døssing, M. (2014). A Systematic Review of Health Effects of Electronic Cigarettes. Prev. Med. (Baltim)., 69:248–260, doi:10.1016/j.ypmed.2014.10.009.
- Rader, D. J., McMurry, P. H., and Smith, S. (1987). Evaporation Rates of Monodisperse Organic Aerosols in the 0.02- to 0.2-μm-Diameter Range. Aerosol Sci. Technol., 6:247–260, doi:10.1080/02786828708959137.
- Rothfuss, N. E., and Petters, M. D. (2016). Coalescence-Based Assessment of Aerosol Phase State Using Dimers Prepared Through a Dual-Differential Mobility Analyzer Technique. Aerosol Sci. Technol., 6826(August), 1–12, doi:10.1080/02786826.2016.1221050.
- Schober, W., Szendrei, K., Matzen, W., Osiander-Fuchs, H., Heitmann, D., Schettgen, T., Jörres, R. A., and Fromme, H. (2014). Use of Electronic Cigarettes (E-Cigarettes) Impairs Indoor Air Quality and Increases FeNO Levels of E-Cigarette Consumers. Int. J. Hyg. Environ. Health., 217(6):628–637, doi:10.1016/j.ijheh.2013.11.003.
- Schripp, T., Markewitz, D., Uhde, E., and Salthammer, T. (2013). Does E-Cigarette Consumption Cause Passive Vaping?. Indoor Air., 23(1):25–31, doi:10.1111/j.1600-0668.2012.00792.x.
- Snider, J. R., Petters, M. D., Wechsler, P., and Liu, P. S. K. (2006). Supersaturation in the Wyoming CCN Instrument. J. Atmos. Ocean. Technol., 23(10):1323–1339, doi:10.1175/JTECH1916.1.
- Soonsin, V., Zardini, A. A., Marcolli, C., Zuend, A., and Krieger, U. K. (2010). The Vapor Pressures and Activities of Dicarboxylic Acids Reconsidered: The Impact of the Physical State of the Aerosol. Atmos. Chem. Phys., 10(23):11753–11767, doi:10.5194/acp-10-11753-2010.
- Stolzenburg, M., Kreisberg, N., and Hering, S. (1998), Atmospheric Size Distributions Measured by Differential Mobility Optical Particle Size Spectrometry. Aerosol Sci. Technol., 29(5):402–418, doi:10.1080/02786829808965579.
- Stull, D. R. (1947). Vapor Pressure of Pure Substances. Organic and Inorganic Compounds. Ind. Eng. Chem., 39(4):517–540.
- Suda, S. R., and Petters, M. D. (2013). Accurate Determination of Aerosol Activity Coefficients at Relative Humidities up to 99% Using the Hygroscopicity Tandem Differential Mobility Analyzer Technique. Aerosol Sci. Technol., 47(9):991–1000, doi:10.1080/02786826.2013.807906.
- Swietlicki, E., Hansson, H., Hämeri, K., Svenningsson, B., Massling, A., McFiggans, G., Mcmurry, P. H., Petäjä, T., Tunved, P., Gysel, M., Topping, D., Weingartner, E., Baltensperger, U., Rissler, J., Wiedensohler, A., and Kulmala, M. (2008). Hygroscopic Properties of Submicrometer Atmospheric Aerosol Particles Measured with H-TDMA Instruments in Various Environments—A Review, Tellus B, doi:10.1111/j.1600-0889.2008.00350.x.
- Tao, Y., and McMurry, P. H. (1989). Vapor Pressures and Surface Free Energies of C14-C18 Monocarboxylic Acids and C5 and C6 Dicarboxylic Acids. Environ. Sci. Technol., 23(12):1519–1523, doi:10.1021/es00070a011.
- Topping, D., Connolly, P., and McFiggans, G. (2013). Cloud Droplet Number Enhanced by Co-Condensation of Organic Vapours. Nat. Geosci., 6(6):443–446, doi:10.1038/ngeo1809.
- Trauth, M. H. (2007). MATLAB Recipes for Earth Sciences. 2nd ed. Springer, Berlin.
- Trtchounian, A., Williams, M., and Talbot, P. (2010). Conventional and Electronic Cigarettes (E-Cigarettes) Have Different Smoking Characteristics. Nicotine Tob. Res., 12(9):905–912, doi:10.1093/ntr/ntq114.
- Wang, S. C., and Flagan, R. C. (1990). Scanning Electrical Mobility Spectrometer. Aerosol Sci. Technol., 13(2):230–240, doi:10.1080/02786829008959441.
- Wiedensohler, A. (1988). An Approximation of the Bipolar Charge Distribution for Particles in the Submicron Size Range. J. Aerosol Sci., 19(3):387–389, doi:10.1016/0021-8502(88)90278-9.
- Wiedensohler, A., Birmili, W., Nowak, A., Sonntag, A., Weinhold, K., Merkel, M., Wehner, B., Tuch, T., Pfeifer, S., Fiebig, M., Fjäraa, A. M., Asmi, E., Sellegri, K., Depuy, R., Venzac, H., Villani, P., Laj, P., Aalto, P., Ogren, J. A., Swietlicki, E., Williams, P., Roldin, P., Quincey, P., Hüglin, C., Fierz-Schmidhauser, R., Gysel, M., Weingartner, E., Riccobono, F., Santos, S., Grüning, C., Faloon, K., Beddows, D., Harrison, R., Monahan, C., Jennings, S. G., O'Dowd, C. D., Marinoni, A., Horn, H.-G., Keck, L., Jiang, J., Scheckman, J., McMurry, P. H., Deng, Z., Zhao, C. S., Moerman, M., Henzing, B., de Leeuw, G., Löschau, G., and Bastian, S. (2012). Mobility Particle Size Spectrometers: Harmonization of Technical Standards and Data Structure to Facilitate High Quality Long-Term Observations of Atmospheric Particle Number Size Distributions. Atmos. Meas. Tech., 5(3):657–685, doi:10.5194/amt-5-657-2012.
- Wilkes, J. O. (2005). Fluid Mechanics for Chemical Engineers with Microfluidics and CFD. 2nd ed. Prentice Hall, Upper Saddle River, New Jersey.
- Xue, H., Moyle, A. M., Magee, N., Harrington, J. Y., and Lamb, D. (2005), Experimental Studies of Droplet Evaporation Kinetics: Validation of Models for Binary and Ternary Aqueous Solutions. J. Atmos. Sci., 62(12):4310–4326, doi:10.1175/JAS3623.1.
- Zamora, I. R., Tabazadeh, A., Golden, D. M., and Jacobson, M. Z. (2011). Hygroscopic Growth of Common Organic Aerosol Solutes, Including Humic Substances, as Derived From Water Activity Measurements. J. Geophys. Res. Atmos., 116(D23):n/a–n/a, doi:10.1029/2011JD016067.
- Zhang, S.-H., Akutsu, Y., Russell, L. M., Flagan, R. C., and Seinfeld, J. H. (1995). Radial Differential Mobility Analyzer. Aerosol Sci. Technol., 23(3):357–372, doi:10.1080/02786829508965320.
- Zhang, S.-H., Seinfeld, J. H., and Flagan, R. C. (1993). Determination of Particle Vapor Pressures Using the Tandem Differential Mobility Analyzer. Aerosol Sci. Technol., 19(1):3–14, doi:10.1080/02786829308959616.