ABSTRACT
To assess indoor bioaerosols, a virtual impactor having 1 µm cutoff diameter was designed, fabricated, and evaluated with computational fluid dynamics simulation and also with laboratory test using polystyrene latex particles. Two other cutoff diameters of 635 nm and 1.5 µm were obtained by changing the inlet flow rate and the ratio of minor channel-to-inlet flow rates. In field test, the virtual impactor was operated with varying cutoff diameter and field-emission scanning electron microscope (FE-SEM) analysis was performed for each cutoff diameter to observe morphologies of indoor aerosol particles sampled at the major and minor outlet channels. Particles were sampled at both outlet channels using the SKC Button Aerosol sampler and subsequently cultured. By colony counting, it was found that 56% of cultured fungal particles and 63% of cultured bacterial particles had aerodynamic sizes smaller than 1 µm. MALDI-TOF analysis and visual inspection of culture samples were used to identify indoor bacterial and fungal species, respectively. Nearly same species of bacteria and fungi were detected both in the major and minor flow channels.
© 2017 American Association for Aerosol Research
EDITOR:
1. Introduction
Studies regarding human exposure to air pollutants reveal that indoor levels of pollutants may be 2–5 times higher than outdoor levels. On an average, people spend approximately 90% of their time indoors (EPA Citation1995). Hence, for many people (especially infants), the health risks may be greater from the exposure to indoor rather than outdoor air pollution. Exposure to airborne microorganisms (bioaerosols) may cause respiratory distress or induce other adverse health effects such as hypersensitivity pneumonitis, toxic reaction, and acute respiratory infection.
The time interval in which microorganisms are airborne must be long enough to give them opportunity to be inhaled. In real situations when the air undergoes permanent turbulences, this factor can be characterized by the so-called “half-life.”The sedimentation velocity of bioaerosols is dependent on the square of particle diameter, according to the Stokes' law. In the human respiratory tract, the penetration depth and deposition of microorganisms depend on their properties such as size, shape, density, electrical charge, chemical composition, and reactivity. Besides, the physiological factors such as airflow rate and breathing patterns influence the deposition mechanism as well.
In the upper region of the respiratory tract (from nostrils to larynx), particle deposition depends on the square of particle aerodynamic diameter (Tsuda Citation2013). Therefore by increasing particle diameter, the majority of micron-sized particles are deposited in the nasal passage (Guha Citation2008). However, in the lower tract such as alveolar, submicron particles which have very long suspension times because of their low inertia and size ranges can deeply penetrate into the lower respiratory tract and deposit (Tsuda et al. Citation2013; Górny Citation2004). Seo et al. (Citation2014), using the NIOSH two-stage sampler (Lindsley et al. Citation2006), have reported that submicron-sized fungal fragments are significantly higher in the homes of asthmatic children than those in non-asthmatic children.
Virtual impactors are usually employed to collect and classify aerosol particles due to their aerodynamic diameters. The general mechanism involves separating aerosol particles into a straight low-velocity flow (minor flow channel) and a perpendicular high-velocity flow (major flow channel). High-inertia particles are unable to navigate the turn into the major flow channel and thus, are concentrated in the minor flow channel, whereas finer particles can make an almost 90° turn and enter the major flow channel.
Although indoor field tests were widely carried out, quantifying and identifying submicron bacteria and fungi simultaneously and comparing them with bacteria and fungi coarser sizes were little studied. In this study, a virtual impactor was designed and fabricated. By changing the inlet flow rate and the ratio of minor channel-to-inlet flow rates, three cutoff diameters of 635 nm, 1 µm, and 1.5 µm were used to measure size-dependent concentrations of indoor bioaerosols. The effect of cutoff diameter change on particle concentrations at minor and major outlets of the virtual impactor was evaluated with computational fluid dynamics simulation using ANSYS FLUENT and also with laboratory test using polystyrene latex (PSL) particles. To observe morphology of indoor aerosols by field emission scanning electron microscopy (FE-SEM), a laboratory-made electrostatic sampler was positioned at the outlets of the virtual impactor to sample indoor aerosols over a silicon wafer plate for analysis. Using both the virtual impactor and the SKC Button Aerosol Sampler, indoor airborne bacterial and fungal particles were classified and quantified. Finally, airborne bacterial diversity in an office building in Seoul, South Korea was investigated by analyzing bacterial colonies using the Biotyper 3.0 matrix-assisted laser-desorption ionization time of flight (MALDI-TOF) mass spectrometry (MS) system. In assessment of fungal species, cultured samples were visually inspected.
2. Material and methods
2.1. Design and fabrication of a virtual impactor
Our single-nozzle, single-stage virtual impactor was designed on the basis of procedure described by Ding and Koutrakias (Citation2000). By changing inlet flow rate and the ratio of minor channel-to-inlet flow rates, three cutoff diameters of 635 nm, 1 µm, and 1.5 µm were obtained. Details of design process are provided in the online supplementary information (SI).
2.2. Performance test of the virtual impactor using PSL particles
The performance test was carried out at laboratory using PSL particles (density = 1.054 ) with diameters of 0.3, 0.5, 0.8, 1.0, 1.5, 2.0, and 2.5
m. The effect of cutoff diameter change on particle concentrations at minor and major outlets was evaluated. To obtain the fraction of particles entering the minor flow channel, particle size distributions at the inlet and two exits of the virtual impactor were measured using both an aerodynamic particle sizer (APS; TSI model 3321, Shoreview, MN, USA) and a scanning mobility particle sizer (SMPS; TSI model 3936). The APS was used to measure the aerodynamic diameters of particles, with diameters ranging from 0.5 to 20 µm. The SMPS was used to measure the electrical mobility diameter of particles between 14 and 600 nm. The electrical mobility diameter (
) can be converted to an aerodynamic diameter (
) using the following equation (Ding and Koutrakias, Citation2000).
[1] where
(
) and
(
are the Cunningham slip correction factors corresponding to
and
, respectively. The fraction of particles entering the minor flow channel for a given particle size (
) was obtained using the following equation.
[2] where
,
, and
represent the flow rates of inlet, minor, and major flow channels, respectively. The concentration of particles was measured at the exits of the minor flow channel (
) and major flow channel (
). Details are provided in the SI.
2.3. Performance test of the virtual impactor using CFD
The effect of cutoff diameter change on particle concentrations at minor and major outlets was also evaluated using computational fluid dynamics (CFD) simulation. After calculating the flow field, the discrete phase model (DPM) with the Lagrangian approach was applied to simulate particle trajectories. The trajectories of particles ranging from 0.3 to 3.0 in diameter were investigated. The fraction of particles entering the minor flow channel was then calculated for each particle size, according to the number of particles passing through the minor flow channel (
and the total number of particles passing through the minor
and major flow channels (
), as follows:
[3]
2.4. Size and morphology of indoor aerosols
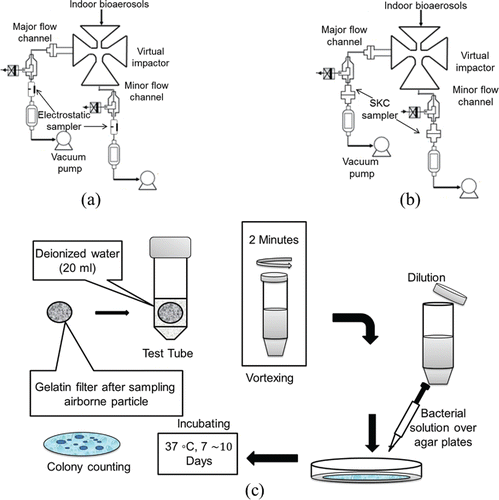
To analyze morphology of indoor aerosols, a laboratory-made pin-to-plate electrostatic sampler was positioned at the outlets of the virtual impactor. The experimental setup is shown in . The sampler comprised a discharge needle and a circular ground electrode. The applied voltage between the needle and the ground electrode to generate air ions by corona discharge was 4.5 kV. The aerosol particles were charged using the air ions and precipitated onto a silicon wafer, which was located right above the ground electrode. The air flow rate was 0.5 LPM, and the sampling time was 15 min. FE-SEM (6701F, JEOL Ltd, Akishima, Tokyo, Japan) was used to observe the morphology of the sampled particles.
2.5. Sampling and culturing of indoor bioaerosols
Another sampler (SKC Button Aerosol Sampler) was used to measure the concentration of culturable microorganisms in the air. A Sartorius gelatin filter with 3-μm pore size and 25 mm diameter (obtained from SKC Inc.,Eighty Four, PA, USA) was used with the SKC Button Aerosol Sampler, which was operated at a flow rate of 4 LPM. This sampler has a convex, multiporous inlet. The conductive stainless steel inlet reduces the electrostatic effects and contains evenly spaced holes (pore size = 178 μm) that act as sampling orifices for multidirectional sampling with low sensitivity to wind direction and velocity (Lee et al. Citation2006).
Two SKC samplers were connected to the minor and major flow channels, respectively (). Air sampling was conducted at 20-min intervals and repeated three times. Each filter was removed from the sampler immediately after sampling and soaked in a test tube containing 20 mL deionized water. Sampled particles in the deionized water were vortexed for 2 min using a vortex machine (Vortex-Fisher Scientific Inc., Pittsburgh, PA, USA). Two milliliters of the extraction fluid were then poured in a new test tube containing 20 mL deionized water (dilution ratio = 10:1). For bacteria, the diluted extraction fluids were cultured on three distinct tryptic soy agar (TSA) (Difco Laboratories, Detroit, MI, USA) plates and incubated at 37°C for 7 days. For fungal particles, the fluids were cultured on three malt extract agar (MEA) (Difco Laboratories, MI, USA) plates and incubated at room temperature for 10 days. A schematic of the culturing process is shown in .
The colonies on each plate were then counted. The number of colonies in the original extraction fluid for one filter (colony-forming unit, CFU) was calculated as:[4] where
is the average number of CFUs on the agar plates of replicate experiments, DR is the dilution ratio,
is the extraction fluid volume (20 mL), and
is the volume of the dilution applied to the plate (2 mL).
2.6. MALDI-TOF analysis
In this study, matrix-assisted laser-desorption ionization time of flight (MALDI-TOF) mass spectrometry (MS) was used for identifying indoor airborne bacteria. Fykse et al. (Citation2015) used MALDI-TOF to identify indoor airborne bacteria, and Dybwad et al. (Citation2012, Citation2014) investigated temporal variability of bacteria species in a subway station in Norway. Before MALDI-TOF analysis, colonies were picked with a toothpick and smeared on a steel target plate. After drying the smear, the colonies were overlaid with 1 µL of 70% formic acid and left to dry at room temperature. These dried colonies were then covered with 1 µL of -cyano-4-hydroxycinnamic acid in 50% acetonitrile with 2.5% trifluoroacetic acid, and again dried at room temperature.
All analyses were conducted using an Autoflex III mass spectrometer (Bruker Daltonics, Germany) with the Biotyper 3.0 software and database containing 4,613 entries. Before each measurement, the mass spectrometer was calibrated using the Bruker Bacterial Test Standard, according to the manufacturer's recommendation. MALDI-TOF analysis is based on the linear positive mode of the mass spectra in the range of 2000–20,000 Da. The spectra are compared with a reference database (Bruker Taxonomy, Bremen, Germany) by the MALDI Biotyper 3.0 system, and species are identified by the bacteria's fingerprint. Identification criteria used in our analysis and formulated by the manufacturer were as follows: score value of <1.7, identification unreliable; score value of 1.7–2.0, probable genus identification; score value of 2.0–2.3, reliable genus identification, probable species identification; and score value of 2.3–3.0, highly probable species identification. In this study, only the genus with score values of >2.0 were reported.
3. Results and discussion
3.1. Performance test of the virtual impactor
shows the fraction of particles entering the minor flow channel of the virtual impactor for two different inlet flow rates and two different ratios of minor channel-to-inlet flow ratios. The experiments were carried out using PSL particles. Numerical calculation was performed using ANSYS Fluent. shows good agreement between the experimental data and numerically simulated results.
Figure 2. Experimental (Exp) and numerical (Num) results of the effects of inlet flow rate and minor-to-inlet flow ratio on the fraction of particles entering the minor flow channel.
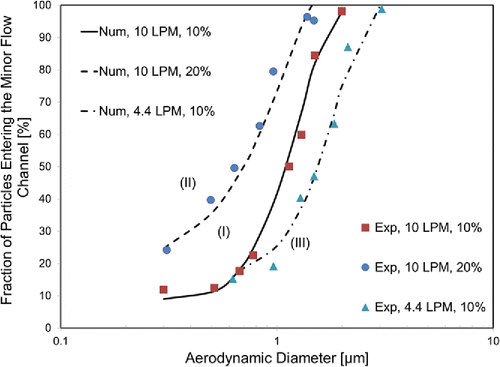
In the case I, the cutoff diameter was 1 µm with the inlet flow rate was 10 LPM and the minor-to-inlet flow ratio was 0.1. By increasing the ratio 0.1 to 0.2 (case II), the cutoff diameter decreased from 1 µm to 635 nm at the same inlet flow rate. By reducing the inlet flow rate from 10 LPM to 4.4 LPM (case III), the cutoff diameter increased from 1 µm to 1.5 µm. Details about the effects of the minor-to-inlet flow ratio and inlet flow rate on the cutoff diameter, and numerical simulation results are presented in the SI.
3.2. Size and morphology of indoor aerosols
To investigate and visualize the particle dispersion in the minor and major flow channels of the virtual impactor, FE-SEM analysis was performed. The results are shown in . Although photos of the minor flow channel show agglomerated and coarse particles, photos of the major flow channel show that most of the particles were single and small. With increasing cutoff diameter, increased particle sizes were observed in both the minor and major flow channels.
Figure 3. SEM photos of indoor aerosols with cutoff diameters of (a) 635 nm, (b) 1 µm, and (c) 1.5 µm.
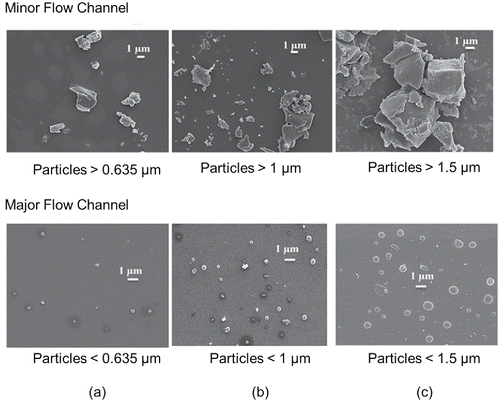
The results in imply that the fractions of particles entering the major flow channel for particles 1 µm in size were 50% and 80% at the cutoff diameters of 1 and 1.5 µm, respectively. Therefore, for sampling airborne particles smaller than 1 µm, the proper sampling location would be the major flow channel and the proper cutoff diameter would be 1.5 µm. The results in also show that the particles sampled at the major flow channel were single, not agglomerated, and that most were approximately 1 µm or smaller in size.
3.3. Sampling and culturing of indoor bioaerosols
It was expected that bacterial and fungal species were included in the indoor aerosols samples shown in . To differentiate indoor bioaerosols from total aerosols, additional experiments were conducted using the SKC sampler combined with the virtual impactor, as described in Section 2.5 (). The sampler was located at a height of approximately 1 m in the middle of the test space. The average total number concentration of the sampled bacteria and fungi particles in this study were 371 and 129
, respectively. It has been reported that the concentrations of indoor bioaerosol vary from 44 to 2912
for bacteria and from 10 to 3852
depending on place, season, and sampling methods (Balasubramanian et al. Citation2012; Mentese et al. 2012; Boneta et al. 2010; Tsai and Macher Citation2005; Gόrny and Dutkiewicz Citation2002; Law et al. Citation2001; Burge et al. Citation2000; Wan and Lee Citation1999).
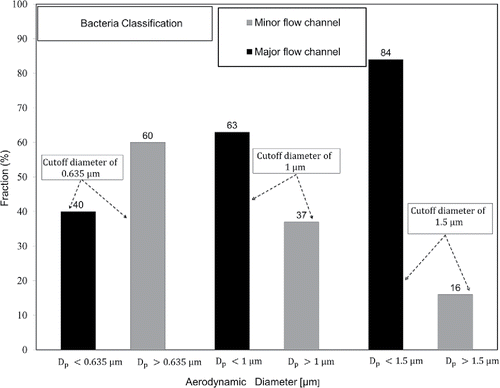
shows the fraction of bacterial particles included in the aerosol particles sampled at each outlet flow channel for three different cutoff diameters. In the figure, the fraction of sampled bacterial particles (n) was determined as:[5] where N is the number concentration of the sampled bacterial particles (
).
and
were calculated as:
[6] where Q is the sampling flow rate and
is the sampling time. The results of show that the fraction of bacteria sampled in the major flow channel increased from 40% to 63% to 84% by increasing the cutoff diameter from 0.635 to 1.0 to 1.5 µm, respectively. Careful interpretation of these results revealed that the fraction of bacteria included in sampled particles smaller than 0.635
, and the fraction of particles larger than 0.635
but smaller than 1
was 23%. The fraction of particles larger than 1
but smaller than 1.5
was 21% while the fraction of particles larger than 1.5
was 16%.
Figure 4. Fraction of bacteria sampled at minor and major flow channels for different cutoff diameters.
Utilizing MALDI-TOF, the species of cultured colonies were identified. shows that nearly the same species were found in both the major and minor flow channels and bacterial species of Micrococcus, Staphylococcus, and Methylbacterium were mostly detected in the tested indoor air environment. also shows that gram-positive bacteria were dominant in all samples. Previous studies have similarly demonstrated that gram-positive bacteria are the most common airborne bacteria found in indoor environments (Zhu et al. Citation2003; Aydogdu et al. Citation2010; Mentese et al. Citation2009). The relatively low presence of gram-negative bacteria in the air may reflect the short survival periods such bacteria have when in an airborne state. In contrast, gram-positive bacteria have a fairly harder and more protective cell envelope that may make them more fit for airborne survival.
Table 1. Predominant bacteria identified by MALDI-TOF analysis.
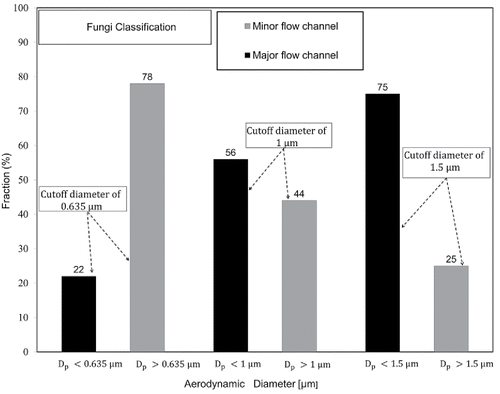
shows the fraction of fungal particles sampled in the major flow channel increased from 22% to 56% to 75% by increasing the cutoff diameter from 0.635 to 1.0 to 1.5 µm, respectively. The results of imply that the fraction of fungi included in particles smaller than 0.635. The fraction of particles larger than 0.635
but smaller than 1
was 34%. The fraction of particles between 1
and 1.5
was 19%, while that of particles larger than 1.5
was 25%. Afanou et al. (Citation2015) reported that the amount of fungal fragments larger than 1 µm was negligible compared to that of submicron sized fragments, even though there were fragments even larger than 3.5 µm. Therefore, in this study, fungi particles sampled in the major channels were most likely to be the fungal fragments originally suspended in the office air. Reponen et al. (Citation2007) also reported that that the concentration of fungal fragments in indoor field tests was much higher than that of fungal spores.
Figure 5. Fraction of fungi sampled at minor and major flow channels for different cutoff diameters.
Our finding with the virtual impactor and culture-based method that 56% was submicron-sized fungal particles among indoor fungal particles was somewhat different compared to other research which used Andersen impactor (Reponen Citation1995; Meklin et al. Citation2002). We think that there are two reasons. One is the difference between an impactor and a virtual impactor. In the Anderson impactor, the cutoff diameter of 6th stage is 0.65 µm. Therefore, it seems that most of particles smaller than this size would leave the impactor before they are sampled. However, by using our virtual impactor, it is possible to capture most of particles smaller than 1 µm with a SKC Button aerosol sampler in the major flow channel. The culture media could also be another reason. In the Anderson impactor, agar plate is used. Therefore, some of bioaerosols might be killed or lost their viability because of the stress caused by sampling process (Stewart et al. Citation1995). However, airborne particles separated by using our virtual impactor are sampled over a gelatin filter in the SKC Button aerosol sampler.
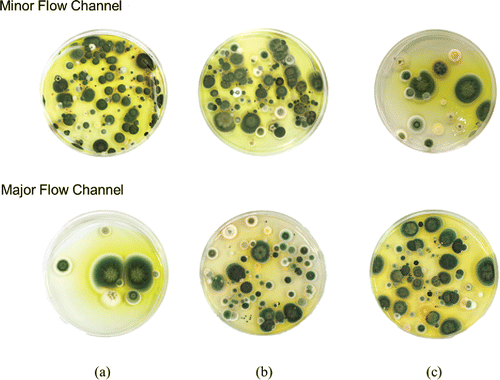
MALDI-TOF analysis was also conducted on fungal samples in an attempt to determine the identities of the fungal species; however, the results yielded score values below 1.7, indicating that such identification was unreliable. This could have potentially been due to a problem with our database that the MALDI-TOF device used; thus, we attempted to identify species using optical images of cultivated fungal colonies, as Górny and Ławniczek-Wałczyk (Citation2012) did. shows photos of cultivated fungal species over MEA plates. Four species of Cladosporium cladosporioides, Penicillium chrysogenum, Penicillium spp., and Aspergillus spp. were predominant in both minor and major flow channels for all cutoff diameters. Mentese et al. (Citation2009) and Bonetta et al. (Citation2010) conducted field test to detect species of bioaerosols in various indoor places by considering shape and color of colonies through microscope. They identified similar fungal species found in our study.
4. Conclusions
To assess submicron indoor bioaerosols, a virtual impactor having 1 µm cutoff diameter was designed, fabricated, and evaluated. Two other cutoff diameters of 635 nm and 1.5 µm were obtained by changing the inlet flow rate and the ratio of minor channel-to-inlet flow rates.
With colony counting analysis of the samples at the outlet of the virtual impactor, it was found that 56% of fungal particles and 63% of bacterial particles suspended in the work office had aerodynamic sizes smaller than 1 µm. MALDI-TOF and visual inspection of culture samples showed that nearly same species of bacteria and fungi were detected both at the minor and major outlet channels.
UAST_1246707_Supplementary_File.zip
Download Zip (326.4 KB)Acknowledgments
We thank Prof. Seong Hwan Kim (Department of Microbiology, Dankook University, South Korea) for helpful discussions on the identification of fungal species.
Funding
This research was supported by Bio Nano Health-Guard Research Center funded by the Ministry of Science, ICT & Future Planning (MSIP) of Korea as Global Frontier Project (HGUARD_2013M3A6B2078959), Basic Science Research Program through the National Research Foundation of Korea (NRF) funded by the Ministry of Science, ICT and future Planning (NRF-2015R1A2A1A01003890), and Korea Ministry of Environment (MOE) as the Technologies for Responding to Atmospheric Environment Policies Program.
References
- Afanou, K. A., Straumfors, A., Skogstad, A., Skaar, I., Hjeljord, L., Skare, Ø., and Eduard, W. (2015). Profile and Morphology of Fungal Aerosols Characterized by Field Emission Scanning Electron Microscopy (FESEM). Aerosol Sci. Technol., 49:423–435.
- Aydogdu, H., Asan, A., and Tatman Otkun, M. (2010). Indoor and Outdoor Airborne Bacteria in Child Day-Care Centers in Edirne City (Turkey), Seasonal Distribution and Influence of Meteorological Factors. Environ. Monit. Assess., 164:53–66.
- Balasubramanian, R., Nainar, P., and Rajasekar, A. (2012). Airborne Bacteria, Fungi, and Endotoxin Levels in Residential Microenvironments: A Case Study. Aerobiologia, 28:375–390.
- Bonetta, S., Bonetta, S., Mosso, S., Sampò, S., and Carraro, E. (2010). Assessment of Microbiological Indoor Air Quality in an Italian Office Building Equipped with an HVAC System. Environ. Monit. Assess., 161:473–483.
- Burge, H. A., Pierson, D. L., Groves, T. O., Strawn, K. F., and Mishra, S. K. (2000). Dynamics of Airborne Fungal Populations in a Large Office Building. Curr. Microbial., 40:10–16.
- Ding, Y., and Koutrakis, P. (2000). Development of a Dichotomous Slit Nozzle Virtual Impactor. J. Aerosol Sci., 31:1421–1431.
- Dybwad, M., Granum, P. E., Bruheim, P., and Blatny, J. M. (2012). Characterization of Airborne Bacteria at an Underground Subway Station. Appl. Enviro. Microb., 78:1917–1929.
- Dybwad, M., Skogan, G., and Blatny, J. M. (2014). Temporal Variability of the Bioaerosol Background at a Subway Station: Concentration Level, Size Distribution, and Diversity of Airborne Bacteria. Appl. Enviro. Microb., 80:257–270.
- Environmental Protection Agency (EPA). (1995). The Inside Story: A Guide to Indoor Air Quality. EPA Document # 402-K-93-007, April 1995 Available at http://www.nchh.org/Portals/0/Contents/EPA_Inside_Story_Guide_to_Air_Quality.pdf.
- Fykse, E. M., Tjärnhage, T., Humppi, T., Eggen, V. S., Ingebretsen, A., Skogan, G., and Dybwad, M. (2015). Identification of Airborne Bacteria by 16S rDNA Sequencing, MALDI-TOF MS and the MIDI Microbial Identification System. Aerobiologia, 31:271–281.
- Gόrny, R. L., and Dutkiewicz, J. (2002). Bacterial and Fungal Aerosols in Indoor Environment in Central and Eastern European Countries. Ann. Agric. Environ. Med., 9:17–23.
- Gόrny, R. L. (2004). Filamentous Microorganisms and Their Fragments in Indoor Air–A Review. Ann. Agric. Environ. Med., 11:185–197.
- Górny, R. L., and Ławniczek-Wałczyk, A. (2012). Effect of Two Aerosolization Methods on the Release of Fungal Propagules from a Contaminated Agar Surface. Ann. Agric. Environ. Med., 19:279–284.
- Guha, A. (2008). Transport and Deposition of Particles in Turbulent and Laminar Flow. Annual Review of Fluid Mechanics, 40:311–341.
- Lee, T., Grinshpun, S. A., Martuzevicius, D., Adhikari, A., Crawford, C. M., Luo, J., and Reponen, T. (2006). Relationship Between Indoor and Outdoor Bioaerosols Collected with a Button Inhalable Aerosol Sampler in Urban Homes. Indoor Air, 16:37–47.
- Lindsley, W. G., Schmechel, D., and Chen, B. T. (2006). A Two-Stage Cyclone Using Microcentrifuge Tubes for Personal Bioaerosol Sampling. J. Environ. Monitor., 8:1136–1142.
- Law, A. K., Chau, C. K., and Chan, G. Y. (2001). Characteristics of Bioaerosol Profile in Office Buildings in Hong Kong. Build. Environ., 36:527–541.
- Meklin, T., Reponen, T., Toivola, M., Koponen, V., Husman, T., Hyvärinen, A., and Nevalainen, A. (2002). Size Distributions of Airborne Microbes in Moisture Damaged and Reference School Buildings of Two Construction Types. Atmos. Environ., 36:6031–6039.
- Mentese, S., Arisoy, M., Rad, A. Y., and Güllü, G. (2009). Bacteria and Fungi Levels in Various Indoor and Outdoor Environments in Ankara, Turkey. Clean–Soil, Air, Water., 37:487–493.
- Reponen, T., Seo, S. C., Grimsley, F., Lee, T., Crawford, C., and Grinshpun, S. A. (2007). Fungal Fragments in Moldy Houses: A Field Study in Homes in New Orleans and Southern Ohio. Atmos. Environ., 41:8140–8149.
- Seo, S., Choung, J. T., Chen, B. T., Lindsley, W. G., and Kim, K. Y. (2014). The Level of Submicron Fungal Fragments in Homes with Asthmatic Children. Environ. Res., 131:71–76.
- Stewart, S. L., Grinshpun, S. A., Willeke, K., Terzieva, S., Ulevicius, V., and Donnelly, J. (1995). Effect of Impact Stress on Microbial Recovery on an Agar Surface. Appl. Environ. Microbiol., 61(4):1232–1239.
- Reponen, T. (1995). Aerodynamic Diameters and Respiratory Deposition Estimates of Viable Fungal Spores in Mold Problem Homes. Aerosol Sci. & Technol., 22:11–23.
- Tsai, F. C., and Macher, J. M. (2005). Concentrations of Airborne Culturable Bacteria in 100 Large US Office Buildings from the BASE Study. Indoor Air., 15:71–81.
- Tsuda, A., Henry, F. S., and Butler, J. P. (2013). Particle Transport and Deposition: Basic Physics of Particle Kinetics. Compr. Physiol., 3:1437–1471.
- Wan, G. H., and Li, C. S. (1999). Indoor Endotoxin and Glucan in Association with Airway Inflammation and Systemic Symptoms. Arch. Environ. Health., 54:172–179.
- Zhu, H., Phelan, P., Duan, T., Raupp, G., Fernando, H.S., and Che, F. (2003). Experimental study of indoor and outdoor airborne bacterial concentrations in Tempe, Arizona, USA. Aerobiologia, 19:201–211.

