
ABSTRACT
Many well-established models can be applied to calculate the filtration efficiencies. In these models the filtration velocity and challenging particle size are assumed to be known accurately. However, in realistic filtration tests, the filtration velocity has profiles dependent on the filter holder geometry and experimental conditions; the challenging particles have size distributions dependent on the instruments and operation conditions. These factors can potentially affect the measured filtration efficiency and lead to discrepancies with the models.
This study aims to develop an integrative model to predict the filtration efficiencies in realistic tests by incorporating the effects of the filtration velocity profile and challenging particle size distribution classified by a differential mobility analyzer (DMA) into the existing filtration models. Face velocity profile is modeled with fluid mechanics simulations; the initial generated particle size distribution, the particle charging status and the DMA transfer function are modeled to obtain the challenging particle size distribution. These results are then fed into the filtration models. Simulated results are compared with experimental ones to verify the model accuracy. This model can be used to reduce filtration test artifacts and to improve the experimental procedure.
The results reveal that the face velocity upstream the filter exhibits high degree of homogeneity not affecting the filtration efficiency if the filter pressure drop is not very low. The generated particle size distribution and the DMA selection size window could influence the challenging particle size distribution and therefore the measured filtration efficiency.
Copyright © 2017 American Association for Aerosol Research
EDITOR:
1. Introduction
Accurate determination of the filtration efficiency is essential for filter design and applications. Different filters with unique properties are being tailored for ever growing diverse applications. It is crucial to select the appropriate ones for the intended purpose and to improve the design for a better performance. These needs emphasize the importance of meticulous experimental tests and realistic model studies.
The test system for filtration efficiency of airborne particles usually involves an aerosol generation part, particle measurement part, filter holder system, and other parts for pressure measurement, flow control, etc. (Wang and Tronville Citation2014). Various methods to measure and classify the particles could be applied. The optical particle counter (ANSI/ASHRAE Standard 52.2 (2012), EN 779 (2002), ISO 29461-1(2013)), aerodynamic particle counter (Eshbaugh et al. Citation2008; Vo and Zhuang Citation2013) and differential mobility analyzer (DMA) (Alonso et al. Citation1997; Heim et al. Citation2010; Brochot et al. Citation2011; Thomas et al. Citation2013) are among them. For airborne nanoparticles, electrical measurement is widely used and classification of the challenging particles by DMA is employed in numerous studies. Therefore, we investigate the filtration efficiency measured by a DMA-based experimental setup in this study.
The experimental accuracy depends on a number of parameters which may cause measurement artifacts and repeatability problems. The ability of the DMA to classify a monodisperse aerosol, the neutralization efficiency for the particles to acquire the Boltzmann equilibrium charge distribution, the filter holder geometry which affects the velocity profile and filter uniformity are important factors with respect to the aforementioned issues. For example, the TSI 3160 Automated Filter Tester uses a DMA to generate monodisperse aerosols within a range between 15 and 800 nm diameter for penetration tests. The manufacturer dictated a 2:1 ratio of the DMA sheath air flow rate to the aerosol flow rate, in order to give greater DMA output concentrations for the testing of very high efficiency filters. As a result, the DMA resolution is not high and the challenge aerosols have geometric standard deviation values less than 1.3 (TSI 3160 Specification [Citation2012]). The effects of such challenging aerosols need to be investigated. Regarding the neutralization efficiency, it was reported that the radioactive neutralizers TSI Model 3077 and 3077A may not sufficiently charge the sample aerosol to an equilibrium distribution when used outside of a classifier at certain flow rates (TSI [Citation2014]). Insufficient neutralization may cause artifacts in filtration tests.
Many well-established models focused on various filtration mechanisms in filter elements (Brown Citation1993; Kirsch and Fuchs Citation1968; Lee and Liu Citation1982; Lee and Mukund Citation2001; Spurny et al. Citation1969; Hinds Citation2012). In these models, the filtration velocity was assumed to be homogeneous and the particle size precisely the set value. Numerical simulations had been performed which consider the microstructure of the fibrous filters and simulated the airflow around the fibers (Maze et al. Citation2007; Wang et al. Citation2011; Hosseini and Tafreshi Citation2012). However, these simulations did not account for the macro-scale face velocity distribution inside the filter holder. Moreover, although previous models could compute efficiencies for different particle sizes, the actual particle size distribution for the challenging particles had not been applied. Therefore, we developed an integrative model which takes these factors into consideration to understand their effects and to predict the filtration efficiencies in realistic tests.
In order to validate the model we performed a number of experiments. Two different filters (a membrane filter and a wire mesh) were tested with particles in the size range of 8 nm to 500 nm. Silver nanoparticles and di-ethyl-hexyl-sebacat (DEHS) particles were used in the tests for the small size range (8–30 nm) and large size range (20–500 nm), respectively. Different face velocity distributions, filter holders, and settings on the DMA were employed.
In summary, we performed experimental and modeling studies to understand the effects of various parameters on filtration efficiency and the implications on realistic filtration test results.
2. Experimental procedure
2.1. Filtration efficiency measurement
The test set up consisted of three parts: particle generation system, particle selection system and particle count system. The schematic is presented in the online supplementary information (SI). Silver (8–30 nm) or DEHS (20–500 nm) particles were generated to challenge the filter medium using a Carbolite furnace or home-made atomizer, respectively. Silver slugs were placed in a ceramic boat inside the furnace and the temperature was set to 800–1100°C. The silver evaporated and then condensed during the cooling inside the outlet tube, producing nanoparticles. In order to produce DEHS nanoparticles, DEHS was dissolved in isopropyl alcohol (IPA) in two different concentrations (0.01% and 0.1% DEHS by volume, for the production of particles in the size range of 20–150 nm and 224–500 nm, respectively), which was then atomized with highly pressurized air. When DEHS were the challenging particles they passed through a drier so as to facilitate IPA evaporation.
Particles were selected by the TSI 3080 electrostatic classifier (composed of a bipolar neutralizer and a DMA) to produce monodisperse aerosols to challenge the filter. TSI 3085 or TSI 3081 DMA (nano) were applied to select DEHS or silver particles respectively. Then, the exiting monodisperse aerosol flow entered a TSI 3077 bipolar neutralizer to reduce the particle charge and was diluted with fresh filtered air before passing through the filter. In order to measure the filtration efficiency, upstream and downstream concentrations or counts were measured with TSI 3775 or 3776 condensation particle counter (CPC). In the case that silver particles challenge the filter, two CPCs were applied simultaneously to measure the upstream and downstream particles to minimize the effect from their concentration decrease by the time due to the furnace temperature drop and the fluctuation in the concentration of the challenging particles. In the experiments using DEHS, only one CPC was applied (due to constraint of the instrument availability) and switched between upstream and downstream measurements. Then, the filtration efficiency E is calculated as:[1] where N and C refer to count and concentration, respectively.
Two different filter holders, a large Teflon holder of 100 cm2 filtration area with a 30° transition angle and a small aluminum TSI 5072626 holder of 11.34 cm2 filtration area with a 44° transition angle, were used to evaluate the dependence of the face velocity distribution on the filter geometry and how the face velocity distribution affects the filtration efficiency. Two different filter media were investigated: a Nuclepore filter with 3 μm pore size (NP 3 μm), 0.14 porosity, and 0.009 mm thickness, and a wire mesh with an average wire diameter of 31 μm, 0.38 porosity, and 0.08 mm thickness.
2.2. Neutralization efficiency measurements
It is crucial for the particles entering the DMA to acquire the Boltzmann equilibrium charge distribution due to the fact that the classification is based on their electrical mobility. If there are a large number of multiply charged larger particles they can pass through the DMA, thus, distorting the monodispersity of the classified particles (Vijayakumar and Whitby Citation1984; Lüönd and Schlatter Citation2013; Chen et al. Citation2016).
In order to evaluate if the particles entering the DMA were efficiently neutralized, an experimental setup using two DMAs was applied. The schematic is presented in the SI. Two 370 MBq Kr-85 bipolar neutralizers were located inside the two classifiers. Their average age was approximately 5 years. This setup tested the neutralization efficiency of the Kr-85 in the first classifier as the Kr-85 in the second classifier was assumed to be able to reduce particle charge to Boltzmann equilibrium distribution. This assumption was reasonable because at the exit of the first classifier, the particle concentration was reduced and the charges per particle were limited. The mobility diameter was set to a pre-defined value in the first classifier. Then, scanning mobility particle sizer (SMPS) scan was performed with the combination of the second DMA and CPC in order to determine the particle size distribution. Other peaks appearing at larger particle sizes than the pre-set one indicated multiply charged particles. To check the efficiency of neutralization, the fractions of the multiply charged particles were calculated and compared with the theoretical values of the Boltzmann equilibrium distribution. In case the Kr-85 neutralizer inside the first classifier was not sufficient to achieve the Boltzmann equilibrium for the test aerosol, an additional 5-year-old TSI standalone 370 MBq Kr-85 neutralizer was placed before the first DMA.
DEHS particles from the atomizer are prone to having high fractions of multiply charged particles due to the production method, thus, those particles produced with a DEHS solution of 0.01% were selected to be studied. Aerosol flow and sheath flow were set to 1.5 lpm and 7.5 lpm, respectively, in both DMAs. The aerosol flow rate was the same or higher than the values used in the filtration experiments.
3. Model
3.1. Particle size distribution from the generator
Particles produced by the generator obtained a specific size distribution which was measured by the SMPS. The model applied an interpolation algorithm to simulate the size distribution within the range of the SMPS scan. Outside of the SMPS range, the particle size distribution was obtained by a lognormal distribution fitted to the SMPS data. The count median diameter (CMD) and the geometric standard deviation () were calculated and the values were optimized to fit the experimental data with a robust least-squares regression (Mathworks Citation2016).
3.2. DMA transfer function
Particles were classified in an axial flow DMA and its transfer function was taken into account to compute the challenging particle size distribution. When the ratio between the sheath flow and the aerosol flow was higher, the flow exiting the DMA exhibited higher degree of monodispersity reducing measurement inaccuracies.
DMA was modeled with its transfer function, which is the probability for a particle to pass through the DMA column. Non-diffusing transfer function was modeled with the equation from Knutson and Whitby (Citation1975). A broadening in the transfer function due to the strong diffusion for small particles was modeled according to Stolzenburg and McMurry (Citation2008). Both models can be found in the SI.
3.3. Filtration efficiency model
Nuclepore filter and twilled Dutch wire mesh were investigated. Four filtration mechanisms were incorporated in the model: diffusion, interception, interception of diffusing particles and impaction. As far as the Nuclepore filter is concerned, analytical details about the filtration model can be found in Chen et al. (Citation2013).
For the twilled Dutch wire mesh, diffusion (ED) was modeled according to Cheng and Yeh (Citation1980) who derived their model based on wire mesh filters. Interception (ER) was calculated based on the equation in Lee and Liu (Citation1982) which was applicable for fibrous filters. Interception of diffusing particles (EDR) was modeled according to Hinds (Citation2012) and impaction (EI) based on Landahl and Herrmann (Citation1949). The complete model equations are in the SI.
3.4. Face velocity distribution model
Face velocity distribution was simulated using FLUENT 15 (ANSYS) with the κ-ϵ model. The filter was mathematically represented by a porous jump boundary condition in the simulation. The pressure drop across the porous jump was calculated according to Equation (Equation2[2] ) or simulated in Fluent. Experimental values of the pressure drop ΔP as well as the filter thickness were known. Hence, the pressure jump coefficient and filter permeability were calculated by fitting the calculated data to the experimental ones.
[2] where ϕ is the permeability, c2 is the pressure-jump coefficient and ρ is the gas density.
The simulation domain was discretized with orthogonal mesh, using ANSA (BETA CAE Systems), and the mesh independency study was performed in each case. The same boundary conditions were applied for both filter holders. Upstream the filter, face velocity was quasi homogeneously distributed due to the pressure drop induced by the filter. Then, the velocity downstream the filter increased again in the convergent section and finally exited the filter holder.
3.5. Integrative model
An integrative model to calculate the filtration efficiency was developed in Matlab. The model took into account the particle size distribution generated by the atomizer, particle charge distribution, DMA transfer function, face velocity profile upstream the filter and filtration efficiency of the test filter. The considered physical processes in the model are illustrated in . The particles generated by the atomizer or furnace with the size distribution PSD1 passed through the radioactive neutralizer. Then, they entered the DMA where they got selected by their mobility diameter according to the DMA's transfer function. After the DMA, particles with the size distribution PSD2 passed through the neutralizer and challenged the filter where their size distribution was reduced to PSD3.
Figure 1. The considered physical processes for the integrative model.
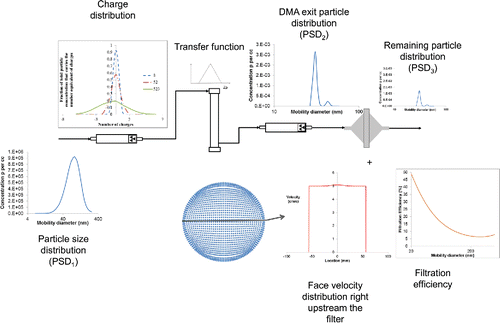
The model simulated the aforementioned procedures to calculate the final filtration efficiency. PSD1 was simulated according to Section 3.1. The charge distribution, was determined following Fuchs (Citation1963) for charges lower than or equal to 3. The transfer function model is explained in Section 3.2 and face velocity distribution immediately upstream of the filter was extracted from the flow field simulated in Fluent. The filter surface was discretized into grids (about 2000) with equal areas; the surface area and face velocity for a specific grid were designated as Ai (constant) and Ui, respectively. For each grid, the filtration efficiency was calculated according to Equations Equation(3)–(5). For each pre-set particle size Dp*, the transfer function
was calculated. Then, the electrical mobility (Zp) was transferred to the particle size distribution PSD2 classified by the DMA for Dp*. For that purpose, the charge distribution before the DMA inlet should have been known and pre-defined and it was assumed to be the Boltzmann charge equilibrium distribution. Multiply charged particles with up to 3 charges were considered in the PSD2 calculation (EquationEquation (5
[5] )). For each particle size Dp within PSD2 in a specific filter grid the filtration efficiency was modeled according to the established filtration models as explained in Section 3.3.
[3]
[4]
[5] where U0 is the average face velocity, Af is the total filtration area and
is the average particle size distribution downstream of the filter. Eideal (Dp, Ui) is the ideal filtration efficiency computed using the established filtration models assuming that filtration velocity and the particle size are exactly Ui and Dp, respectively. Esimulated is the simulated filtration efficiency with the challenging particle size distribution and filtration velocity profile considered.
4. Results
4.1. Face velocity distribution
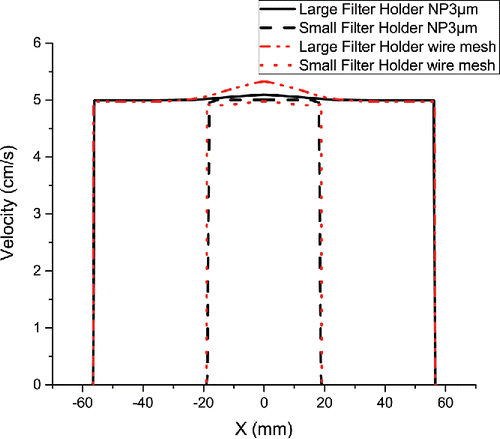
Two different filter holders were used in the experiments. The average face velocity was set to 5 cm/s and the velocity distribution was simulated according to Section 3.4. The velocity vs. the radial location, immediately upstream the filter, is presented in . In every case (different filters and holders), the face velocity was zero on the wall and increased steeply to approach the average face velocity away from the wall. The simulation results indicated that the face velocity was highly homogeneously distributed for both of the filter media and holders.
Figure 2. Profile of the face velocity distribution immediately upstream the filter. X is the radial distance from the filter center.
The face velocity profile was incorporated into the filtration efficiency model and the results showed that the filtration efficiency was not affected by the face velocity profile due to its highly homogeneous distribution upstream the filter. However, if other filter media are investigated the simulation should be re-performed because the velocity profile may become strongly non-uniform when the filter pressure drop is very low.
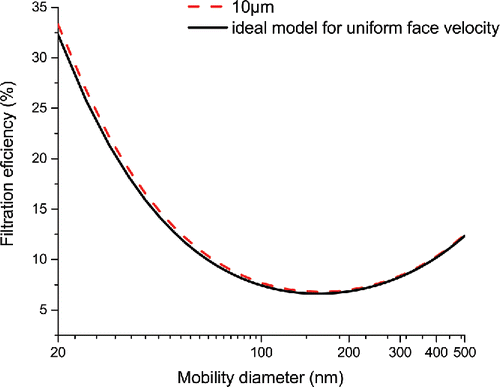
A case study was performed to investigate the degree of the face velocity nonuniformity and the influence on the filtration efficiency for low-pressure-drop filters. Nuclepore filters with pore sizes up to 10 μm are commercially available (e.g., Whatman Nuclepore WHA 111115). The simulation was applied to the large filter holder and Nuclepore filters at 5 cm/s average face velocity. The pore diameter of the Nuclepore filter was set to 9 and 10 μm with the other parameters constant causing 2.5 and 1.6 Pa pressure drop respectively The face velocity profile, shown in , reveals an inhomogeneous face velocity distribution for both the low-pressure-drop filters. The face velocity was lower than 5 cm/s at the outer part and very high at the center. The fraction of the area corresponding to the higher velocity was smaller compared to that with the lower velocity. The comparison of the simulated and ideal filtration efficiencies (uniform face velocity) presented in reveals that the filtration efficiency was not greatly affected by the velocity profile even with NP10 μm filter, which showed low pressure drop. For the particle size range below 100 nm, diffusion is the main filtration mechanism and it is affected by the face velocity; the higher the face velocity the lower the filtration efficiency due to diffusion. The effect of the higher velocity at the filter center and lower velocity in the outer part partially offset each other, leading to the result that the simulated filtration efficiency was only slightly higher than the ideal value for particles smaller than 100 nm. The higher simulated efficiency is related to the larger filter area fraction corresponding to the lower velocity. The filtration efficiency for particles in the size range of 200 nm to 500 nm depends mainly on the interception mechanism which is independent of the face velocity, thus no discernible effects on the filtration efficiency were observed in this size range.
Figure 3. Profile of the face velocity distribution upstream the filter for different Nuclepore filters. X is the radial distance from the filter center.
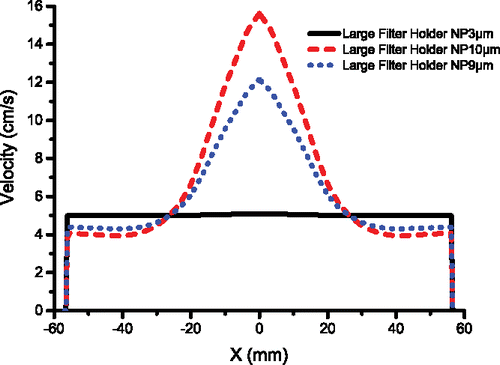
Figure 4. Comparison of the ideal filtration efficiency vs. the simulated filtration efficiency for Nuclepore filter with 10 μm size pores.
4.2. Investigation of the neutralization efficiency for particles entering the DMA for classification
In order to investigate the neutralization efficiency, experiments were performed for 20 and 30 nm DEHS particles according to Section 2.2. To verify that the Boltzmann equilibrium charge distribution was achieved, the measured ratio of singly to doubly charged particles was compared with the integrative model. The model was simplified and only took account of the initial distribution PSD1, charge distribution and DMA transfer function.
The experimental ratio was significantly lower compared to the model calculation when one Kr-85 neutralizer was used in front of the classifying DMA (singly charged: −245%, doubly charged: −118%), indicating that doubly charged particles in the experiments were very high. When two Kr-85 neutralizers were used in front of the classifying DMA, the experimental ratio was in accordance with the simulated one (singly charged: 0%, doubly charged: −8%). The reason that an additional neutralizer was needed can be attributed to the very high overall charge on the DEHS particles from the atomization method (Covert et al. Citation1997; Ji et al. Citation2004; Verpilliere et al. Citation2015).
Insufficient neutralization caused noticeable artifacts in the filtration experiments. A 3 μm Nuclepore filter was challenged with DMA classified 20 and 30 nm DEHS particles at 5 cm/s. The CMD of PSD1 was around 70 nm, thus particles larger than 20 and 30 nm existed at high concentrations, which promoted multiply charged particles coming through the DMA. The filtration efficiency increased by 17 and 29 percent with the use of the additional standalone neutralizer for 20 and 30 nm particles, respectively. These particles were smaller than the most penetrating particle size; therefore bigger multiply charged particles caused lower filtration efficiencies.
4.3. Investigation of the sheath to aerosol flow ratio
The effect of sheath to aerosol flow ratio (SAFR) on the filtration efficiency was investigated. The filters were challenged with silver and DEHS particles at 5 cm/s face velocity and the filtration efficiency was measured according to Section 2.1. Since there was no pronounced effect by the filter holder geometry on the face velocity profile, the small filter holder was used.
The model was applied for wire mesh and Nuclepore filters challenged by DMA-classified particles with different sheath to aerosol flow ratios. The face velocity upstream the filter was highly uniform, thus, for the sake of saving calculation time, the face velocity was set to the average value of 5 cm/s.
ANOVA statistical analysis was performed to test if the SAFR affected the measured filtration efficiency. If the F value is higher than the critical F value, the null hypothesis that filtration efficiency is independent of the SFAR is rejected. According to the results presented in , SAFR did not strongly affect the tests using DEHS particles; even though the ANOVA test indicated dependence on the SAFR at several DEHS particle sizes, further linear regression tests explained below showed no definitive correlation for most of these sizes. This could be attributed to higher experimental errors due to the use of only one CPC in the experimental procedure. However, ANOVA analysis revealed an impact of SAFR when silver particles challenged the filter media. For the experimental results that ANOVA analysis revealed a connection between SAFR and filtration efficiency, a further analysis was performed to test the way that the SAFR affected the filtration efficiency, by the means of linear regression. When the p-value was below 0.05 the SAFR was significant according to the regression test. If the slope of the curve of the filtration efficiency vs. SAFR was positive, filtration efficiency increased by increasing the SAFR and vice versa.
Table 1. Statistical analysis on the effect of sheath to aerosol flow ratio (SAFR) on the filtration efficiency of Nuclepore and wire mesh filter.
The results for NP 3 μm are presented in . Similar results were obtained for the wire mesh filter media and are presented in the SI. The model predicted very well the filtration efficiency for silver particles, while it captured the overall trend for DEHS particles.
Figure 5. Filtration efficiency tested using silver (left) and di-ethyl-hexyl-sebacat (DEHS) particles (right) classified by the differential mobility analyzer (DMA) with different sheath to aerosol flow ratios (SAFR) for Nuclepore 3 μm. The experimental data are represented by symbols and simulated results by lines.
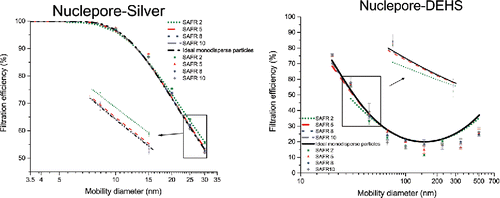
Diffusional broadening occurs for particles below 50 nm; therefore the diffusional DMA transfer function was applied in the model. In this size range diffusional broadening enhances the effect of SAFR. Lower SAFR affects the filtration efficiency by greatly widening the DMA selection window. The other factors contributing to the effect on filtration efficiency include the challenging particle size distribution, the slope of the filtration efficiency curve, and the relative relationship of the classified particle size compared to the CMD of PSD1.
In the size range of 2.5 to 8 nm, where the particles were produced with the furnace, the filtration efficiency decreased by decreasing the SAFR. In this size range, the particles were smaller or close to the CMD; therefore, the wider selection window by decreasing the SAFR allowed bigger particles to get selected reducing the measured filtration efficiency. The higher the slope of the filtration efficiency curve the greater the contribution of this artifact, because the particle size imposes higher weight in the filtration efficiency. The effect of the SAFR was more obvious in the wire mesh filter because the slope was higher in the 2.5–8 nm range.
In the size range of 15 to 45 nm, the filtration efficiency was affected by the SAFR and PSD1 which depended on the production method (furnace or atomizer). For DEHS particles, the filtration efficiency decreased by decreasing the SAFR, while for silver particles it increased. The reasons can be related to PSD1 and the DMA column length. The DMA column length changes the diffusional transfer function and affects the particle selection window. For PSD1, the CMD was about 8 nm and 70 nm for silver and DEHS particles, respectively. The PSD2 for 30 nm classified particles is presented in , which clearly shows that when the nano-DMA column was used (for silver particles) the selected particle size window was narrower. Moreover, when the classified particle diameter (in the case of DEHS particles) was smaller than the CMD, the concentration of bigger particles was high. Thus, bigger particles were selected which lead to lower filtration efficiency. On the contrary, for the classified particle size bigger than the CMD, the concentration of smaller particles was high. Therefore, smaller particles, which were selected due to the diffusion inside the DMA column, contributed to the increase of the filtration efficiency. When the studied particle was close to the CMD there was not a pronounced effect in the filtration efficiency because smaller as well as bigger particles were selected by the DMA cancelling out each other's effects.
Figure 6. Challenging particle size distribution PSD2 classified by the differential mobility analyzer (DMA) with the set size of 30 nm and different sheath to aerosol flow ratios. Di-ethyl-hexyl-sebacat (DEHS) particles (left) and silver particles (right). The two peaks corresponding to the singly and doubly charged particles (Equation (Equation3[3] )) are visible for DEHS but not for silver.
![Figure 6. Challenging particle size distribution PSD2 classified by the differential mobility analyzer (DMA) with the set size of 30 nm and different sheath to aerosol flow ratios. Di-ethyl-hexyl-sebacat (DEHS) particles (left) and silver particles (right). The two peaks corresponding to the singly and doubly charged particles (Equation (Equation3[3] )) are visible for DEHS but not for silver.](/cms/asset/b22973f4-1f91-4c8d-8f99-cedc50477aa4/uast_a_1254720_f0006_oc.gif)
In the PSD2 is presented when 335 nm was the classified particle size which was larger than the CMD. However, there was not a pronounced effect of the SAFR. The reason was attributed to the slope of the filtration efficiency curve; if it is high, e.g., in the particle size range 10 to 100 nm (), the effect of polydisperse PSD2 was enhanced. However, when the filtration efficiency curve was relatively flat, e.g., in the size range below 8 nm or near the most penetrating particle sizes around 200–300 nm, the dependence of the filtration efficiency on the particle size was weak and no noticeable effect of the polydisperse PSD2 was observed.
Figure 7. Challenging particle size distribution PSD2 classified by the differential mobility analyzer (DMA) with the set size of 335 nm and different sheath to aerosol flow ratios. The three peaks corresponding to the singly, doubly and triply charged particles (Equation (Equation3[3] )) are visible.
![Figure 7. Challenging particle size distribution PSD2 classified by the differential mobility analyzer (DMA) with the set size of 335 nm and different sheath to aerosol flow ratios. The three peaks corresponding to the singly, doubly and triply charged particles (Equation (Equation3[3] )) are visible.](/cms/asset/8cf4071b-9d02-40a9-9768-48825cb56f01/uast_a_1254720_f0007_oc.gif)
Overall, the results for both filter media and particle types indicated that a SAFR above or equal to 5 should be applied to prevent noticeable artifacts due to the SAFR. It should be noted that these results are valid for the investigated filter media. Other filter media may have different filtration curves and characteristics.
5. Conclusion
An integrative model was developed to simulate the realistic process of filtration tests and to understand the effects of several physical processes on the measured filtration efficiency. The model took the particle size distribution, particle charge distribution, DMA transfer function, face velocity profile and filtration efficiency models into account. Experiments were carried out to verify the model. Two different filter holders and two different filter media, a wire mesh and Nuclepore filter, were investigated in this study.
The face velocity profile was simulated in Fluent and the results exhibit no obvious effect on the filtration efficiency for the two studied media. An investigation of filtration media with pressure drop down to 2.5 Pa and 1.6 Pa at 5 cm/s showed that the velocity profile could become nonuniform, however, even in such cases, the effect on the filtration efficiency was marginal.
Neutralization efficiency study showed that in case of DEHS particles produced by atomization, the neutralization efficiency should be tested to rule out multiply charged particle contribution to the measurement artifacts, due to the high amount of charge.
The challenging particle size distribution PSD2 depended on the initial distribution PSD1 and could affect the filtration efficiency. In addition, its monodispersity depended on the neutralization efficiency and DMA transfer function. Both filters exhibited the same trend regarding the SAFR. For the investigated media, our study concluded that a factor above or equal to 5 should be applied to avoid the artifact.
In summary, the integrated model can predict accurately the filtration efficiency of both investigated filters. It can serve as a robust tool to study actual filtration test procedure, to avoid experimental artifacts and to improve the measurement reliability.
UAST_1254720_Supplemental_File.zip
Download Zip (290.2 KB)Acknowledgments
The study is supported by the European Commission in the frame of mandate M/461 “Standardization activities regarding nanotechnologies and nanomaterials.”
The authors would like to thank Beta company for the provision of a free license of ANSA software.
Related Research Data
References
- Alonso, M., Kousaka, Y., Hashimoto, T., and Hashimoto, N. (1997). Penetration of Nanometer-Sized Aerosol Particles Through Wire Screen and Laminar Flow Tube. Aerosol Sci. Technol. 27(4):471–480.
- Brochot, C., Mouret, G., Michielsen, N., Chazelet, S., and Thomas, D. (2011). Penetration of Nanoparticles in 5 nm to 400 nm Size Range Through Two Selected Fibrous Media. Paper presented at the Journal of Physics: Conference Series, Volume 304, Number 1.
- Brown, R. C. (1993). Air Filtration: An Integrated Approach to the Theory and Applications of Fibrous Filters. Pergamon, London.
- Chen, B. T., Schwegler-Berry, D., Cumpston, A., Cumpston, J., Friend, S., Stone, S., and Keane, M. (2016). Performance of a Scanning Mobility Particle Sizer in Measuring Diverse Types of Airborne Nanoparticles: Multi-Walled Carbon Nanotubes, Welding Fumes, and Titanium Dioxide Spray. J. Occup. Environ. Hyg. 13(7):501–518.
- Chen, S.-C., Wang, J., Fissan, H., and Pui, D. Y. (2013). Use of Nuclepore Filters for Ambient and Workplace Nanoparticle Exposure Assessment—Spherical Particles. Atmos. Environ. 77:385–393.
- Cheng, Y., and Yeh, H. (1980). Theory of a Screen-Type Diffusion Battery. J. Aerosol Sci. 11(3):313–320.
- Covert, D., Wiedensohler, A., and Russell, L. (1997). Particle Charging and Transmission Efficiencies of Aerosol Charge Neutralizes. Aerosol Sci. Technol. 27(2):206–214.
- Eshbaugh, J. P., Gardner, P. D., Richardson, A. W., and Hofacre, K. C. (2008). N95 and P100 Respirator Filter Efficiency Under High Constant and Cyclic Flow. J. Occup. Environ. Hyg. 6(1):52–61.
- Fluent, A. (2013). 15.0. User's Guide. Porous Jump Boundary Conditions. Ch. 7.22.
- Fuchs, N. (1963). On the Stationary Charge Distribution on Aerosol Particles in a Bipolar Ionic Atmosphere. Geofis. Appl. 56(1):185–193.
- Heim, M., Attoui, M., and Kasper, G. (2010). The Efficiency of Diffusional Particle Collection onto Wire Grids in the Mobility Equivalent Size Range of 1.2–8 nm. J. Aerosol Sci. 41(2):207–222.
- Hinds, W. C. (2012). Aerosol Technology: Properties, Behavior, and Measurement of Airborne Particles. John Wiley & Sons, New York, NY.
- Hosseini, S., and Tafreshi, H. V. (2012). Modeling Particle-Loaded Single Fiber Efficiency and Fiber Drag using ANSYS–Fluent CFD Code. Comp. Flu. 66:157–166.
- Ji, J., Bae, G., and Hwang, J. (2004). Characteristics of Aerosol Charge Neutralizers for Highly Charged Particles. J. Aerosol Sci. 35(11):1347–1358.
- Kirsch, A., and Fuchs, N. (1968). Studies on Fibrous Aerosol Filters—III Diffusional Deposition of Aerosols in Fibrous Filters. Ann. Occup. Hyg. 11(4):299–304.
- Knutson, E., and Whitby, K. (1975). Aerosol Classification by Electric Mobility: Apparatus, Theory, and Applications. J. Aerosol Sci. 6(6):443–451.
- Landahl, H., and Herrmann, R. (1949). Sampling of Liquid Aerosols by Wires, Cylinders, and Slides, and the Efficiency of Impaction of the Droplets. J. Coll. Sci. 4(2):103–136.
- Lee, K., and Liu, B. (1982). Theoretical Study of Aerosol Filtration by Fibrous Filters. Aerosol Sci. Technol. 1(2):147–161.
- Lee, K., and Mukund, R. (2001). Filter Collection, in Aerosol Measurement: Principles, Techniques, and Applications, W. K. Baron P, ed., Wiley Interscience, New York (pp. 197–228).
- Lüönd, F., and Schlatter, J. (2013). Improved Monodispersity of Size selected Aerosol Particles with a New Charging and Selection Scheme for Tandem DMA Setup. J. Aerosol Sci. 62:40–55.
- Mathworks. (2016). Least-Squares Fitting. Online documentation.
- Maze, B., Tafreshi, H. V., Wang, Q., and Pourdeyhimi, B. (2007). A Simulation of Unsteady-State Filtration via Nanofiber Media at Reduced Operating Pressures. J. Aerosol Sci. 38(5):550–571.
- Spurny, K., Lodge, J. P., Frank, E. R., and Sheesley, D. C. (1969). Aerosol Filtration by Means of Nuclepore Filters: Structural and Filtration Properties. Environ. Sci. Technol. 3(5):453–464.
- Standard, A. (2007). Standard 52.2–2007–Method of testing general ventilation air-cleaning devices for removal efficiency by particle size (ANSI/ASHRAE Approved). Am. Soc. Heat. Refrig. Air-Cond. Eng.
- Standardization, E. C. f. (2002). EN 779:2002 “Particulate Air Filters for General Ventilation—Determination of the Filtration Performance”. In E. C. f. Standardization, ed., CEN, Brussels. p. 20.
- Standardization, I. O. f. (2013). ISO 29461-1:2013 “Air intake filter systems for rotary machinery—Test methods—Part 1: Static filter elements”. ISO, Geneva.
- Stolzenburg, M. R., and McMurry, P. H. (2008). Equations Governing Single and Tandem DMA Configurations and a New Lognormal Approximation to the Transfer Function. Aerosol Sci. Technol. 42(6):421–432.
- Thomas, D., Mouret, G., Cadavid-Rodriguez, M.-C., Chazelet, S., and Bemer, D. (2013). An Improved Model for the Penetration of Charged and Neutral Aerosols in the 4 to 80 nm Range Through Stainless Steel and Dielectric Meshes. J. Aerosol Sci. 57:32–44.
- TSI. (2012). Model 3160 Automated Filter Tester Specification, p. 2.
- TSI. (2014). Aerosol neutralization issue model 3077(A). Application note 3007-001. p. 1–3.
- Verpilliere, L., Swanson, J. J., and Boies, A. M. (2015). Unsteady Bipolar Diffusion Charging in Aerosol Neutralisers: A Non-Dimensional Approach to Predict Charge Distribution Equilibrium Behaviour. J. Aerosol Sci. 86:55–68.
- Vijayakumar, R., and Whitby, K. (1984). Bipolar steady state charge fraction of ultrafine aerosols. Aerosol Sci. Technol. 3(1):25–30.
- Vo, E., and Zhuang, Z. (2013). Development of a new Test System to Determine Penetration of Multi-Walled Carbon Nanotubes Through Filtering Face Piece Respirators. J. Aerosol Sci. 61:50–59.
- Wang, J., Kim, S. C., and Pui, D. Y. (2011). Carbon Nanotube Penetration Through a Screen Filter: Numerical Modeling and Comparison with Experiments. Aerosol Sci. Technol. 45(3):443–452.
- Wang, J., and Tronville, P. (2014). Toward Standardized Test Methods to Determine the Effectiveness of Filtration Media Against Airborne Nanoparticles. J. Nanopart. Res. 16(6):1–33.