ABSTRACT
For rapid and effective detection of airborne microorganisms, it is preferable to remove dust particles during the air sampling process because they can reduce the detection accuracy of measurements. In this study, a methodology of real-time separation ofaerosolized Staphylococcus epidermidis (S. epidermidis) andpolystyrene latex (PSL) particles of similar size was investigated. These two species represent biological and non-biological particles, respectively. Due to their different relative permittivities, they grasp different numbers of air ions under corona discharge. After these charged particles enter a mobility analyzer with airflow, in which an electric field is applied perpendicular to the airflow, the S. epidermidis and PSL particles separate, due to the difference in their electric mobilities, and exit through two different outlets. Purities and recoveries for S. epidermidis and PSLat their respective outlets were determined with measurements of aerosol number concentrations and ATP bioluminescence intensities at the inlet and two outlets. The results were that purities for PSL and S. epidermidis were 70% and 80%, respectively. This methodology provides a rapid and simple way to increase the detection accuracy of bacterial agents in air.
Copyright © 2017 American Association for Aerosol Research
EDITOR:
1. Introduction
Exposure to airborne biological agents such as fungi, bacteria, and viruses, which have very long residence times due to their low inertia and size ranges, can result in many respiratory and other adverse health effects, such as infection, hypersensitivity pneumonitis, toxic reactions, and acute respiratory infection (Demers et al. Citation2000; Ana et al. Citation2013; Hoyert and Xu Citation2012). Therefore, demands for rapid, specific, accurate, and real-time detection of infectious agents have increased with the aim of preventing and controlling the presence of such dangerous biological particles in public places and dwellings.
For rapid and effective detection, various biological and chemical techniques have been developed such as immunoassay, UV-Vis spectroscopy, polymerase chain reaction (PCR), and biosensors (Bogdanovic et al. Citation2006; Hospodsky et al. Citation2010; Liu et al. Citation2007; Park et al. Citation2012). These methods are usually fast and accurate; however, they all have some disadvantages. Non-target particles and dust can affect the accuracy of measurements and detection, especially in the case of PCR and biosensors. Recent aerosol studies have independently shown that environmental matrices (dust or particulate matter) can significantly inhibit PCR and cause the complete or partial failure of the PCR reaction (Kärkkäinen et al. Citation2010; Hospodsky et al. Citation2010; Stetzenbach et al. Citation2004; Peccia and Hernandez Citation2006). Results indicate that the extent of inhibition by dust on PCR varies with the type and amount of dust. Therefore, an additional step, such as centrifugation for inertial particle separation, is required in order to obtain a target microbe before quantitative, accurate identification (e.g., nucleic acid amplification) (Hong et al. Citation2015). Sensors and microchips are increasingly being used to detect target microbe particles (Han et al. Citation2008; Lee et al. Citation2008; Aravind et al. Citation2014; Jing et al. Citation2013). Moon et al. (Citation2009) explained that particles, such as dust, that exist in the environment can result in false positives or mask the ability of sensors when the particles are resuspended in a liquid prior to detection. Therefore, reducing and removing non-target particles and inhibitors (and thereby increasing the purity of target particles) is an important goal in the development of biosampler devices. Dust particles that are larger or smaller than bacteria can be eliminated by filters or inertial methods, such as virtual impactors or cyclones. However, if the size of the dust particles is very similar to that of bacteria, then the bacteria that are the sampling target can also be eliminated together with the dust particles.
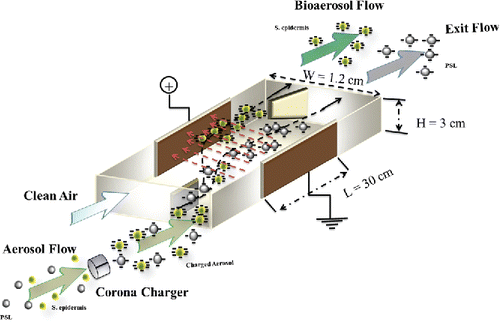
In this article, we introduce a methodology to separate bacterial and non-bacterial aerosols of similar size by exploiting differences in their electrical mobilities. Similar sized Staphylococcus epidermidis and polystyrene latex (PSL) particles were chosen. When S. epidermidis and PSL particles pass through a corona region (), they gain different electrical charge values because the number of charges obtained by aerosol particles depends on their relative permittivity (Hinds Citation1999). A bacterial cell is mostly composed of water, while mineral materials such as Al2O3, SiO2, and Fe-oxides are dominant species of non-bioaerosol particles (i.e., dust) (Pakkanen et al. Citation2003; Yang et al. Citation2005; Pérez et al. Citation2008).
Figure 1. Concept of real time separation of similar sized Staphylococcus epidermidis and polystyrene latex (PSL).
Mainelis et al. (Citation2002) designed a mobility analyzer to extract microorganisms by varying applied voltage. Before entering the mobility analyzer, the microorganisms acquired electric charges when they were suspended from an atomizer-type bioaerosol generator. They measured electrical charge distributions of vegetative cells of P. fluorescens bacteria and NaCl particles. In this study, by using a pin-cylinder type corona charger together with a mobility analyzer similar to that developed by Mainelis et al. (Citation2002), the average charges of S. epidermidis and PSL particles were separately measured. Then PSL particles and S. epidermidis were injected to the mobility analyzer together, and an external electric field was applied in the direction perpendicular to particle flow. The aerosol number concentrations and ATP bioluminescence intensities were measured at the inlet and also at the two outlets to determine separation performance.
2. Materials and methods
2.1. Preparation of bacterial and PSL suspensions
S. epidermidis is a representative Gram-positive bacteria usually found in various environments and known as a typical airborne microorganism for bioaerosol research (Agranovski et al. Citation2010; Yoon et al. Citation2010; Jung et al. Citation2009; Lee et al. Citation2010). According to Park and Hwang (Citation2013) and Park et al. (Citation2011), the geometric mean aerodynamic diameter of S. epidermidis is around 1 µm.
A volume of 0.1 mL of S. epidermidis (ATCC 14990), which was obtained from the Korean Culture Center of Microorganisms, Seoul, Korea, was poured in a nutrient broth (Difco Laboratories, MI, USA) of 25 mL and cultured for 24 h at 37°C. The solution of nutrient broth was composed of meat extract (3 g) and peptone (5 g) in sterile deionized water (1000 mL). To generate bioaerosols, the incubated bacterial solution was three times washed with sterile deionized water to remove the residual particles such as nutrient broth components using a centrifuge machine (VS-1500N, Vision Scientific, Korea) at 6000 rpm (2697 g) for 15 min (Park et al. Citation2015).
Polystyrene latex (PSL) particles (of 0.88 ± 3% μm in diameter) suspended in liquid (5088A, Thermo Scientific Company, Freemont, CA, USA) were purchased. The PSL solution was diluted with 50 mL of sterile deionized (DI) water, resulting in the concentration of 1000 numbers/cm3.
2.2. Particle charge measurement
Experiments were performed in a clean booth (Kumkang, Korea) following the schematic shown in . Experiments were carried out first with PSL particles and then repeated with S. epidermidis. The particle suspension (PSLor S. epidermidis) was aerosolized using an atomizer (model 9302, TSI Inc., Shoreview, MN, USA). Dry-cleaned air supply system consisted of an oil trap, a diffusion dryer, and a high efficiency particulate air (HEPA) filter. The flow rate of compressed air passing through the air supply system was controlled by a valve and a mass flow meter (model 4143, TSI Inc.) (). Dry clean air with the flow rate of 3 LPM and the (gage) pressure of 62.5 kPa made a high-velocity aerosol jet through the orifice of an atomizer. Water droplets were removed from the aerosols flow after passing through the diffusion dryer put after atomizer. The charge on the aerosols was then neutralized using a neutralizer (soft X-ray charger 4530, HTC, Korea). The temperature and relative humidity in the laboratory were 24.5°C and 51%, respectively.
Figure 2. Experimental setup for measuring (a) concentration using an aerodynamic particle sizer (APS), and (b) ATP luminescence.
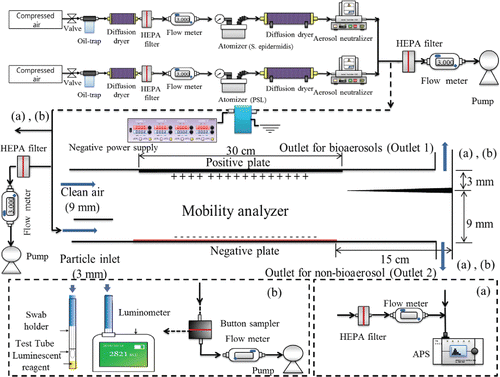
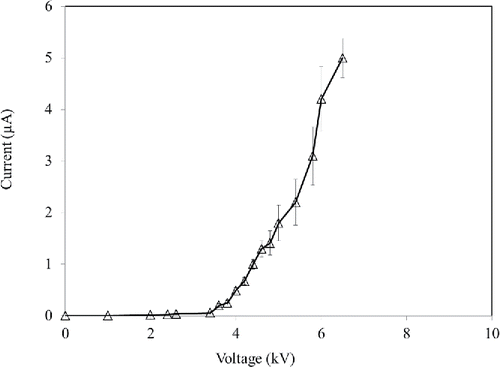
The number concentration of aerosolized particles was measured by an aerodynamic particle sizer (APS; model 3321, TSI). The APS measures particle concentrations with an aerodynamic diameter ranging from 0.5 to 20 μm. The sampling flow rate of the APS was 1 LPM. The size distributions of the two species are shown in . The geometric mean diameters (GMD) of PSL and S. epidermidis aerosols were 0.91 and 0.94 µm, respectively. The concentrations of bacteria and PSL solutions were diluted with DI water until the concentrations of aerosolized bacteria and PSL particles were almost equal to 1000 numbers/cm3 which was within the detection range of the APS. The aerosolized particles were charged by a pin-cylinder type charger developed by Park et al. (Citation2011). Corona discharge was produced at the sharp tip of a stainless steel needle located at the center of the charger. The generated negative ions by the corona discharge moved to the grounded cylinder along with electric field. The uncharged particles entering the inlet were negatively charged by these ions and then the charged particles passed through the exit of the charger. When S. epidermidis and PSL particles passed through a corona region, they gained different charge numbers since the number of charges obtained by aerosol particles depends on their relative permittivity (Hinds Citation1999). The relative permittivity for different kinds of bacteria is around 80 (Sanchis et al. Citation2007) while for PSL particles it is around 2.5 (Kim et al. Citation2010). In order to test the electrical characteristics of the charger, corona currents for various applied voltages were measured using a multimeter (6517B, Keithley, OH, USA). shows the current-voltage curve of the charger. In this study, the applied voltage between the needle and the cylinder was 5.2 kV which produced a current of 2 µA.
Figure 3. Size distributions of Staphylococcus epidermidis and polystyrene latex (PSL) aerosols. (Each measurement was repeated three times. Each data point presents the average and error bars present the standard deviation.)
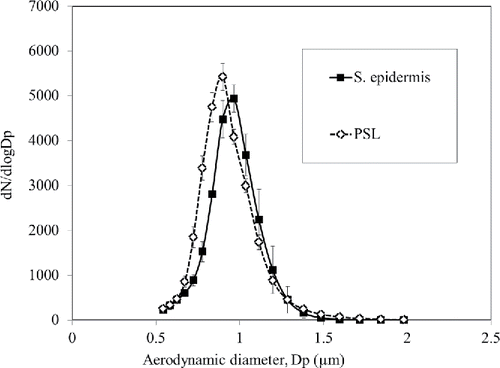
Figure 4. Current-voltage (I-V) characteristics of the aerosol charger. (Each measurement was repeated three times. Each data point presents the average and error bars present the standard deviation.)
After passing through the charger, air flow containing charged particles entered through the aerosol inlet section (3 mm width) of the rectangular-shaped mobility analyzer while clean sheath air entered through another inlet (9 mm width). The key dimensions of the mobility analyzer are provided in . The external electrical field perpendicular to the flow direction caused the negatively charged bacteria to be deflected toward the anode and to exit through the outlet for bioaerosols (outlet 1). PSL particles were also deflected toward the anode. However, their charge numbers were expected to be lower than those of S. epidermidis. Therefore, PSL particles were not greatly deflected from horizontal movement and thus were expected to exit through the outlet for non-bioaerosols (outlet 2). A rectangular pin was embedded at the end of the analyzer to prevent PSL particles from exiting through outlet 1 and S. epidermidis from exiting through outlet 2.
The mobility of a particle exiting the analyzer through outlet 1 located at horizontal distance L from the aerosol inlet at a certain voltage applied between two parallel plates is calculated given by Mainelis et al. (Citation2002), as follows:[1] where
is the particle mobility, Q is total flow rate, V is voltage, W is width, L is length, and H is the height of the mobility analyzer. Mainelis et al. (Citation2002) explained that particles which passed through outlet 1 had the electrical moblilities between 2/3 Zp and 4/3 Zp.
According to Hinds (Citation1999), the mobility of a particle of size carrying n elementary charges is defined as follows:
[2] where
is the particle diameter,
is the air viscosity, e is the elementary charge unit (1.6 × 10⁻¹⁹ coulombs), and
is the Cunningham slip correction factor. Therefore, for any given Q, W, L, and H, the median charge number of a particle of size
can be expressed as follows, if the particle can exit through outlet 1 for given applied voltage V (Mainelis et al. Citation2002):
[3]
If particles of different sizes (for example, d1, d2, d3 …) and different number concentrations (N1, N2, N3 …) enter the mobility analyzer and all of them exit through outlet 1 at applied voltages of V1, V2, V3 …, respectively, then the average charge number can be expressed as:[4] where
[5]
However, in a real situation, some particles fail to exit through outlet 1. Then the average charge number can be:[6] where
is the ratio of particle (of size
) concentration at outlet 1 to the inlet concentration, at specific voltage
In this study, we varied the voltage applied to the analyzer.
Charge measurement experiments were carried out first for bioaerosols (GMD = 0.94 µm) and then for non-bioaerosols (GMD = 0.91 µm) with the same procedure described below. When there was no voltage applied to the mobility analyzer, all of the charged particles (for example, bioaerosols) were expected to pass through outlet 2. However, some of the bioaerosols started to pass through outlet 1 when we increased the voltage to a certain value (onset voltage). For this onset voltage, we calculated the charge number of bioaerosols by using Equation (Equation5[5] ). Then different charge numbers were obtained by increasing the applied voltage step-wise in a way mentioned by Mainelis et al. (Citation2002). For each applied voltage, we simultaneously measured total number concentrations of bioaerosols at the inlet and also at the two outlets by using three APS, respectively. Then the fractions of bioaerosols passing through outlet 1 and outlet 2 were calculated for each applied voltage. After obtaining all fraction values for all applied voltages, the average charge of the bioaerosols entering the mobility analyzer was estimated by using Equation (Equation6
[6] ).
The average charge numbers for bioaerosols and non-bioaerosols were also calculated using charging theories introduced in Hinds (Citation1999), as follows;[7] where
is the mobility of negative air ions (1.6 cm2/V·s), k is the Boltzmann constant, c is the mean velocity of air ion (240 m/s),
is the relative permittivity of the particle material, T is the temperature, KE is the constant of proportionality (9 ×
N·m2/C2), and E is the mean value of the electric field intensity in the particle charger. The flow residence time (t) is defined as the ratio of the length of particle charging zone (7.5 mm) to the airflow velocity. The concentration of corona discharge-generated air ions (
) was estimated using the following equation:
[8] where
is the corona current (2 µA, see ) and A is the surface area of the ground electrode.
2.3. Particle separation experiment
Separation experiments were carried out when aerosolized S. epidermidis and PSL particles entered the mobility analyzer together. The voltage applied to the mobility analyzer, V, should be chosen appropriately so that the highest separation between negatively charged bioaerosols and negatively charged PSL particles could occur. Higher values of V caused bioaerosols to deposit on the anode, while lower values of V could cause the bioaerosols to move with excess air flow and leave the separator through outlet 2, which was for PSL particles. Aerosol and sheath flow rates also needed be carefully chosen. Experiments were performed in a clean booth with the schematic shown in .
Different flow rates as well as different voltages applied to the mobility analyzer were tested. Experiments were carried out first for bioaerosols and then for non-bioaerosols with the same procedure described below.
To minimize eddy formation when the flow containing particles was merged with sheath flow, the airflow rates at the inlet and outlet channels were kept at the same ratio as the ratio of the respective channel widths; aerosol inlet flow rate: sheath air flow rate = 1:3.
To determine the total flow rate, the concentration of particles exiting from the non-bioaerosol outlet (outlet 1) was measured and compared with the concentration of particles entering the aerosol inlet. Those measurements were performed using two APSs while the voltage applied to the mobility analyzer was zero. After determining the total flow rate, S. epidermidis and PSL particles were simultaneously injected to measure recovery and purity.
Recovery is defined as the fraction between the amount of species exiting the separator and the amount of total species injected to the separator. The recoveries for S. epidermidis and PSL particles are defined as follows:[9]
[10] where
and
are the numbers of S. epidermidis at the aerosol inlet and outlet for bioaerosols (outlet 1), respectively.
and
are the numbers of PSL at the aerosol inlet and outlet for non-bioaerosols (outlet 2), respectively. The purity is defined as the fraction between the amount of a particular species at an outlet and the amount of total species at that outlet. The purities for S. epidermidis and PSL particles are defined as follows:
[11]
[12]
Similarly, the wall losses for S. epidermidis and PSL particles are defined as follows:[13]
[14]
NPSL-inlet, Nbacteria-inlet, NPSL-outlet1, NPSL-outlet2, Nbacteria-outlet1, and Nbacteria-outlet2 need to be determined so that the purity and recovery of each species can be obtained. For this, ATP bioluminescence and aerosol number counting methods were used together. Firstly, three APS were installed, one each at the inlet and two outlets, to simultaneously measure the total aerosol concentration at each position. Then, a Button Aerosol Sampler (SKC Inc., USA) was installed to sample particles over a gelatin filter at each position. Next, after washing the filter, the ATP bioluminescence method was applied to the sampled particles using a luminometer (PD-10 N, Lumitester, Kikkoman, Japan) to measure the relative light unit (RLU) reading. Finally, the number concentration of bacteria at each position was obtained from the bacterial standard curve. Subsequently the concentration of PSL at the position was obtained by subtracting the concentration of bacteria from the total concentration measured with APS.
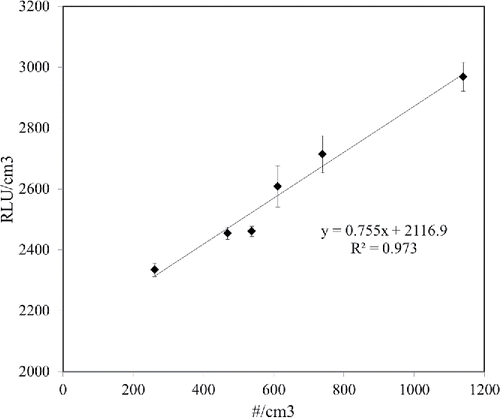
The bacterial standard curve establishes a relationship between the total bacterial count per unit air volume (number/cm3) using APS and luminometer output (RLU). To obtain the bacterial standard curve, various concentrations of bacteria were aerosolized and their concentrations were measured with APS. For each measurement, the bacteria particles were also sampled over a gelatin filter installed in the Button Aerosol Sampler.
The bacteria sampled over the gelatin filter were soaked in 20 mL of sterile deionized water and flowed by vortexing for 2 min and sonicating for 15 min (Wang et al. Citation2001). After the bacterial suspension was diluted once, a 100 µL sample containing the bacterial suspension was delivered to a swab-based type luminometer (PD-10N Lumitester, Kikkoman). shows the relation between the RLU/cm3 and the number/cm3 of S. epidermidis bioaerosols measured, respectively, using the ATP-based method and APS. The unit conversion from RLU to RLU/cm3 was calculated as follows:[15]
3. Results and discussion
3.1. Flow rate and applied voltage to the mobility analyzer
With a total flow rate of 0.4 LPM, there was wall loss of around 15% due to diffusion. However, increasing the total flow rate to 0.8 LPM made the wall loss negligible. Further increasing the flow rate made the wall loss also negligible.
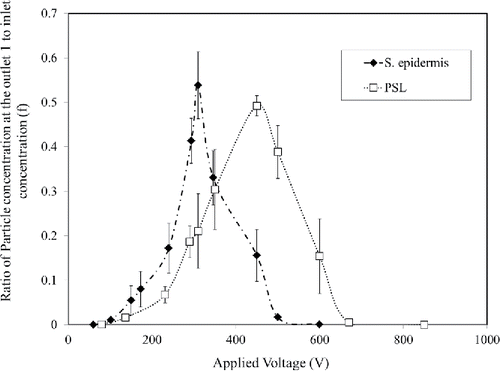
To find the maximum recovery at each flow rate, experiments were conducted by gradually increasing the voltage applied to the mobility analyzer. By increasing the voltage, the concentration of bioaerosols passing through outlet 1 (for bioaerosols) increased and reached a maximum. However, further increasing the voltage caused increasing wall losses and thus the concentration of bioaerosols at outlet 1 decreased. Therefore, a profile of concentration ratio (f) between outlet 1 and the aerosol inlet was obtained with varying voltage. A similar profile was obtained for PSL particles.
For the total flow rate of 0.8 LPM, the maximum recovery of bacteria (36.7%) was obtained at the applied voltage of 150 V. When the total flow rate increased to 1.2 LPM, the maximum recovery for bacteria (54.1 ± 5%) was obtained at the voltage of 310 V. However, about 20.4% of bacteria still exited through the non-bioaerosol outlet (outlet 2). By further increasing the flow rate, the maximum recovery for bacteria showed a decreasing trend.
Therefore, an aerosol inlet flow rate of 0.3 LPM and a sheath flow rate of 0.9 LPM were chosen for the mobility analyzer (flow velocity = 0.55 cm/s). The applied voltage of 310 V was chosen for the particle separation experiment (electric field = 310 V/1.2 cm). The results are summarized in . shows concentration ratio profiles.
Table 1. Maximum recoveries for Staphylococcus epidermidis with different flow rates.
3.2. Particle charge measurement
Different charge numbers (ni) with varying the voltage (Vi) were obtained using Equation (Equation5[5] ), for PSL and S. epidermidis. The fractions of particles carrying specific charge number at specific voltage
were experimentally determined for PSL and S. epidermidis. The results are shown in . Then the average charge numbers were calculated using Equation (Equation6
[6] ) and found to be 88 and 57, respectively, for PSL and S. epidermidis.
Figure 7. Fraction of particles carrying specific charge number. (Each measurement was repeated three times. Each data point presents the average and error bars present the standard deviation.)
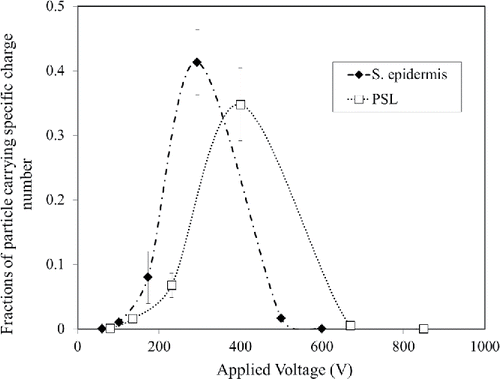
The theoretical charge numbers for S. epidermidis and PSL were calculated using Equation (Equation7[7] ). These numbers were 81 and 61, respectively, which are in good agreement with the experimental results of 88 and 57.
3.3. Particles separation experiment
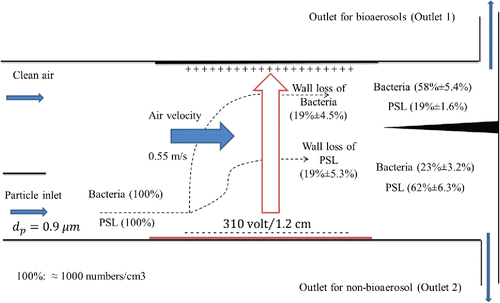
Experiments were carried out when charged PSL particles (average charge number = 57) and S. epidermidis particles (average charge number = 88) were injected simultaneously to the mobility analyzer. Then their recovery and purity values were determined. shows that recovery of S. epidermidis was58%while that of PSL was 62%. Meanwhile, 23% of S. epidermidis exited through outlet 2 and 19% of PSL exited through outlet 1. The purity of S. epidermidis for outlet 1 was 75.3% and the purity of PSL in outlet 2 was 72.9%
. Wall losses were 19%, for both bacteria and PSL. Although the purities of both S. epidermidis and PSL are acceptable, more investigation is needed to further increase recovery and decrease wall loss. Nonetheless, this methodology can give a fast and simple solution for increasing the detection accuracy of bacterial agents in air.
Figure 8. Fates of polystyrene latex (PSL) and Staphylococcus epidermidis through the analyzer. (Each measurement was repeated three times. Each data point presents the average and error bars present the standard deviation.)
So far, a methodology of real-time separation of aerosolized S. epidermidis and PSL particles of similar size was presented. These two species represented biological and non-biological particles, respectively. However, the suggested methodology faces with some difficulties for being used in field tests since particles with various species and sizes exist in natural environments and they could carry different levels of charges (both for biological and non-biological). In one of our previous studies (Mohamadi Nasrabadi et al. Citation2017), we found that a significant amount of indoor bioaerosols was in the size range of submicron. Therefore, it seems that our methodology can be applied to a situation where submicron biological and non-biological aerosol particles of similar size exist together after they are classified according to their aerodynamic diameters.
4. Conclusions
We introduced a new methodology to separate airborne bacterial and non-bacterial aerosols of similar size in real-time by exploiting the difference in their electrical mobilities. When S. epidermidis and PSL particles of ∼0.9 µm aerodynamic diameter and ∼1000 numbers/cm3 in concentration passed through a corona charger, they gained 88 and 57 elementary charges, respectively. They then entered a mobility analyzer with 0.55 cm/s flow velocity and were separated with 75.3% and 72.9% purities, respectively, when the electric field was 310 V/1.2 cm.
Funding
This research was supported by Bio Nano Health-Guard Research Center funded by the Ministry of Science, ICT & Future Planning (MSIP) of Korea as Global Frontier Project (HGUARD_2013M3A6B2078959), Basic Science Research Program through the National Research Foundation of Korea (NRF) funded by the Ministry of Science, ICT and future Planning (NRF-2015R1A2A1A01003890), and Korea Ministry of Environment (MOE) as the Technologies for Responding to Atmospheric Environment Policies Program.
References
- Agranovski, V., Ristovski, Z., Hargreaves, M., Blackall, P. J., and Morawska, L. (2010). Real-Time Measurement of Bacterial Aerosols with the UVAPS: Performance Evaluation. J. Aerosol Sci., 34:301–317.
- Ana, G. R., Fakunle, G. A., and Ogunjobi, A. A. (2013). Indoor Airborne Microbial Burden and Risk of Acute Respiratory Infections Among Children Under Five in Ibadan, Nigeria. Indoor Built Environ., 24:303–314.
- Aravind, T., Kumar, S. P., Raj, F., Karman, G., and Kumar, K. K. (2014). Design and Simulation Study of Polymer Coated Micro Filter for Detection of Airborne Particles. In Smart Structures and Systems: ICSSS 2014, IEEE, Chennai-India, pp. 134–137.
- Bogdanovic, J., Koets, M., Sander, I., Wouters, I., Meijster, T., Heederik, D., and Doekes, G. (2006). Rapid Detection of Fungal α-Amylase in the Work Environment with a Lateral Flow Immunoassay. J. Allergy Clin. Immunol., 118:1157–1163.
- Demers, A. M., Morency, P., Mberyo-Yaah, F., Jaffar, S., Blais, C., Somse, P., and Pepin, J. (2000). Risk Factors for Mortality Among Children Hospitalized Because of Acute Respiratory Infections in Bangui, Central African Republic. Pediatr. Infect. Dis. J., 19:424–432.
- Han, J. H., Heinze, B. C., and Yoon, J. Y. (2008). Single Cell Level Detection of Escherichia Coli in Microfluidic Device. Biosens.Bioelectron., 23:1303–1306.
- Hinds, W. C. (1999). Aerosol Technology: Properties, Behavior, and Measurement of Airborne Particles. John Wiley & Sons, New York.
- Hong, S. C., Kang, J. S., Lee, J. E., Kim, S. S., and Jung, J. H. (2015). Continuous Aerosol Size Separator using Inertial Microfluidics and Its Application to Airborne Bacteria and Viruses. Lab. Chip., 15:1889–1897.
- Hospodsky, D., Yamamoto, N., and Peccia, J. (2010). Accuracy, Precision, and Method Detection Limits of Quantitative PCR for Airborne Bacteria and Fungi. Appl. Environ. Microb., 76:7004–7012.
- Hoyert, D. L., and Xu, J. (2012). Deaths: Preliminary Data for 2011. National Vital Statistics Reports, 61:1–51.
- Jing, W., Zhao, W., Liu, S., Li, L., Tsai, C. T., Fan, X., and Sui, G. (2013). Microfluidic Device for Efficient Airborne Bacteria Capture and Enrichment. Anal Chem., 85:5255–5262.
- Jung, J. H., Lee, J. E., and Kim, S. S. (2009). Thermal Effects on Bacterial Bioaerosols in Continuous Air Flow. Sci. Total Environ., 407:4723–4730.
- Kärkkäinen, P. M., Valkonen, M., Hyvärinen, A., Nevalainen, A., and Rintala, H. (2010). Determination of Bacterial Load in House Dust Using qPCR, Chemical Markers and Culture. J. Environ. Monit., 12:759–768.
- Kim, M. G., Kim, Y. H., Kim, H. L., Park, C. W., Joe, Y. H., Hwang, J., and Kim, Y. J. (2010). Wall Loss Reduction Technique using an Electrodynamic Disturbance for Airborne Particle Processing Chip Applications. J. Micromech. Microeng., 20:035034.
- Lee, S. J., Park, J. S., Im, H. T., and Jung, H. I. (2008). A Microfluidic ATP-Bioluminescence Sensor for the Detection of Airborne Microbes. Sensor Actuat. B-Chem., 132:443–448.
- Lee, B. U., Yun, S. H., Jung, J. H., and Bae, G. N. (2010). Effect of Relative Humidity and Variation of Particle Number Size Distribution on the Inactivation Effectiveness of Airborne Silver Nanoparticles Against Bacteria Bioaerosols Deposited on a Filter. J. Aerosol Sci., 41:447–456.
- Liu, Y. S., Walter, T. M., Chang, W. J., Lim, K. S., Yang, L., Lee, S. W., and Bashir, R. (2007). Electrical Detection of Germination of Viable Model Bacillus Anthracis Spores in Microfluidic Biochips. Lab. Chip., 7:603–610.
- Mainelis, G., Willeke, K., Baron, P., Grinshpun, S. A., and Reponen, T. (2002). Induction Charging and Electrostatic Classification of Micrometer-Size Particles for Investigating the Electrobiological Properties of Airborne Microorganisms. Aerosol Sci. Technol., 36:479–491.
- Mohamadi Nasrabadi, A., Park, J. W., Kim, H. S., Han, J. S., Hyun, J., Yong, D., and Hwang, J. (2017). Assessment of Indoor Bioaerosols Using a Lab-Made Virtual Impactor. Aerosol Sci. Technol., 51(2):159–167.
- Moon, H. S., Nam, Y. W., Park, J. C., and Jung, H. I. (2009). Dielectrophoretic Separation of Airborne Microbes and Dust Particles using a Microfluidic Channel for Real-Time Bioaerosol Monitoring. Environ.Sci. Technol., 43:5857–5863.
- Pakkanen, T. A., Kerminen, V. M., Loukkola, K., Hillamo, R. E., Aarnio, P., Koskentalo, T., and Maenhaut, W. (2003). Size Distributions of Mass and Chemical Components in Street-Level and Rooftop PM 1 Particles in Helsinki. Atmos. Environ., 37:1673–1690.
- Park, J., Kim, C., Jeong, J., Lee, S. G., and Hwang, J. (2011). Design and Evaluation of a Unipolar Aerosol Charger to Generate Highly Charged Micron-Sized Aerosol Particles. J. Electrostat., 69:126–132.
- Park, C. W., Yoon, K. Y., Byeon, J. H., Kim, K., and Hwang, J. (2012). Development of Rapid Assessment Method to Determine Bacterial Viability Based on Ultraviolet and Visible (UV-Vis) Spectroscopy Analysis Including Application to Bioaerosols. Aerosol Air Qualit. Res., 12(3):395–404.
- Park, C. W., and Hwang, J. (2013). Susceptibility Constants of Airborne Bacteria to Dielectric Barrier Discharge for Antibacterial Performance Evaluation. J. Hazard. Mater., 244:421–428.
- Park, J. W., Park, C. W., Lee, S. H., and Hwang, J. (2015). Fast Monitoring of Indoor Bioaerosol Concentrations with ATP Bioluminescence Assay Using an Electrostatic Rod-Type Sampler. PloS One, 10:e0125251.
- Peccia, J., and Hernandez, M. (2006). Incorporating Polymerase Chain Reaction-Based Identification, Population Characterization, and Quantification of Microorganisms into Aerosol Science: A Review. Atmos. Environ., 40:3941–3961.
- Pérez, N., Pey, J., Querol, X., Alastuey, A., López, J. M., and Viana, M. (2008). Partitioning of Major and Trace Components in PM 10–PM 2.5–PM 1 at an Urban Site in Southern Europe. Atmos. Environ., 42:1677–1691.
- Sanchis, A., Brown, A. P., Sancho, M., Martinez, G., Sebastian, J. L., Munoz, S., and Miranda, J. M. (2007). Dielectric Characterization of Bacterial Cells using Dielectrophoresis. Bioelectromagnetics, 28:393–401.
- Stetzenbach, L. D., Buttner, M. P., and Cruz, P. (2004). Detection and Enumeration of Airborne Biocontaminants. Curr. Opin. Biotechnol., 15:170–174.
- Wang, Z., Reponen, T., Grinshpun, S. A., Górny, R. L., and Willeke, K. (2001). Effect of Sampling Time and Air Humidity on the Bioefficiency of Filter Samplers for Bioaerosol Collection. J. Aerosol Sci., 32:661–674.
- Yang, F., Ye, B., He, K., Ma, Y., Cadle, S. H., Chan, T., and Mulawa, P. A. (2005). Characterization of Atmospheric Mineral Components of PM 2.5 in Beijing and Shanghai, China. Sci. Total Environ., 343:221–230.
- Yoon, K. Y., Park, C. W., Byeon, J. H., and Hwang, J. (2010). Design and Application of an Inertial Impactor in Combination with an ATP Bioluminescence Detector for in situ Rapid Estimation of the Efficacies of Air Controlling Devices on Removal of Bioaerosols. Environ. Sci. Technol., 44:1742–1746.

