ABSTRACT
Planar two-dimensional two-color time-resolved laser-induced incandescence (2D-2C-TiRe-LII) is employed to investigate soot formation in a standard ethylene laminar diffusion flame. The time resolution of the 2D LII signal is realized by shifting the delay time of ICCD cameras. The two-color configuration is applied to measure the peak temperature of soot particles immediately after the laser pulse rather than using the energy balance to compute
. The Sauter mean diameter D32 and the corresponding distribution width parameter σ of the measured soot particles is extracted by using an error minimization method. The method shows that a range of possible geometry mean particle diameters and corresponding distribution width parameters are also possible solutions, and further information on realizable particle size distribution widths is necessary to narrow down the extracted diameter.
Copyright © 2017 American Association for Aerosol Research
EDITOR:
1. Introduction
Soot nanoparticles from combustion are hazardous to both environment and humans. Laser-induced incandescence (LII) has been recognized as a robust method for the measurement of soot volume fractions (Shaddix and Smyth Citation1996), and time-resolved LII (TiRe-LII) has been demonstrated as a suitable method for measurement of soot particle size (Melton Citation1984; Will et al. Citation1998; Bladh et al. Citation2007; Kock et al. Citation2006; Liu et al. Citation2006a; Cléon et al. Citation2011; Cenker et al. Citation2015b). In time-resolved LII (TiRe-LII), the decay rate of the signal arising from particle cooling, primarily via heat conduction and sublimation, can be used as a marker for the particle size. TiRe-LII has been usually limited to point measurements, where the signal and its decay over hundreds of nanoseconds are collected using photo-multiplier tubes (PMTs). In studies where LII is used for the determination of the soot volume fraction, a minimum fluence of the order of 0.2 J/cm2 at 532 nm (Schulz et al. Citation2006) is required to ensure all particles reach the same sublimation limit, and thus the same temperature, in TiRe-LII the energies used are lower, to avoid particle shrinking due to sublimation, thus contaminating the size measurements. In the absence of heat losses, a simple model for the energy balance during the particle heating period would suggest that the rate of temperature rise is independent of diameter. However, heat losses become relevant for smaller particles during the heating period, so that at low fluences, lower temperatures are reached by smaller particles. This has an effect in the calculation of the expected particle diameter from the LII signal decay curves, and it is therefore important to consider the peak temperatures reached in fitting models and experiments. This is addressed in Section 2. A planar version of TiRe-LII technique was first introduced by Will et al. (Citation1995), in which the temporal resolution was realized by capturing images with an ICCD camera at two different times during the cooling of the soot particles. Hadef et al. (Citation2013) followed the same approach as Will et al. (Citation1995), using 2D-TiRe-LII for particle sizing in a steady laminar diffusion ethylene flame, in which the measurement is resolved in time by shifting the gating time window of an intensified camera along the decay of the LII signal. A similar study was conducted by Cenker et al. (Citation2015b) under diesel-like conditions, using two time intervals and two cameras. Sun et al. (Citation2015) added four intensified cameras to the process to allow single shot sizing by using four intensified cameras gated at different times along the LII decay interval. In Will et al. (Citation1995) and Sun et al. (Citation2015)’s studies, a solution to the energy balance for a soot particle was used to estimate the peak particle temperature , is obtained based on an assumed value of the estimated soot absorption function, E(m) and the measured local fluence. An alternative to modeling is to measure
using two-color (2C) pyrometry based on Planck’s radiation function, as pursued by Snelling et al. (Citation2005) for a point measurement. Crosland et al. (Citation2010) also used a 2D2C-LII method for calibration-independent 2D soot volume fraction measurement. In that study, the LII signal was not time-resolved, and hence could be used for soot particle sizing. Cenker et al. (Citation2015b) used a 2D2C configuration to obtain 2D images of
across a spray flame. However, the 2D images of
and two LII images (along LII decay) were not obtained in a single spray event, so that LII fitting using pixel-to-pixel-corresponding
was not possible. Instead, an ensemble average
was used as the estimated uniform
across the whole spray in each spray event for further calculation. In the present study, the advantages of the 2D2C-LII and 2D-TiRe-LII techniques are combined to implement a 2D2C TiRe-LII method. The use of a 2D2C configuration allows an ensemble averaged 2D image of experimental measured
to be obtained based on Planck’s Law, rather than solving the particle energy balance, thus minimizing the uncertainty arising from estimates of E(m) and F required for determining the particle temperature history, and thus the corresponding diameter.
The study is realized by accepting the following constraints: (a) the assumption of steady state for the flame behavior, as the LII signal is are averaged over multiple shots of the gated ICCD camera; (b) the LII signal is averaged over the shortest feasible gating time of 20 ns around the peak LII signal. In the present study, a well-established TiRe-LII model and error minimization procedure for particle size estimation from the literature is used to extract measurements of particle temperature and diameter throughout the image of a standard ethylene flame. The model is briefly discussed in Section 2, with additional details and validation provided under Supplemental Material. The 2D2C-TiRe-LII measurement system is detailed in Section 3. The results and the sensitivity and uncertainty analysis are discussed subsequently. The estimated particle sizes and temperatures estimated using the present method are compared to results based on an energy balance. The quantitatively calibrated and normalized 2D LII images across the whole flame at two wavelengths (400 nm and 450 nm) are also produced in the form of a database as Supplemental Material.
2. Model
The LII model used in the present work is based on the comprehensive description in (Michelsen et al. Citation2007, Citation2015). Model inputs are the initial particle size D0 or mean particle size and distribution parameter σ, laser wavelength λl, particle complex index of refraction at the laser wavelength, m, laser fluence, F and normalized pulse shape, q(t), as well as the local gas temperature . Outputs are the particle temperature
and diameter D as a function of time, as well as the LII signal intensity at a given wavelength,
. In general, the model can be divided into two phases: (i) particle heating, before the peak LII signal, and (ii) particle cooling, after the peak LII signal. The peak particle temperature in the model is determined by the energy balance in the particle, which in the first phase is dominated by the absorption of laser energy. In the present study, peak particle temperatures are determined using the two-color method (Charwath et al. Citation2011) instead of solving the energy equation. The subsequent cooling process is modeled using established conduction, radiation and evaporation losses, including a model distribution for the particle diameter D based on a non-dimensional log-normal distribution width σ (Hadef et al. Citation2013). An error minimization procedure based on the work of Hadef et al. (Citation2013), which yields the final parameters. The model is detailed in the Supplemental Material. The details of the previously published models for particle heating and cooling, particle distribution and error minimization can be found in the original references as well as can be found as Supplemental Material. A further model for the gas temperature in the literature based on (Kent and Honnery Citation1990; Honnery and Kent Citation1990) and its validation based on data from Puri et al. (Citation1994) is also described in the Supplemental Material.
3. Experiment
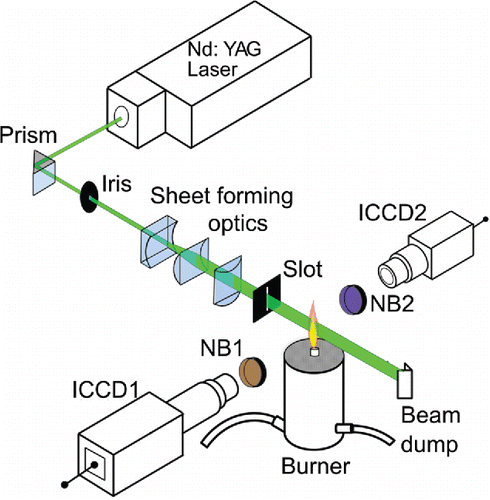
A top-hat spatial profile beam is formed by using a series of cylindrical lenses and a slot aperture starting from the beam of a Nd:YAG laser (Litron nanoPIV), with a wavelength of 532 nm, a pulsed FWHM = 5 ns as shown in .
Figure 1. Schematic of 2D-2C-TiRe-LII measurement set-up (B1: 400 ± 5nm band filter; NB2: 450 ± 5 nm band filter).
The signal detection system includes an ICCD camera (Lavision Nanostar) equipped a Nikon AF Micro Nikkor 60 mm lens 175 (f/2.8), and a CCD camera (Lavision Pro X 4M) with an intensifier (Lavision IRO9) imaged via a Nikon AF Micro Nikkor 60 mm lens (f/5.6). A 400 nm narrowband (NB) filter (Thorlabs FB400-10) and a 450 nm NB filter (Thorlabs FB450-10) were installed in front of the objectives on the ICCDs to collect LII signals at two different wavelengths. The wavelengths were selected based on the following criteria: (a) absence of interference from C2 clusters around 475, 518, and 560 nm (negligible within 400–456 nm (Goulay et al. Citation2009; Michelsen et al. Citation2015)); (b) absence of interference from red-shifted PAH LIF above 532 nm (red-shifted), which peaks around 550 nm for 532 nm excitation (Michelsen et al. Citation2015); (c) maximization of the camera sensitivity and SNR, which becomes worse below 400 nm; (d) known relative ratios of index of refraction at each wavelength, so as to support the two-color ratio method. The use of 1064 nm for particle heating can avoid the interference from PAH LIF (Liu et al. Citation2009), allowing a wider range of wavelengths to be used, and thus better accuracy in the determination of peak temperature. In the present study, 532 nm is used for excitation, often a preferred choice due to the visible beam, so the selection falls to the combination of 400/450 nm, which is close to the values used by Wendler (Citation2006) in their previous study (390/450 nm). The top-hat profile of the laser sheet was carefully calibrated using the method described in a previous study (Tian et al. Citation2015), with less than 2.5% fluctuation of the averaged intensity and 1% spatial deviation from the mean. A laser fluence of 0.17 J/cm2 is used for LII signal excitation to optimize the signal-to-noise ratio and minimize sublimation (see Supplementary Material).
Three different series of images were taken (200 images for each series) to accommodate the length-to-width ratio of the flames, with images connecting at heights of 33 and 66 mm. The maximum signal-to-noise ratio (peak signal counts to dark signal counts) is around 300. The spatial resolution in the diameter analysis corresponds to 0.1 × 0.1 mm2, with a laser sheet thickness of 0.3 mm. To obtain the ratio between the absolute signal intensities at the two detection wavelengths for the calculation of , a tungsten lamp (Thorlabs QTH10B) was used to quantitatively calibrate the two cameras, as described in the Supplementary Material. LII signals from this flame were used to determine fv after calibration using extinction measurements, as described in Tian et al. (Citation2015). The burner consists of an ethylene diffusion flame jet described in a previous study (Tian et al. Citation2015), with a jet diameter of 10.5 mm, surrounded by a co-flow of dry air over a diameter of 96.8 mm, at a mean velocity of 4.43 cm/s. The ethylene flame operating conditions correspond to Case B described in a previous study (Tian et al. Citation2015), with a fuel flow of 0.22 slpm and air flow of 38.2 slpm.
4. Results and discussion
4.1. Estimation of  and σ
and σ
The temporal evolution of the LII signal from the mid-region of the diffusion flame (33–66 mm) is shown in for the two selected wavelength bands around 400 and 450 nm, respectively.
Figure 2. Temporal evolution of the LII signal at 400 nm and 450 nm. Interval start times are marked in each image.
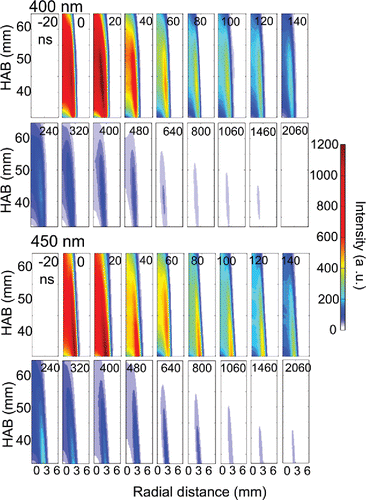
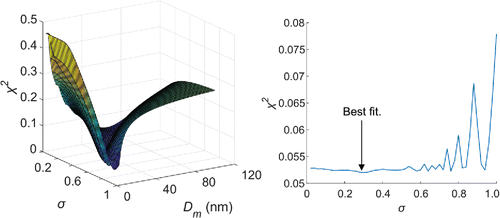
shows that the peak LII signals measured at both 400 nm and 450 nm both appear in the images taken 20 ns after the laser pulse arrives at the flame, which is adopted as time zero. Soot particles are heated by the laser beam, and their temperatures reach a peak shortly after the peak of the laser pulse, between 0 and 10 ns. The minimum gating time of the intensifier is 20 ns, and the first image taken after the beam arrival, between 20 and 40 ns, is taken for determination of the starting temperature prior to cooling. Given that the characteristic time span for soot particle cooling is normally several hundreds to several thousands of nanoseconds, the choice of the initial time for determining the temperature does not greatly affect the later diameter estimation based on the cooling rate. The soot concentration and LII signal intensity peak in the annular region at intermediate HABs adjacent to the central area of the flame, as is clear from the 2D image composites. To evaluate the particle size and distribution over the 2D diffusion flame using error minimization, a square mesh grid of 0.1 mm × 0.1 mm was used. In the present work, two locations were chosen to evaluate the primary particle sizes. Location A was chosen at HAB = 38 mm and r = 2.2 mm, where the maximum soot volume fraction appears, while location B was chosen at HAB = 42 mm and r = 0 mm because this is one of the well-characterized standard locations for this flame (Hadef et al. Citation2013). The diameter distribution of soot particles at each probe volume was assumed to obey a lognormal distribution, so that the particle size at each location can be described by a pair of parameters and σ. The square error χ2 between model and experiment was performed for each pair, for time intervals from 20 ns to 1060 ns for both locations A and B at the wavelength of 400 nm. The details of the method can be found in the Supplementary Material. At locations A and B, the estimation of σ covered the range from 0.01 to 1, with a 0.01 step. In the case of
, the range for location A was chosen from 0 to 50 nm with a 1 nm step, and for location B from 0 to 200 nm with a 2 nm step. The range selection for each parameter at the different locations was based on previous studies (Wang Citation2011; Hadef et al. Citation2013).
shows the calculated error χ2-distribution over the whole σ range for locations A and B. A minimizing valley can be observed in each map, which is indicated by the dashed white line.
Figure 3. Colour maps of the maximum likelihood estimators χ2 value as a function of the distribution width σ, and the median diameter Dm for location A: HAB = 38 nm and r = 2.2 mm and B: HAB = 42 mm and r = 0 mm. The best fit value is shown in each figure.
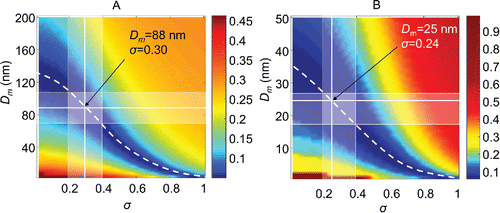
A mathematical minimum exists for χ2-values as a function of and σ along each valley, which are
nm, σ = 0.30) for location A and
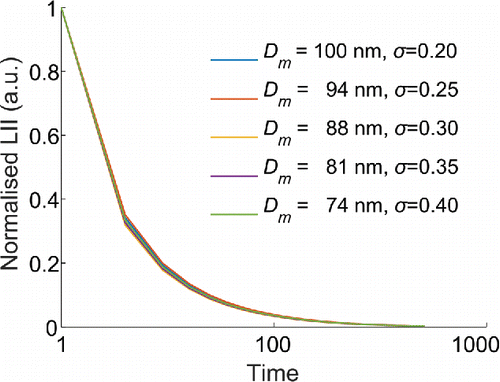
nm, σ = 0.24) for location B. However, there is no clear absolute minimum (), so that corresponding pairs of
can give almost identical reconstructed LII decay curves, as shown in .
Curves for the LII signal plotted for a range of values of pairs, including two most extreme cases σ = 0.2 and σ = 0.4, show that the curves are indistinguishable. This occurs because all of the solutions of
in the valley share a narrow distribution of Sauter mean diameters D32 (Sipkens et al. Citation2013; Liu et al. Citation2006b), which is related to the mean diameter and distribution parameter via:
(1)
This means that the present method is well defined to determine the Sauter mean diameter, which is a measure of surface to volume ratio, but less suited to measure mean particle size or distribution. To obtain a well-defined range of solutions, Liu et al. developed an approach to estimate the particle size distribution based on the decay of the effective temperature. They identified that the initial temperature decay rate of particle ensembles near the peak temperature is inversely proportional to D32 for the poly-disperse primary soot particles, whereas the rate of temperature change at later times is more sensitive to particle size distribution width, allowing the value of σ to determine from the decay at later points in time (Liu et al. Citation2006b). Similar two-time-interval fitting method was also suggested by Cenker et al. (Citation2015a). However, this approach is not suitable to the present study, because the SNR is low for most of the locations in the flame at the later time points. However, it is still possible to try this method at location A in the flame, at the position of maximum SNR. We applied the minimum error procedure for the signals from 0–120 ns (early interval) as well as 120–1060 ns (later interval). The results were compared with whole time-interval fitting. All three intervals yield very close D32 (110–111 nm), which means they lie in the same valley of the χ2 map. This is consistent with the vprevious discussion. However, the values of σ for the early-interval fitting (σ = 0.07) and the later interval fitting (σ = 0.60) fall out of the normal range of sensible distribution widths. The early-interval fitting tends to yield a distribution with large =109 nm and small σ = 0.07 (narrower distributions), while the late-interval fitting tends to give small
= 45 nm and larger σ = 0.60 (wider distributions). This may be caused by the effect that the signal and temperature decay of soot particles at later times is dominated by the distribution width rather than median value of particle size, as Daun et al. (Citation2007) suggested. To quantitatively address this problem, further work is needed and is not within the scope of the present study. In this article, we just report the value of D32 and a pair of mathematical minimum values in the valley. We note that D32 is not affected by the choice, as it reflects the surface to volume ratio, and therefore should be a preferred quantity extracted by this method, rather than
and σ. As an alternative, one can consider narrowing down the range of solutions for values of σ typically measured by other methods, within range of 0.2–0.4 (Oltmann et al. Citation2012; Xu et al. Citation1997), which also confines the acceptable range of
. The estimated best-fit value and range of potential solutions at locations A and B are shown in and .
Table 1. Best-fit value and range of and σ at locations A and B.
shows the calculated (lines) and experimental (symbols) values of the LII signal as a function of time for the two locations A (HAB = 38 mm and r = 2.2 mm) and B (HAB = 42 mm and r = 0 mm) selected, using best-fit parameters: = 25 nm and σ = 0.24 for location A , and
= 88 nm and σ = 0.3 for location B.
Figure 6. Normalised LII signal at 400 nm as a function of time at flame locations A and B. The best fit of experimental LII signals at the two different locations was found by 2-parameter fitting.
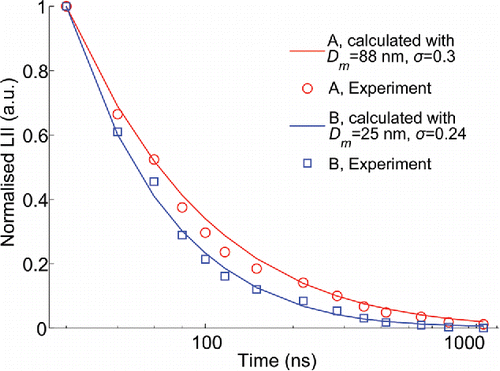
Using this constraint, the mean particle sizes found in at location A at the edge of the flame are found to be smaller than those at the centerline near the peak temperature central region location B. This would be expected based on the longer residence times at high temperatures in the pyrolytic environment surrounding point B, relatively to the nascent soot diameters from the outer regions at A.
The experimental and best-fit LII signals are compared for the optimal parameter set at position B, using the peak temperature determined from the 2C method in .
Figure 7. Measured LII signal at 400 nm (blue symbols, right scale), model LII using minimum error method for mean diameter and its distribution, as well as 2C method for peak temperature (solid blue line). Measured particle temperature T (red squares, left scale) using the two colour method; modelled T starting from the 2C peak measurement Tp = 3181 K.
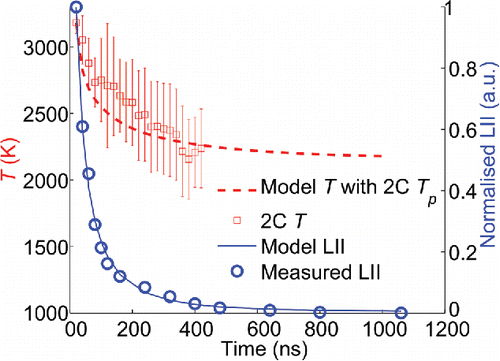
Using the peak temperature, it is possible to obtain the model decay curve for the temperature based on the optimized parameters. The calculated particle temperature using the 2C method at for each time interval can be directly compared to the model temperature (red squares and dashed line, respectively) throughout the LII signal decay, for SNR larger than 3. The error bars represent the estimated uncertainties based on the LII signal and error propagation. The uncertainties of LII signal were obtained directly from the standard deviation over 300 LII images at each gating delay time. Clearly another source of uncertainty in the 2C method to predict particle temperatures throughout the signal decay is the fact that each point on the curve represents an average signal over the representative time window. The fourth-power dependence of the signal on temperature means that the integral is always biased towards the earlier times, which may lead to an overestimation of the rate of temperature decay and hence an underestimation of the particle size.
(left) shows the map for the estimated peak temperature, , calculated for the flame tested using the 2C method. Some lines are omitted in the
map due to the low signal intensity at the edge of the laser sheet, where the soot particles in the region are not sufficiently heated.
Figure 8. Calculated Tp with the 2C method (left); estimated Dm with the 2-parameter fit (middle); measured fv in the tested flame (right) (Tian et al., Citation2015).
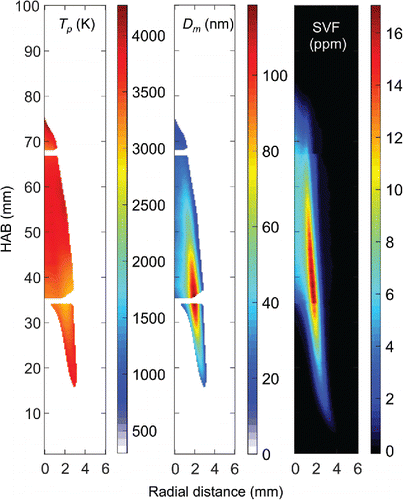
The map indicates large variations in the peak temperature
throughout the flame. The highest apparent peak temperatures appear at the edges of the flame, and the lowest at the center line. These findings are consistent with previous work using 2D auto-compensating (calibration-independent) LII (2D-AC-LII) in diffusion flames (Crosland et al. Citation2010), which are explained as a combination of several factors: (a) greater heat loss for smaller particles via surface heat conduction during the heating process; (b) non-uniform
distribution within the flame; (c) local laser fluence variation due to an imperfect laser profile. As shown in , soot particles on the edge of the laser sheet are not sufficiently heated, and the corresponding data are not included in the data processing. The relatively wide variations in the measured
in the flame suggest that 2D pyrometry is needed to reduce the error of TiRe-LII caused by uncertainties in
. also shows the locally optimum mean diameter
calculated across the whole flame using the mathematical minimum, and assuming the peak temperature values obtained from the 2C method. These values have an approximate uncertainty of 30% based on the region of the valley compatible with the minimum error, as well as realistic distribution parameters σ within 0.2–0.4 (Michelsen et al. Citation2015; Oltmann et al. Citation2012; Xu et al. Citation1997). The values of volume fraction were obtained in a separate study at significantly higher fluences (0.26 J/cm2 relatively to 0.17 J/cm2 in the present study) to reach uniform soot temperatures (Tian et al. Citation2015), as usual for LII concentration measurements. The issue is extensively discussed by Schulz et al. (Citation2006).
The smallest estimated diameters are in the region surrounding the flame: at the inner edge, the particles grow via pyrolysis into larger particles; at the outer edge, the particles oxidize into smaller particles. These measurements are consistent with prior work by Hadef et al. (Citation2013). The full dataset for the distribution of across the flame can be found under Supplemental Materials. The distribution of fv obtained in a previous study using LII and extinction (Tian et al. Citation2015) shows a similar spatial distribution as the particle size. The SNR of the particle size measurements in some edge regions is very low. This is because: (a) the particles are very small and the signal decay is very sharp, making it difficult to resolve by the detectors with limited minimum gating time, or (b) the signal intensity is low (Hadef et al. Citation2013). In the present study, particle size measurements in regions with SNR < 3 are excluded. Overall, the lower size limit detectable with the present system is 10 nm.
The effect of choosing the 2C method to obtain the peak temperature instead of the usual solution of the energy balance is illustrated in (a), for HAB = 42 mm at the center line.
Figure 9. Top: Calculated particle temperature using 2C peak temperature Tp (dashed line) and full energy model (solid line) at HAB = 42 mm and r = 0 mm. Bottom: Corresponding normalised measured LII signal (symbols), modelled signal calculated from 2C TP and optimal Dm = 25 nm and σ = 0.24 (dashed line); full energy model T and optimal Dm = 34 nm and σ = 0.3 (solid line).
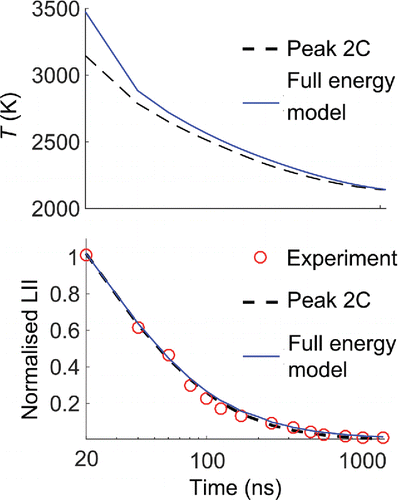
The energy balance method yields = 34 nm and σ = 0.3, and the 2C method results in a minimum error at
= 25 nm and σ = 0.24. The temporal evolution of the particle temperature is reconstructed using the optimal values for
and σ, according to the exponential decay Eq. (S.37) in the supplemental material. The value of
calculated at 20 ns is 3451 K for the energy balance method using E(m) = 0.26 of soot, laser fluence F = 0.17 J/cm2 and laser pulse duration of 5 ns. The value of
obtained from the model is higher than the 2C estimate of
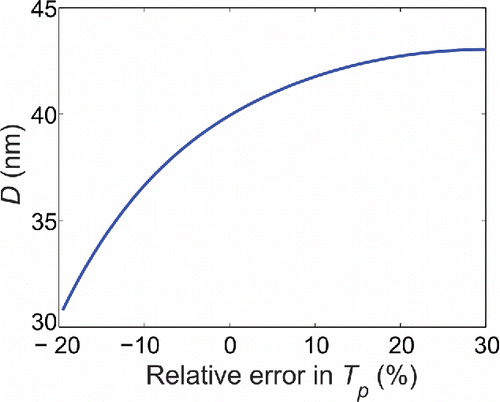
K. The 10% higher modeled peak temperature requires a 36 % larger optimum diameter to yield the same normalized LII signal, because the higher decay rate must be balanced by a lower surface to volume ratio. The sensitivity of the final error-minimizing diameter to the peak temperature is illustrated in . Large discrepancy between the two methods indicates that proper estimation of the characteristic optimal cooling diameter representative of the particle size depends on an accurate estimation the soot particle size, via 2C or other method.
5. Conclusions
In this study, we have combined the 2D-TiRe-LII technique with the 2C-LII technique to allow both peak temperature and soot primary particle sizes to be determined in an ethylene diffusion flame. The temporal resolution of the LII decay curve is achieved by shifting the delay time of the ICCD cameras in 20 ns steps. The results were employed to determine the particle sizes in a low-sooting ethylene flame. By using a minimum error method, an optimal solution for the Sauter mean diameter, or a pair of mean particle diameter and its distribution can be obtained. The uncertainties are associated with a long valley of minimal error along diameter and its distribution width, so that other possible distributions share a similar Sauter mean diameter D32 with the optimal value. Comparisons with previous results obtained using other techniques show good agreement of the estimated range of particle size. The use of the 2C method can reduce uncertainties related to the energy model associated with the use of the absorption function of soot particles. However, the relatively long integration time means that additional uncertainties arise. The results of the 2C method lead to consistently lower measured temperatures than the energy balance method, possibly due to the camera integration interval. Nevertheless, this is the limit of what is achievable using imaging methods. The map of measured with 2C pyrometry indicates that even when a near top-hat profile laser sheet is used, the apparent variation in of the peak temperatures reached by the incandescing particles within the flame may be as large as 300 K. This large variation can directly translate into inaccuracies in diameter estimates. The advantage of the method is the creation of a 2D map of particle size for the whole region. After considering the detailed uncertainties in the inversion algorithms, direct comparison of results directly with the LII signal for the two colors considered may be more accurate than direct comparisons with the final temperature and diameter maps.
UAST 1366644 Supplementary Materials.zip
Download Zip (8.1 MB)Funding
B. Tian and C. Zhang were funded through a fellowship provided by the China Scholarship Council. Y. Gao was funded through grant EPSRC EP/K02924X/1.
References
- Bladh, H., Johnsson, J., and Bengtsson, P.-E. (2007). On the Dependence of the Laser-Induced Incandescence (LII) Signal on Soot Volume Fraction for Variations in Particle Size. Appl. Phys. B, 90:109–125.
- Cenker, E., Bruneaux, G., Dreier, T., and Schulz, C. (2015a). Determination of Small Soot Particles in the Presence of Large Ones from Time-Resolved Laser Induced-Incandescence. Appl. Phys. B Lasers Opti., 118:169–183.
- Cenker, E., Kondo, K., Bruneaux, G., Dreier, T., Aizawa, T., and Schulz, C. (2015b). Assessment of Soot Particle-Size Imaging with LII at Diesel Engine Conditions. Appl. Phys. B, 119:765–776.
- Charwath, M., Suntz, R., and Bockhorn, H. (2011). Constraints of Two-Colour TiRe-LII at Elevated Pressures. Appl. Phy B, 104:427–438.
- Cléon, G., Amodeo, T., Faccinetto, A., and Desgroux, P. (2011). Laser-Induced Incandescence Determination of the Ratio of the Soot Absorption Functions at 532 nm and 1064 nm in the Nucleation Zone of a Low Pressure Premixed Sooting Flame. Appl. Phys. B, 104:297–305.
- Crosland, B. M., Johnson, M. R., and Thomson, K. a. (2010). Analysis of Uncertainties in Instantaneous Soot Volume Fraction Measurements using Two-Dimensional, Auto-Compensating, Laser-Induced Incandescence (2D-AC-LII). Appl. Phys B, 102:173–183.
- Daun, K., Stagg, B., Liu, F., Smallwood, G., and Snelling, D. (2007). Determining Aerosol Particle Size Distributions using Time-Resolved Laser-Induced Incandescence. Appl. Phys. B, 87:363–372.
- Goulay, F., Schrader, P., Nemes, L., Dansson, M., and Michelsen, H. (2009). Photochemical Interferences for Laser-Induced Incandescence of Flame-Generated Soot. Proc. Combus. Inst., 32:963–970.
- Hadef, R., Geigle, K. P., Zerbs, J., Sawchuk, R. A., and Snelling, D. R. (2013). The Concept of 2D Gated Imaging for Particle Sizing in a Laminar Diffusion Flame. Appl. Phys. B, 112:395–408.
- Honnery, D. R. and Kent, J. H. (1990). Soot Formation in Long Ethylene Diffusion Flames. Combus. Flame, 82:426–434.
- Kent, J. H. and Honnery, D. R. (1990). A Soot Formation Rate Map for a Laminar Ethylene Diffusion Flame. Combus. Flame, 79:287–298.
- Kock, B., Tribalet, B., Schulz, C., and Roth, P. (2006). Two-Color Time-Resolved LII Applied to Soot Particle Sizing in the Cylinder of a Diesel Engine. Combus. Flame, 147:79–92.
- Liu, F., Daun, K., Beyer, V., Smallwood, G., and Greenhalgh, D. (2006a). Some Theoretical Considerations in Modeling Laser-Induced Incandescence at Low-Pressures. Appl. Phys. B, 87:179–191.
- Liu, F., Snelling, D. R., Thomson, K. A., and Smallwood, G. J. (2009). Sensitivity and Relative Error Analyses of Soot Temperature and Volume Fraction Determined by Two-Color LII. Appl. Phys. B Lasers and Opti., 96:623–636.
- Liu, F., Stagg, B. J., Snelling, D. R., and Smallwood, G. J. (2006b). Effects of Primary Soot Particle Size Distribution on the Temperature of Soot Particles Heated by a Nanosecond Pulsed Laser in an Atmospheric Laminar Diffusion Flame. Int. J. Heat Mass Trans., 49:777–788.
- Melton, L. A. (1984). Soot Diagnostic Based on Laser Heating. Appl. Opti., 23:2201–2208.
- Michelsen, H., Liu, F., Kock, B., Bladh, H., Boiarciuc, A., Charwath, M., Dreier, T., Hadef, R., Hofmann, M., Reimann, J., Will, S., Bengtsson, P.-E, Bockhorn, H., Foucher, F., Geigle, K.-P, Mounaïm-Rousselle, C., Schulz, C., Stirn, R., Tribalet, B., and Suntz, R. (2007). Modeling Laser-Induced Incandescence of Soot: A Summary and Comparison of LII Models. Appl. Phys. B, 87:503–521.
- Michelsen, H., Schulz, C., Smallwood, G., and Will, S. (2015). Laser-Induced Incandescence: Particulate Diagnostics for Combustion, Atmospheric, and Industrial Applications. Progr. Energy Combus Sci., 51:1–47.
- Oltmann, H., Reimann, J., and Will, S. (2012). Single-Shot Measurement of Soot Aggregate Sizes by Wide-Angle Light Scattering (WALS). Appl. Phys. B: Lasers Opti., 106:171–183.
- Puri, R., Santoro, R. J., and Smyth, K. C. (1994). The oxidation of soot and carbon monoxide in hydrocarbon diffusion flames. Combus. Flame, 97:125–144.
- Schulz, C., Kock, B. F., Hofmann, M., Michelsen, H., Will, S., Bougie, B., Suntz, R., and Smallwood, G. J. (2006). Laser-induced incandescence: recent trends and current questions. Appl. Phys. B, 83:333–354.
- Shaddix, C. R. and Smyth, K. C. (1996). Laser-Induced Incandescence Measurements of Soot Production in Steady and Flickering Methane, Propane, and Ethylene Diffusion Flames. Combus. Flame, 107:418–452.
- Sipkens, T. A., Mansmann, R., Daun, K. J., Petermann, N., Titantah, J. T., Karttunen, M., Wiggers, H., Dreier, T., and Schulz, C. (2013). In Situ Nanoparticle Size Measurements of Gas-Borne Silicon Nanoparticles by Time-Resolved Laser-Induced Incandescence. Appl. Phys. B: Lasers Opti., 116:1–14.
- Snelling, D. R., Smallwood, G. J., Liu, F., Gülder, O. L., and Bachalo, W. D. (2005). A Calibration-Independent Laser-Induced Incandescence Technique for Soot Measurement by Detecting Absolute Light Intensity. Appl. opti., 44:6773–6785.
- Sun, Z., Gu, D., Nathan, G., Alwahabi, Z., and Dally, B. (2015). Single-Shot, Time-Resolved planar Laser-Induced Incandescence (TiRe-LII) for Soot Primary Particle Sizing in Flames. Proce. Combus. Inst., 35:3673–3680.
- Tian, B., Gao, Y., Balusamy, S., and Hochgreb, S. (2015). High Spatial Resolution Laser Cavity Extinction and Laser-Induced Incandescence in Low Soot Producing Flames. Appl. Phys. B, 120:469–487.
- Wang, H. (2011). Formation of Nascent Soot and other Condensed-Phase Materials in Flames. Proce. Combus. Inst., 33:41–67.
- Wendler, M. (2006). Temperature Measurements for LII Evaluation in Non-Premixed Flames - Comparison between Emission Spectroscopy and CARS. In CEUR Workshop Proceedings, Vol. 211, p. 16.
- Will, S., Schraml, S., Bader, K., and Leipertz, A. (1998). Performance Characteristics of Soot Primary Laser-Induced Incandescence. Appl. Phys. B, 37.
- Will, S., Schraml, S., and Leipertz, A. (1995). Two-Dimensional Soot-Particle Sizing by Time-Resolved Laser-Induced Incandescence. Opti. Lett., 20:2342–2344.
- Xu, F., Sunderland, P. B., and Faeth, G. M. (1997). Soot Formation in Laminar Premixed Ethylene/air Flames at Atmospheric Pressure. Combus. Flame, 108:471–493.

