
 ?Mathematical formulae have been encoded as MathML and are displayed in this HTML version using MathJax in order to improve their display. Uncheck the box to turn MathJax off. This feature requires Javascript. Click on a formula to zoom.
ABSTRACT
Partial flow dilution (PFD) offers a number of benefits relative to conventional full flow dilution tunnels for motor vehicle PM emissions measurement in terms of measurement variability, footprint, and cost. Its implementation into automotive emissions test cells depends on its ability to record PM mass emissions equivalent to the current constant volume sampling (CVS) dilution tunnel approach. The present work examines factors critical to successful application of PFD sampling and compares vehicle PM emissions measured simultaneously by PFD and CVS tunnel. The combination of a current technology commercial PFD system and ultrasonic flow meter fulfill the two principal requirements of accurate exhaust flow measurement and fast time response for proportional sampling. PM mass emissions measured by PFD versus CVS systems satisfy a 1.03 ± 0.03 regression for the regulatory FTP test cycle, and comparably good agreement for the supplemental US06 drive cycle. Both dilution approaches are amenable to the single filter approach newly allowed under EPA regulations; however, the PFD sample weighted approach has the capability to provide a roughly 35% lower variability relative to the flow weighted approach used in the CVS method. Whereas partial flow dilution has seen application in heavy duty engine measurements, the present work demonstrates its feasibility for light duty chassis dynamometer testing.
Copyright © 2018 Ford Motor Company
EDITOR:
Introduction
As motor vehicle particulate matter (PM) emissions standards become increasingly stringent, it is progressively more difficult to perform accurate measurements of gravimetric PM mass. Consequently, considerable effort is ongoing to evaluate the accuracy of filter based PM sampling at the current 3 mg/mi LEV III and Tier 3 standards and its suitability for the future LEV III level of 1 mg/mi (Hu et al. Citation2014; Jung et al. Citation2016, Citation2017a; Chang and Shields Citation2017). The problem is twofold: Unlike metal calibration weights, the filter media used to collect PM are subject to variability from gaseous adsorption, static charge and humidity (Chase et al. Citation2004; Chase et al. Citation2005). The necessity of subtracting pre and post filter weights to determine the collected PM mass compounds this variability. A number of opportunities to improve the gravimetric filter method are being investigated, including lower exhaust dilution ratios, higher filter face velocity, and the use of a single filter in place of the three traditionally used for emissions tests over the three phase US regulatory Federal Test Procedure (FTP) drive cycle (Jung et al. Citation2016, Citation2017a).
Another possible improvement to gravimetric PM mass measurement is the use of partial flow dilution. This option in lieu of a full flow constant volume sampling system (CVS) is amongst the changes introduced in the Code of Federal Regulations (CFR) 40 Parts 1065 (heavy duty) and 1066 (light duty vehicles) that govern US motor vehicle emissions measurements (EPA Citation2016a, Citation2016b). It is not currently allowed in the Worldwide harmonized Light vehicles Test Procedure (WLTP) owing to the lack of data comparing PFD to CVS based PM measurements, which partly motivates the present work. The CVS directs the entire vehicle exhaust into a dilution tunnel and then samples only a small fraction of the diluted mixture (<1%) through a filter to collect PM. In contrast, PFD proportionally samples and dilutes only the ∼1% of vehicle exhaust required by the filter. This affords the opportunity to optimize PM collection and reduce interference from contamination in addition to other practical benefits, including reduced cost and complexity. The methodology is currently being applied in heavy duty engine testing, but is largely untested for chassis dynamometer application.
Partial flow diluters have been used for over 20 years (Engeljehringer et al. Citation1993; Schweizer and Stein Citation2000), but early versions did not perform well under transient engine operation relative to the CVS tunnel. A detailed investigation by Khalek et al. (Citation2002) found that a limiting factor in PFD performance was the inability of the PFD to maintain a sample rate proportional to rapidly varying exhaust flow. The impending 2007 EPA heavy duty vehicle PM emissions standard of 10 mg/hp-hr motivated the development of faster electronics to control the inlet sample flow. When the Coordinating Research Council E66-phase 3 project re-evaluated PFD performance (Khalek Citation2007), the commercial instrument response times had improved to below 200 ms. All of the PFDs tested compared very well with the CVS tunnel at very low PM levels, below 10% of the 2007 standard. Some manufacturer specific deviations were found at emissions levels of 80% of the standard, but performance was sufficiently good that PFD use was incorporated into the CFR 40 Part 1065 heavy duty vehicle emissions regulations.
After a preliminary evaluation of two commercial partial flow diluters (Foote et al. Citation2013), we worked with one of the manufacturers to incorporate improvements needed for routine operation in Ford's light duty vehicle emissions test laboratories. The present paper describes the performance of this PFD system relative to the full flow CVS tunnel. We also discuss an improved strategy for single filter measurement of the FTP weighted average PM emissions made possible with partial flow dilution. This procedure reduces the amount of exhaust sampled during cold and hot start phases of the FTP cycle to achieve the required weighting instead of reducing the flow of dilute exhaust through filter, as done in the CVS approach. This increases the amount PM that can be collected onto the filter, which is an important enabler at very low PM emissions levels.
Two key elements are necessary for successful PFD performance, namely exhaust flow measurement and proportional exhaust sampling. To understand this, consider the relationship between full and partial flow dilution. The former collects the entire vehicle exhaust into a constant total flow of exhaust plus dilution air. Assuming good mixing, the PM mass emitted by the vehicle is Mcvs = mf * Fcvs/Ff, where mf is the net mass gain on the filter, and Fcvs and Ff are the CVS tunnel and filter flow rates, respectively. Knowledge of the vehicle exhaust flow rate is not needed; the critical requirement is to maintain a constant CVS tunnel flow. Imagine now that the CVS tunnel is divided into N sub tunnels, with N chosen such that the sub-tunnel flow rate equals the filter flow rate. We can “discard” the N-1 unused sub tunnels, but only if we ensure that the remaining sub-tunnel still receives 1/N of the exhaust flow. In practice the factor of 1/N is achieved by proportional sampling, whereby the PM mass emitted is given by Mcvs = mf * N. This in turn requires accurate exhaust flow measurement and rapid feedback to control of the PFD sample flow rate. After describing the experimental methods, we present results on these elements of partial flow dilution and then data on direct comparisons of PM mass recorded by PFD versus CVS tunnel.
Experimental method
Testing was performed at three chassis dynamometer sites in Ford's Allen Park Test Laboratory that have simultaneous CVS tunnel and partial flow dilution capability. These are equipped with 48 inch diameter single rolls dynamometers and have been upgraded to Part 1065 / 1066 standards. Vehicle exhaust is transported to the CVS tunnel through a flexible ∼10 meter, 10 cm i. d., heated, insulated, stainless steel transfer hose with interior surfaces maintained at 80°C. Dilution is provided by HEPA filtered room air that is conditioned to 27 ± 2°C and 8 ± 0.8 g/m3 absolute humidity. The CVS tunnels were operated at total flow rates excessive relative to Part 1066 requirements; namely with average dilution factors of 30 or more, as compared to the stipulated 7 – 20 range. The reason is that the tests were run over the combined US Federal Test Procedure (FTP) and US06 portion of the Supplemental FTP drive cycles. The CVS total flow was set to provide a safety margin against water condensation during the US06 cycle. Because of the high exhaust volumes incurred during the US06 portion, this then causes over dilution of the exhaust during the FTP portion. This problem can be overcome to meet Part 1066 requirements by inserting a pause between FTP and US06 tests to allow switching the CVS tunnel between total flow rates optimized for each of the two test portions, but this capability was not available at the time.
A 2012 model year 2.0 L gasoline direct injection (GDI) light duty vehicle equipped with a three-way catalyst was used in this study. It was fueled with Tier 2 certification fuel with ∼10 ppm sulfur. This is a mid-age, properly maintained, test vehicle with PM emissions that are >80% soot, as is typical of current GDI technology. It was chosen because of its stable ∼10 mg/mi PM emissions rate.
Vehicle exhaust flow is measured with an ultrasonic meter (SICK Flowsic150 Carflow) (Guenther et al. Citation2003; Kupnik et al. Citation2004). It is located about 10 meters downstream of the tailpipe at the entrance of the CVS tunnel. Upon entering the meter, the exhaust first passes through a combination flow straightener and heater, which maintains a minimum 110°C to avoid water condensation. All other interior surfaces in the flow path of the Carflow are similarly maintained at 110°C. The flow rate is determined from the differential transit time of ultrasonic pulses that traverse the exhaust along four different paths. The multiple path approach enables accurate measurements even under non-ideal flow conditions. The ultrasonic meter has an internal diameter of 12.7 cm and is oriented vertically to reduce thermal stratification and buoyancy-driven flows that can arise from temperature gradients in horizontal tubes. The exhaust is sufficiently incompressible under CVS conditions that no physical delay arises because of the distance between vehicle and flow meter; however, there is a short, 0.7 s, delay internal to the ultrasonic meter.
Partial flow dilution is performed with the AVL Smart Sampler SPC478. It samples a small proportional fraction of the exhaust flow (∼1%) and mixes it with dry, HEPA filtered, compressed air into a 0.8 m long, 3.5 cm diameter, mini-tunnel at a total flow of 0.057 standard m3/min. This diluted exhaust passes through 47 mm diameter Teflon membrane filters at a face velocity of 92 cm/s. The filters are held at 47 ± 5°C per Part 1065 requirements.
The SPC478 is divided into two cabinets: a main cabinet containing the major electrical and mechanical parts and the filter cabinet, which includes the mini-tunnel and filter housing. The latter cabinet is suspended from an overhead rail system such that the probe inserts into the transfer hose approximately 1.5 meters downstream of the tailpipe, which is about 8 meters upstream of the exhaust flow meter. This arrangement maintains a fixed alignment between the PFD sample probe and transfer hose as the latter is moved to accommodate different size vehicles, positions of the tailpipe, etc. The probe consists of a 0.95 cm tube that faces into the exhaust flow near the centerline of the 10 cm diameter transfer hose. Proportional sampling is maintained by an analog signal from the ultrasonic exhaust flow meter.
The same Teflon membrane filter media are used for both the PFD and CVS systems (MTL PT47). The filters are exposed to ions from a 210 Po source and the weigh chamber is enclosed in a Faraday cage to neutralize the effects of static charge. Filters are robotically weighed before and after the emissions test in a Part 1065 compliant weigh room and the mass is buoyancy corrected. An estimated 4 μg gaseous adsorption correction is applied to the net PM mass recorded for each filter. The controlled filter weighing procedures prescribed by CFR 40 Part 1065 reveal that tunnel blanks exhibit a small, few microgram, and highly variable, 100–200%, gaseous adsorption associated with Teflon membrane filters (Chase et al. Citation2004; Jung et al. Citation2016). Because of the high variability, EPA Part 1066 regulations allow subtracting a facility average background mass of up to 5 µg per filter.
In addition to sampling filters in parallel by PFD and CVS, an AVL Micro Soot Sensor (MSS) is used to provide corroborating data. It samples dilute exhaust from the CVS tunnel. The MSS measures black carbon (BC) mass by photoacoustic detection of light absorption at 808 nm (Schindler et al. Citation2004). For GDI vehicles driven over the FTP cycle, PM mass measured by the MSS correlates very well with gravimetric data. The regression slope is approximately 0.8, consistent with a ∼20% organic component of the total PM (Khalek et al. Citation2010; Maricq et al. Citation2016).
Results
Exhaust flow measurement and PFD proportionality
Two factors are critical to the performance of partial flow dilution: (1) accurate exhaust flow measurement and (2) rapid time response proportional exhaust sampling. compares the exhaust flow measured by ultrasonic flow meter from a 2.0 L gasoline turbocharged direct injection (GTDI) vehicle to values recorded via the conventional CVS tunnel approach. CVS determination of exhaust flow is commonly accomplished using critical flow venturis to measure dilution and total flows (Anderson et al. Citation1974) or the CO2 tracer method (Wiers and Scheffler Citation1972). Here we use the latter approach. The tracer method is well suited for stoichiometric gasoline engine exhaust measurement because the CO2 concentration remains constant over most engine operating conditions, and this avoids uncertainties arising from time alignment. It is typically about 13%, but the exact value depends on fuel composition. The ratio of CO2 in the raw exhaust versus CVS tunnel gives the second by second dilution factor. This times the CVS total flow rate equates to vehicle exhaust flow.
Figure 1. Second by second regression of ultrasonic versus CO2 tracer measurements of vehicle exhaust flow rate over the combined FTP + US06 drive cycle. The inset compares the time response of the ultrasonic flow meter to the CO2 tracer method over a 45 s portion of the US06 cycle.
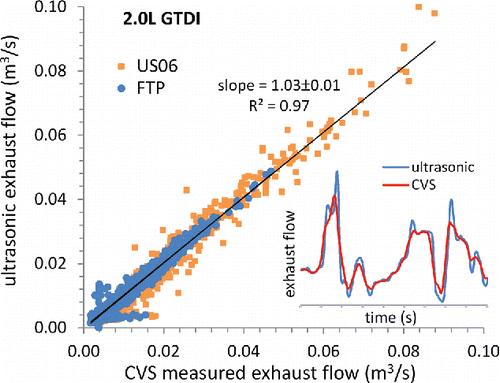
The correlation between ultrasonic and CO2 tracer measures of exhaust flow is quite good. The slope is 1.03 ± 0.01 and the correlation coefficient is R2 = 0.97 for the combined FTP + US06 drive cycle. A closer look reveals that there is more scatter in the US06 than FTP flow rates. This arises form the faster time response of the ultrasonic flow meter relative to the CO2 tracer data. The inset in compares the two flow measurements over a portion of the US06 cycle. It shows how CO2 tracer underestimates the peaks and valleys in exhaust flow during the sharp accelerations and decelerations of the US06. This time response difference also contributes to data scatter in the FTP exhaust flows, but to a lesser extent.
Some additional discrepancies are apparent at low exhaust flow rates in . These are associated with difficulty using CO2 as a tracer during initial engine startup and during periods of fuel shutoff, such as vehicle deceleration, when CO2 is not present or is not representative of complete combustion. Note that neither this issue nor the time response of the tracer method affect the accuracy of CVS tunnel PM measurement, because as mentioned above, exhaust flow rate in this case does not enter into the determination of emission rates.
Given accurate exhaust flow measurement, the second requirement for partial flow dilution is the ability to sample proportionally from a rapidly varying exhaust flow. demonstrates that current PFD technology can do this very well, including over the aggressive US06 drive cycle. It plots the inlet sample flow rate for each of the four test phases against the vehicle exhaust flow rate. The AVL partial flow diluter determines its inlet flow rate from the difference between the total mini-tunnel flow maintained through a smooth approach orifice and the dilution air flow introduced via a laminar flow element.
Figure 2. Proportionality of sample flow rate into the PFD versus the 2.0 L GTDI vehicle exhaust flow rate for each phase of the FTP + US06 cycle.
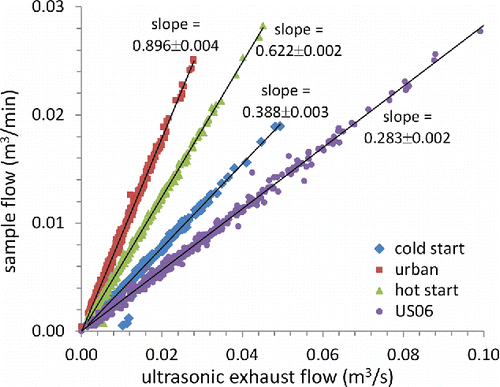
In this example, each phase of the FTP + US06 test is set to sample a different fraction of the total exhaust, producing the four observed regression slopes. This ability provides the means to “sample weight” single filter measurement of FTP cycle average PM emissions, which is described further below. The correlation coefficients are all >99% and the 95% confidence intervals are <1% of the slopes, indicating tight adherence to proportionality. There are only 7 outlier points. Three represent the first 3 s of the cold start and the other four occur in the US06 cycle. Equally good results, >99% R2, are found for larger displacement engines, e.g., 3.5 L, where the exhaust flow rate extends to 0.25 m3/s.
One small issue not apparent from and is that the ultrasonic meter exhibits a short, ∼0.7 s delay in the exhaust flow, which then causes the same delay in exhaust sampling. This is obscured in by the larger time alignment adjustment needed to account for the sample delay in CO2 tracer measurement of exhaust flow. Nor is it visible in , since this plots how well the PFD responds to changes in the ultrasonic meter's output, whereas the delay occurs before the signal reaches the PFD. However, as demonstrated below, this short delay does not have an observable impact on PM measurement, likely because of dispersion of PM along the flow axis as it travels from engine to sample point.
PM mass emissions: PFD vs. CVS
Because engine exhaust PM mass emissions are operationally defined by the measurement conditions established in CFR Part 1065 and 1066 regulations (EPA Citation2016a,Citationb), bottom line demonstration of PFD acceptability hinges on demonstrating equivalence with the currently accepted CVS tunnel method. The answer is that partial flow dilution produces equivalent results, but as the ensuing discussion explains, demonstrating this is somewhat tricky owing to the high variability prevalent in low level PM emissions measurements. The overall agreement between PFD and CVS approaches is illustrated in . This compares PM mass recorded simultaneously by the two methods for each of the three FTP phases from 33 vehicle tests at two chassis dynamometer sites. Emissions in the 10 – 20 mg/mi range represent the cold start phase, whereas those below 5 mg/mi are from the urban and hot start phases.
Figure 3. The main graph displays regressions of gravimetric PM mass emissions measured via PFD versus CVS tunnel. Data from 15 tests in cell A and 18 tests in cell B are plotted separately for each phase of the FTP cycle. The inset provides an expanded view of PM emissions in the 3 mg/mi range. The lower graph displays the residuals.
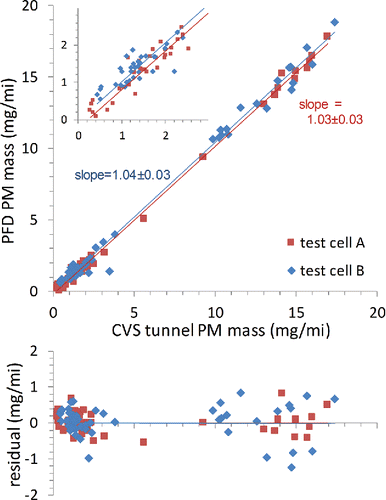
The data demonstrate very good correlation between PFD and CVS sampling, with regression slopes of unity within 95% confidence intervals of ±3%. The bottom graph in shows that the residuals are evenly distributed about zero. Their magnitudes remains nearly constant over the 0−20 mg/mi emissions range. This indicates that the variability is absolute rather than proportional to the collected PM mass. In this case, a linear regression provides an unbiased assessment of the correlation between PFD and CVS methods. The principal contribution to the residuals is attributed to statistical uncertainty in CVS filter weights. The weighing uncertainty itself is the same for both PFD and CVS filters, but owing their high average dilution factors, CVS filter weights are scaled by a factor of about 3 more than PFD filters when calculating PM emissions rates.
The inset in displays the PFD to CVS correlation in the sub 3 mg/mi range relevant to LEV III and Tier 3 emissions standards. Here, the urban and hot start phase emissions from the GDI test vehicle serve as a surrogate for a vehicle meeting those standards. The correlations remain good, albeit with greater uncertainties. The regressions slopes, with 95% confidence intervals are 0.92 ± 0.12 and 0.81 ± 0.18. The uncertainties are expected to be higher since the PM mass collected is now closer to the level of weighing uncertainty. However, they are exacerbated by the high CVS average dilution factor, which makes the variability more reflective of sub 1 mg/mi than 3 mg/mi emission rates. Within these uncertainties, these slopes are statistically indistinguishable from the near unity regressions slopes for the full data sets (lines in the insert are the same as in the main graph).
The test-to-test trend data in help demonstrate the variability issue just mentioned. It presents FTP weighted average and phase by phase PM emissions rates for 17 repeat tests of the 2012 2.0 L GTDI vehicle. Three simultaneous PM measurements are displayed: filter collected PM mass from PFD, filter collected PM from CVS, and soot mass recorded from the CVS tunnel by MSS. Looking at the FTP weighted average filter data in the top left panel one observes significant discrepancies between the PFD and CVS methods. However, the PFD collected PM mass tracks very well the soot mass, whereas the CVS PM mass does not (note that incorrect MSS calibration introduces the upward shift in the site C soot data).
Figure 4. PM mass measured by PFD, in the CVS tunnel, and soot measured photoacoustically from 17 repeat FTP tests of the 2012 GDI test vehicle at two sites. The panels show FTP weighted average (top left) and phase by phase PM emissions rates. Note the different vertical scale for the cold start data. Lines are to help distinguish test-to-test trends between the different measurement methods.
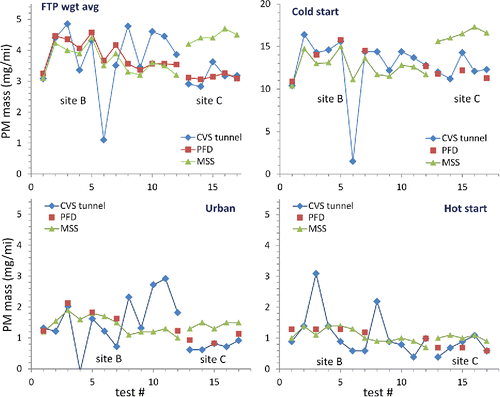
Looking now at the cold start data (top right panel), where PM emissions are relatively high, one sees that there is excellent agreement between PFD and CVS data. PFD values only appear for half the tests, because the other half were run with the single filter method described below. Similarly, all except one of the urban and one of the hot start phase PFD measurements exhibits good agreement with the CVS method, even at emissions rates of 1 – 2 mg/mi. Furthermore, the PFD measurements correlate well with MSS soot mass. What is notable is a number of tests for which the CVS measured PM mass deviates considerably, more than a factor of two, from the trend in this vehicle's PM emissions. These occur in the cold start phase of test 6, the urban phase of tests 4, 7, 8, 10, and 11, and hot start phase of tests 3 and 8.
Exactly what causes these outliers is not known. A speck of dust that lands on or falls off of a filter is one possibility, especially during the urban and hot start phases where the mass of PM collected via CVS tunnel in these tests was as low as 10 – 30 μg. If this happens to any of the three filters used to determine the FTP weighted average required for vehicle emissions certification, the result will be in error. This is why the comparison of PFD and CVS approaches in appears worse for the FTP weighted average than the individual test phases. One advantage of the single filter method is that it statistically decreases the impact of outliers on the FTP weighted average by a factor of nearly three.
Single vs. three filter FTP weighted average PM
Before presenting results comparing single filter and three filter methods, we provide some background on the variability concerns for low level PM emissions measurements that motivate this approach. US EPA emissions testing is based on the concept of the FTP weighted average, taken over the cold start, urban, and hot start phases of the test, numbered 1, 2, and 3, respectively. This is defined as[1]
[1] where PMwgt is the weighted average PM emissions rate, Mi is the mass emitted in phase i, and di is the distance traveled. Originally this was recorded by running the start plus urban phases twice, once as a cold start and again after a 10 minute soak as a hot start. Because engine and catalyst warm-up is complete during the start phase, the redundant second urban phase was subsequently dropped leading to the present day three phase FTP test. Consequently, based on Equation (Equation1
[1]
[1] ), the weighting factors become 0.43, 1, and 0.57, respectively, for the cold start, urban, and hot start phases.
In lieu of collecting PM onto three filters, this weighting can be performed physically onto a single filter. There are a variety of ways to accomplish this. One is to simultaneously measure PM by a real time aerosol instrument and use the relative phase integrated emissions to partition the total filter mass amongst the three phases (Bushkuhl et al. Citation2013). Alternatively, to avoid need of an additional instrument, one can weight by adjusting the fraction of diluted exhaust passing through the filter. The PM mass emitted by the vehicle is related to the mass collected on the filter via[2]
[2] where FCVS represents the CVS tunnel total flow rate, Ffilter, i is the flow rate through filter, mi is the PM mass collected on the filter, and mbak is the correction for the gaseous adsorption artifact. Weighting CVS tunnel measurements is conveniently achieved by adjusting the filter flow rates, e.g., reducing the filter flow to 43% of nominal reduces the amount of PM deposited on the filter by the required amount. However, there is a tradeoff; this reduction in collected mass increases filter weighing variability.
If Δm represents the filter weighing error, then based on Equations (Equation1[1]
[1] ) and (Equation2
[2]
[2] ), the propagated error in Mwgt in the three filter method is
[3]
[3]
This assumes that the three filter masses are statistically independent and that adsorption artifacts and handling errors are independent from one filter to another. The corresponding error for the flow weighted single filter is[4]
[4]
This assumes that the same nominal filter flow rate, Ffilter, is used for both methods, except for the reductions required to weight the cold and hot start phases. Comparing Equations (Equation3[3]
[3] ) and (Equation4
[4]
[4] ), we find that the flow weighted approach provides a 19% expected reduction in the variability of FTP weighted average PM mass.
Partial flow dilution can further lower the variability in FTP weighted average PM. Instead of reducing filter face velocity in phases 1 and 3 (cold and hot starts) to weight the PM reaching the filter, reduce the fraction of exhaust sampled. Sampling less exhaust lowers the amount of dilution air needed to achieve the minimum dilution factor of 7 and, thus, allows more PM to reach the filter. To see how this works, consider the relative exhaust flow rates for the 2.0 L GDI vehicle, which are 1: 0.65: 0.87 for phases 1 – 3, respectively. The optimum dilution factors will then be 7: 11 : 8 to satisfy the minimum dilution factor of 7 required by Part 1066 regulations. Applying the 0.43: 1: 0.57 weighting factors to the filter face velocity is equivalent to adding secondary dilution of 2.3: 1: 1.8; thus, the effective overall dilution becomes 16: 11: 14. For sample weighting, the 0.43: 1: 0.57 weighting is applied to the exhaust flow proportionality; thus, the relative exhaust sample fractions are 0.43: 0.65: 0.50. In this case the PM levels entering the PFD are highest during phase 2, thus the optimum effective dilution becomes 10.5: 7: 9.1. Comparing these dilution factors to their flow weighting counterparts, we find that sample weighing increases the amount of PM reaching the filter by about 55% and, therefore, reduces measurement variability by about 35% relative to flow weighting.
There is a second type of variability, namely random events causing the outliers discussed earlier. While the exact cause of these is unknown, we suspect that they originate from some type of filter mishandling, e.g., a speck of dust falls on the filter, it is inadvertently touched, it is misplaced in the robot weigher, etc. We assume that such events occur with probability p. Thus, the probability that at least one such event occurs in the three filter approach is 1 – (Equation1[1]
[1] -p)3 = 3p – 3p2 + p3. Since outliers are presumably rare events, p is very small, so this probability is approximately 3p. Thus, the single filter approach is expected to reduce outlier impact by nearly a factor of 3.
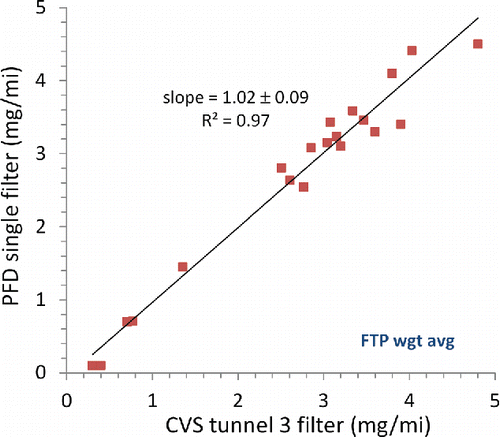
The data in demonstrate that the single filter approach yields results equivalent to the conventional method. It compares a set of simultaneous single versus three filter measurements of FTP weighted average PM emissions performed on 20 vehicle tests. Single filter data are recorded by PFD with sample weighting and three filter data are collected from the CVS tunnel. The results show good correlation between the two approaches, with a regression slope of 1.02 ± 0.09. A recent study by Sardar et al. (Citation2016) used the CVS tunnel flow weighting approach and demonstrated similarly good agreement between single and three filter measurements, a regression slope of 0.97 and correlation coefficient of R2 = 0.99. Thus, it appears that both single filter weighting options provide acceptable alternatives to the conventional three filter method.
Figure 5. Single versus three filter measurements of FTP weighted average PM mass emissions.
PFD measurement of US06 PM emissions
The US06 is an aggressive drive cycle used in emissions testing. The new US Environmental Protection Agency (EPA) Tier 3 and California Air Resources Board (CARB) LEV III regulations introduce PM emissions standards of 6 mg/mi for this cycle. The WLTP being implemented across the rest of the world includes a similar high speed drive cycle. There have been worries that high exhaust temperatures that accompany aggressive driving and high load driving lead to release of aerosol materials from within the vehicle exhaust system (Hall and Dickens Citation2000) as well as in the exhaust sampling system used to measure PM (Maricq et al. Citation1999). In addition, recent work shows that the nature of the PM changes during aggressive drive cycles, with higher instances of nucleation mode emissions and a reduction in the black carbon to elemental carbon ratio of the soot (Kamboures et al. Citation2015; Maricq et al. Citation2017). This affects the reliability of instrument measurements of PM, for example photoacoustic detection of soot and Dekati Mass Monitor determination of PM mass, and therefore places a higher reliance on the gravimetric filter method for the US06 cycle.
Hence, it is of interest to compare how partial flow dilution performs over the US06 cycle as compared to CVS tunnel measurements. presents PM measurements from the US06 portion of the same series of tests shown in , in which the vehicle was run over the combined FTP + US06 drive cycle. There are a number of interesting observations. First, the PFD measurements of PM mass generally agree very well with their CVS counterparts. There are three exceptions. The low CVS value in test 6 is likely an outlier, as discussed above, since it does not follow the general test to test trend exhibited by PFD values of PM mass and soot mass.
Figure 6. US06 cycle PM mass emissions recorded via PFD versus CVS tunnel and MSS. The lines are to help distinguish test-to-test trends amongst the different measurement methods.
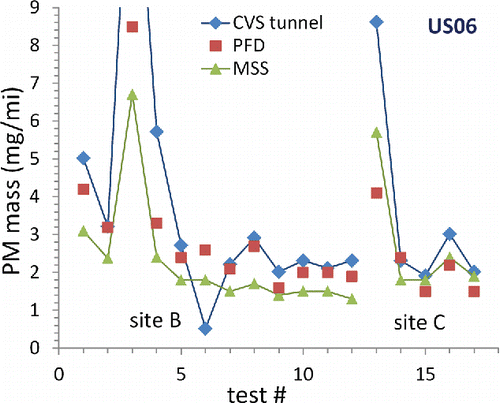
Tests 3 and 14 are the other two exceptions. These are different, because all three parallel measurements of PM exhibit a substantial deviation from the general trend, albeit to a different degree. The effect is most marked for the CVS tunnel PM measurement (the value for test 3 is 15 mg/mi), and about a factor of two lower for the PFD and soot mass measurements. These tests are both the first ones to follow a period on the order of weeks during which the vehicle did not run. The high emissions likely represent release of stored material from the vehicle exhaust system or the transfer hose between vehicle tailpipe and exhaust sample point. It is possible that the ∼10 meters of transfer hose to the CVS tunnel versus ∼1.5 meters to PFD sample point exacerbates these effects, but a detailed examination of this was not pursued.
The third observation is that soot mass is relatively lower in the US06 cycle as compared to the FTP data in . Based on the test site B data, where the MSS had a good calibration, soot represents 94% of the total PM mass for the weighted FTP cycle, but this falls to 71% for the US06 cycle. This occurs either from an increase in the organic component of PM or from a decrease in soot optical absorption (Kamboures et al. Citation2015; Maricq et al. Citation2017). Nevertheless, the MSS measurement of soot provides a useful quality control for the filter based PM mass determination; namely a significant deviation from the ∼70% value raises a flag that the filter measurement might be compromised.
Discussion and conclusions
Partial flow dilution provided heavy duty engine manufacturers an attractive alternative to full flow dilution tunnels for use in engineering and certification to meet the EPA 2007 PM emissions standards. At the time, there was less interest from the light duty vehicle side. The port fuel injection technology gasoline engines prevalent in US cars and light trucks easily met the 10 mg/mi PM emissions standard. And in Europe the focus was on solid particle number standards. Two recent events changed this. First, GDI / GTDI technology was introduced to improve fuel economy (Yi et al. Citation2009), but with the drawback of increased PM emissions owing to direct injection of fuel into the engine cylinder (Zhang and McMahon Citation2012; Saliba et al. Citation2017). Second, CARB LEV III and EPA Tier 3 regulations lowered the PM emissions standard to 3 mg/mi. The combination produced a sudden surge in demand for facilities able to cope with low level PM measurement.
The principal requirement for partial flow dilution is the ability to sample exhaust proportionally to its flow rate, and this introduces the need to measure exhaust flow rate. This is not an easy task; indeed the main advantage of the full flow CVS tunnel approach is that exhaust flow rate is not needed to determine PM emissions rates. Two possibilities to measure exhaust flow include the pitot tube and ultrasonic methods. The latter was chosen because its wider dynamic range is better suited to the cover the broad range of engine displacements that an emissions test site must handle. However, there is no golden standard against which to compare its performance. The present study shows good agreement against the CO2 tracer method. In fact, the ultrasonic method may be superior; the scatter in the second by second regression arises at least partly from the tracer method's slower response time.
PM mass emissions measured by PFD agree very well with their conventional CVS counterparts, with a regression slope of 1.03 ± 0.03. The comparison is complicated by outliers, filter recorded PM mass that differs by more than a factor of two from what is expected. For reasons that are unclear, these appear almost entirely in the CVS tunnel measurements. The filters are handled the same way for both PFD and CVS measurements. Both samplers include a 2.5 μm cyclone to reduce interference from large particles. The biggest difference between the PFD and CVS methods in the present work is the 2 – 3 times higher dilution by the latter, which at least increases the likelihood of outliers in the CVS measurements. One possibility is that this is a consequence of the daily routine testing done with the CVS tunnels, whereas the PFDs are newly installed. More experience with PFDs in light duty test cells will tell if they remain freer of outliers than CVS tunnels.
One factor in the lower number of outliers associated with PFD sampling, e.g., in , is the use of the single filter method, since this reduces the chance of an outlier contributing to the FTP weighted average PM mass. Besides the outlier impact, single filter measurement reduces variability. Partial flow dilution allows sample weighting to adjust the PM mass collected per phase as required under EPA regulations. In fact, this fits their natural mode of operation, namely sampling proportionally to exhaust flow; one only needs to adjust the proportionality factor between FTP phases. Flow weighting would be more difficult, requiring additional circuitry to divert a portion of the flow around the filter. Sample weighting, in turn, permits optimization of dilution factors and reduces variability by ∼35% relative to the flow weighted sampling used in the CVS tunnel. The option to apply sample weighting has now been explicitly included into Part 1066 regulations (EPA Citation2016b).
Besides the improvements in variability, partial flow dilution offers a number of advantages over the CVS tunnel for the automotive industry. Upgrading emissions tests cells can be done without installation of large blowers and air handling systems needed for CVS tunnels, reducing infrastructure modifications and costs. PFDs can more readily be installed to sample from close to the tailpipe, 1 – 2 meters, yet accommodate various size vehicles and front or rear wheel drive. This in turn reduces contamination from long transfer hoses commonly used to convey exhaust from vehicle tailpipe to CVS tunnel. The present results demonstrate the equivalency between PFD and CVS methods needed to adopt the former methodology. Additional studies, such as Phase 2 of the Coordinating Research Council E-99 project (Jung et al. Citation2017b) can help corroborate the present results and provide additional improvements to partial flow dilution for light duty PM testing.
Acknowledgments
The authors thank the larger team that was involved in the various phases of planning, evaluating, installing, and integrating PFD capability into Ford's emissions test cells. This includes Todd Brooks, Tony Byrd, Dan Carpenter, Janice Caswell, Rob Choma, Teri Eggenberger, Eric Foote, Mark Guenther, Travis Henney, Terry Laskowsky, Chris Lounds, Mark Polster, and Michael Sherman.
Related Research Data
References
- Anderson, R., Azelborn, N., and Wade, W. (1974). Critical Flow Venturi, U.S. Patent 3817100A.
- Bushkuhl, J., Silvis, W., Szente, J., and Maricq, M. (2013). A New Approach for Very Low Particulate Mass Emissions Measurement. SAE Int. J. Engines, 6:1152–1162.
- Chang, M. C. O., and Shields, J. E. (2017). Evaluation of Solid Particle Number and Black Carbon for Very Low Particulate Matter Emissions Standards in Light-Duty Vehicles. J. Air Waste Manag. Assoc. 67:677–693.
- Chase, R. E., Duszkiewicz, G. J., Richert, J. F. O., Lewis, D., Maricq, M. M., and Xu, N. (2004). PM Measurement Artifact: Organic Vapor Deposition on Different Filter Media. SAE Technical Paper, 2004–01-0967.
- Chase, R. E., Duszkiewicz, G. J., Lewis, D., and Podsiadlik, D. H. (2005). Reducing PM Measurement Variability by Controlling Static Charge. SAE Technical Paper 2005–01-0193.
- Engeljehringer, K., Schindler, W., and Sulzer, R. (1993). Meeting ISO 8178 Requirements for the Measurement of Diesel Particulates with Partial-Flow Dilution Systems. SAE Technical Paper 932466.
- Environmental Protection Agency (2016a). Code of Federal Regulations, Title 40: Protection of Environment, Part 1065: Engine-testing Procedures. https://www.ecfr.gov/cgi-bin/text-idx?SID=f6088078f395dcbf83232ff472c90e7f&mc=true&node=pt40.37.1065&rgn=div5
- Environmental Protection Agency (2016b). Code of Federal Regulations, Title 40: Protection of Environment, Part 1066: Vehicle-testing Procedures. http://www.ecfr.gov/cgi-bin/text-idx?SID=6c78b46d9c39453655d5dafb5238f476&mc=true&node=pt40.37.1066&rgn=div5
- Foote, E., Maricq, M., Sherman, M., Carpenter, D., Guenther, M., Peabody, J., Polster, M., Szente, J., and Loos, M. (2013). Evaluation of Partial Flow Dilution Methodology for Light Duty Particulate Mass Measurement. SAE Technical Paper 2013-01-1567.
- Guenther, M., Vaillancourt, M., and Polster, M. (2003). Advancements in Exhaust Flow Measurement Technology. SAE Technical Paper 2003-01-0780.
- Hall, D. E. and Dickens, C. J. (2000). Measurement of the Numbers of Emitted Gasoline Particles: Genuine or Artefact? SAE Technical Paper 2000-01-2957.
- Hu, S., Zhang, S., Sardar, S., Chen, S., Dzhema, I., Huang, S. M., Quiros, D., Sun, H., Laroo, C., Sanchez, L. J., Watson, J., Chang, M. C. O., Huai, T., and Ayala, A. (2014). Evaluation of a Gravimetric Method to Measure Light-Duty Particulate Matter Emissions at Levels Below One Milligram Per Mile (1mg/mile). SAE Technical Paper, 2014-01-1571.
- Jung, H., Johnson, K. C., Russell, R. L., Durbin, T. D., Miller, W., Xue, E. J., Swanson, J., and Kittelson, D. (2016). Very Low PM Mass Measurements. Coordinating Research Council Project E-99.
- Jung, H., Johnson, K. C., Russell, R. L., Durbin, T. D., Miller, W., Xue, E. J., Swanson, J., and Kittelson, D. (2017a). Very Low Particle Matter Mass Measurements from Light-Duty Vehicles. J. Aerosol Sci., ( submitted).
- Jung, H., Johnson, K. C., Russell, R. L., Durbin, T. D., Miller, W., Xue, E. J., and Kittelson, D. (2017b). Very Low PM Mass Measurements. Coordinating Research Council Project E-99 Phase 2. https://www.crcao.org/reports/recentstudies2017/E-99-2/E-99-2%20Exec%20Summary.pdf
- Kamboures, M. A., Rieger, P. L., Zhang, S., Sardar, S. B., Chang, M. C. O., Huang, S. M., Dzhema, I., Fuentes, M., Benjamin, M. T., Hebert, A., and Ayala, A. (2015). Evaluation of a Method for Measuring Vehicular PM with a Composite Filter and a Real-Time BC Instrument. Atmos. Environ., 123:63–71.
- Khalek, I. A. (2007). 2007 Diesel Particulate Measurement Research. Coordinating Research Council Project E-66-Phase 3. https://crcao.org/reports/recentstudies2007/E-66-3/E-66%20Phase%203%20Final%20Report%20R8-%20IAK-Revised%2010SEP2007.pdf
- Khalek, I. A., Bougher, T., and Jetter, J. J. (2010). Particle Emissions from a 2009 Gasoline Direct Injection Engine Using Different Commercially Available Fuels. SAE Technical Paper 2010-01-2117.
- Khalek, I. A., Ullman, T. L., Shimpi, S. A., Jackson, C. C., Dharmawardhana, B., Silvis, W. M., Kreft, N., Harvey, R. N., Munday, D., Yamagishi, Y., Graze, R., Smitherman, J., and Adkins, J. (2002). Performance of Partial Flow Sampling Systems Relative to Full Flow CVS for Determination of Particulate Emissions Under Steady-State and Transient Diesel Engine Operation. SAE Technical Paper 2002-01-1718.
- Kupnik, M., Schroder, A., O'Leary, P., Benes, E., and Groschl, M. (2004). An Ultrasonic Transit-Time Gas Flowmeter for Automotive Applications. In Sensors, 2004. Proceedings of IEEE (pp. 451–454). IEEE.
- Maricq, M. M., Chase, R. E., Podsiadlik, D. H., and Ogt, R. (1999). Vehicle Exhaust Particle Size Distributions: A Comparison of Tailpipe and Dilution Tunnel Measurements. SAE Technical Paper 1999-01-1461.
- Maricq, M. M., Szente, J. J., Harwell, A. L., and Loos, M. J. (2016). How well can Aerosol Instruments Measure Particulate Mass and Solid Particle Number in Engine Exhaust? Aerosol Sci. Technol., 50:605–614.
- Maricq, M. M., Szente, J. J., Harwell, A. L., and Loos, M. J. (2017). Impact of Aggressive Drive Cycles on Motor Vehicle Exhaust PM Emissions. J. Aerosol Sci., 113:1–11.
- Saliba, G., Saleh, R., Zhao, Y., Presto, A. A., Lambe, A. T., Frodin, B., Sardar, S., Maldonado, H., Maddox, C., May, A. A., Drozd, G. T., Goldstein, A. H., Russell, L. M., Hagen, F. P., and Robinson, A. L. (2017). A Comparison of Gasoline Direct Injection (GDI) and Port Fuel Injection (PFI) Vehicle Emissions: Emission Certification Standards, Cold Start, Secondary Organic Aerosol Formation Potential, and Potential Climate Impacts. Environ. Sci. Technol., 50:13592–13599.
- Sardar, S. B., Zhang, S., Frodin, B., McMahon, W., Huang, S. M., Larson, L., Chang, M. C. O. (2016). Evaluation of PM Measurement Precision and the Equivalency of the Single and Three Filter Sampling Methods for LEV III FTP Standards. SAE Int. J Engines, 9:342–354.
- Schindler, W., Haisch, C., Beck, H. A., Niessner, R., Jacob, E., and Rothe, D. (2004). A Photoacoustic Sensor System for Time Resolved Quantification of Diesel Soot Emissions. SAE Technical Paper 2004-01-0968.
- Schweizer, T., and Stein, H. J. (2000). A New Approach to Particulate Measurement on Transient Test Cycles: Partial Flow Dilution – Alternative to CVS Full Flow Systems. SAE Technical Paper 2000-01- 1134.
- Wiers, W. W. and Scheffler, C. E. (1972). Carbon Dioxide (CO2) Tracer Technique for Modal Mass Exhaust Emission Measurement. SAE Technical Paper 720126.
- Yi, J., Wooldridge, S., Coulson, G., Hilditch, J., Iyer, C. O., Moilanen, P., Papaioannou, G., Reiche, D., Shelby, M., VanDerWege, B., Weaver, C., Xu, Z., Davis, G., Hinds, B., and Schamel, A. (2009). Development and Optimization of the Ford 3.5 L V6 EcoBoost Combustion System. SAE Int. J. Engines, 2:1388–1407.
- Zhang, S., and McMahon, W. (2012). Particulate Emissions for LEV II Light-Duty Gasoline Direct Injection Vehicles. SAE Int. J. Fuels Lubr., 5:637–646.